© 2017, IRJET | Impact Factor value: 5.181 | ISO 9001:2008 Certified Journal | Page 78
Technique
Shubhangi
1, Shubham Singh
2, Shubham Bisht
31, 2, 3
UG Scholar, Dept. of CSE, GCET, Greater Noida, UP, India
---***---Abstract –
Image edge detection is a technique of segmenting an image into regions of discontinuity thereby marking sharp changes in intensity. Ant Colony Optimization is a meta-heuristic approach based on the foraging behavior of ants. This paper proposes a modified ACO algorithm to detect the edges in an image by updating the pheromone matrix twice and using weighted heuristics. The technique can be considered as an improvement to the original ant system. The approach presented in this paper can handle broken edges in an image and renders higher efficiency than other conventional techniques for edge detection.Key Words: Edge Detection, Pheromone Matrix, Ant Colony Optimization, Weighted Heuristics, Otsu Thresholding.
1. INTRODUCTION
Image Processing is any operation that takes an image as an input and produces an output which maybe an image or a set of parameters related to an image. One of the most popular and complex problems of image processing is edge detection. An edge represents the contour features of the objects in an image and occurs as a sharp change in intensity from one pixel to another in an image.
Image edge detection is a crucial part of image analysis and computer vision. It is a pre-processing stage in a number of applications in the areas of feature extraction. Various techniques have been proposed until now to detect the edges in an image. Some of these include Sobel, Prewitt, Laplacian and Canny operators. Ant Colony Optimization is another approach inspired by the natural behavior of ants while searching for food. The conventional approaches to edge detection involve higher computational costs as these operations are conducted for every pixel of the image. ACO is a probabilistic method that aims to find the optimized solution of the edge detection problem through a guided search over the solution space by constructing the pheromone matrix. In an ACO algorithm, ants move through a search space, the graph, which consists of nodes and edges. The movement of the ants is controlled by the transition probabilities, which reflects the likelihood that an ant will move from a given node to another. This value is influenced by the heuristic information and the pheromone information.
The heuristic information depends on the instance of the problem and it can be determined initially. Pheromone
values are used and updated during the search. The algorithm is based on the fact that if two or more ants follow the same path, the Pheromone values are increased. The path along which the Pheromone value is maximum is taken as the shortest path resulting in an edge in the image. The performance of the ACO algorithm depends on route construction and Pheromone updates.
The algorithm consists of three main steps. The first is the initialization process. The second is the iterative construction-and-update process, where the goal is to construct the final pheromone matrix. The construction-and-update process is performed several times, once per iteration. The final step is the decision process, where the edges are identified based on the final pheromone values. In this paper, certain modifications have been made to the existing ACO approach which has led to higher quality of edges detected in an image, which is essential for different object recognition applications.
2. ANT COLONY OPTIMIZATION
In this section, a theoretical discussion on the ant colony optimization meta heuristic and ant colony system, one of the main extensions to AS has been provided which describes in detail about extracting the edge information from the image using ACO.
© 2017, IRJET | Impact Factor value: 5.181 | ISO 9001:2008 Certified Journal | Page 79 Fig – 1: General Procedure for ACO approach
The initialization step is performed at the beginning. In this step, the necessary initialization procedures, such as setting the parameters and assigning the initial pheromone values, are done.
The SCHEDULE_ACTIVITIES construct regulates the activation of three algorithmic modules: (1) the construction of the solutions, (2) the optional daemon actions that improve these solutions, and (3) the update of the pheromone matrix. This construct is repeated until the termination criterion is met. An execution of the construct is considered an iteration.
ConstructAntSolutions. In this process, a set of artificial ants construct solutions from a finite set of solution components from a fully connected graph that represents the problem to be solved. Certain steps are followed in this phase.
Ants traverse the graph until each has made the target number of construction steps. The solution construction process starts with an empty partial solution, which is extended at each construction step by adding a solution component. The solution component is chosen from a set of nodes neighbouring the current position in the graph. The choice of solution components is probabilistic. The exact decision rule for choosing the solution components varies across different ACO variants. The most common decision rule is the one used in the original AS. On the nth construction process, the kth ant moves from node i to node j according to the transition probability pi,j(n) the probability that an ant will move from node i to node j.
DoDaemonActions : These are some additional actions that are needed to be performed after the solutions have been constructed before updating the pheromone values. Such actions, usually called daemon actions, are those which cannot be performed by a single ant. Such actions are generally problem specific or centralized to improve the solution or search process.
UpdatePheromones : After each construction process and after the daemon actions have been performed, the pheromone values are updated. The goal of the pheromone update is to increase the pheromone values associated with good solutions and decrease those associated with bad ones. This is normally done by decreasing all the pheromone values (evaporation) and increasing the pheromone values associated with the good solutions (deposit). Pheromone evaporation implements a form of forgetting, which prevents premature convergence to sub-optimal solutions and favors the exploration of new areas in the graph.
3. PROPOSED ACO BASED EDGE DETECTION
ALGORITHM
In the proposed algorithm, two changes have been introduced to the original ACO approach. The model used to describe the proposed work is an image where each pixel represents both a node and an edge in the graph. Ants move from one pixel to another based on the heuristic information that is determined by the local intensity variations. The components of the transition and pheromone matrices are also associated with the pixels in the image.
The first change introduced to the previous algorithm is the technique to determine heuristic information. Weights are used for calculating the heuristic value. The weight is reduced as the ant moves farther. This provides additional information about the neighbourhood to calculate transition probability. The initial pheromone matrix in the proposed approach is assigned by the value 1/ (M1 M2) which allows the ants to explore the pixels other than edge pixels. Another change to the ACO algorithm involves two updates to the pheromone matrix unlike the single update step in many other approaches in this field.
3.1 Initialization Process
In the initialization process, each of the K ants is assigned a random position in the M1 × M2 image. The initial value of each element in the pheromone matrix is set to a constant τinit, which is small but non-zero. Also, the heuristic information matrix is constructed based on the local variation of the intensity values as given by eqn 1. The heuristic information is determined during initialization since it is dependent only on the pixel values of the image, thus, constant.
ƞ
i,j= V
c(i,j) / V
max(1) [image:2.595.376.489.579.692.2]
Vc(i,j) is a function that operates on the local group of pixels as shown in Figure 2.
Fig -2 : Local configuration to compute intensity variation at pixel (i,j)
© 2017, IRJET | Impact Factor value: 5.181 | ISO 9001:2008 Certified Journal | Page 80 Fig - 3 : Neighbours of pixel (i,j)
V
c(i,j) = | I
i - 2, j - 1– I
i + 2, j + 1| + | I
i - 2, j + 1– I
i + 2, j - 1| +
| I
i – 1, j – 2– I
i + 1, j + 2| + | I
i – 1, j + 2– I
i +1, j – 2| +
| I
i – 1, j – 1– I
i +1, j + 1| + | I
i – 1, j + 1– I
i + 1, j – 1| +
| I
i – 1, j– I
i + 1, j| + | I
i, j -1– I
i, j + 1|
(2)
3.2 Iterative Construction and Update Process
On every iteration, each ant moves across the image, from one pixel to the next, until it has made L construction steps (a construction step consists of a single movement from one pixel to another). An ant moves from the pixel (i0, j0) to an adjacent pixel (i,j) according to the pseudorandom proportional rule.
Each time an ant visits a pixel, it immediately performs a local update on the associated pheromone. The amount of pheromone on the pixel (i, j) on the nth iteration, τi,j(n) is updated based on the equation 3 for ACS local pheromone update:
τ
i,j(n)= ( 1 – φ ). τ
i,j(n)+ φ · τ
init(3)
where φ is the pheromone decay coefficient and
τ
init is theinitial pheromone value.
Therefore the proposed approach performs both the update steps, one after each ant has moved and the other after all ants on each building step have moved, unlike only one update step in many other techniques proposed on the similar topic. An attempt to alter the algorithm to one update process yielded a binary image with missing information. The update process, which updates the pheromone matrix after each ant is moved, is given by eqn 3.
The heuristic information is added into the ant’s memory and used for further steps. The second update is made at the end of each building step i.e. all the ants K within the step have moved.
It is a very important process as it incorporates the results from the previous steps to determine if at each pixel it is an edge or not. An iterative method is first applied to compute a threshold value T in order to find out the edge information, This threshold value is used on the Pheromone matrix. To convert the intensity image to binary image, a normalized intensity value in the range of [0, 1] is considered. Using the starting threshold value, the histogram is segmented into two parts. The mean of the gray values associated with the foreground pixels and the sample mean of the gray values associated with the background of the pixels are computed. This new threshold value is considered as the average of the two samples.
This process is recurred based on the new threshold value until here is no change in the value noted. The initial threshold value is considered as the mean value for the pheromone matrix. Each index value of the pheromone matrix is segregated as below the initial threshold value or above the threshold value.
Based on these two categories the average of the mean values is computed which is the new threshold value. As, mentioned earlier this process is repeated till the threshold value becomes constant.
[image:3.595.328.533.468.587.2]The approach described here is popular as the Otsu thresholding technique [8]. The overall edge detection process using the proposed technique has be summarized in the Figure 4.
Fig - 4 : Image Edge detection using modified ACO algorithm
4. EXPERIMENT AND RESULTS
Based on the technique proposed in the paper, experiments were conducted on some test images. The ACO algorithm was implemented in C language and the program was run on a system with Intel Core i5 and 4 GB RAM. The processing time for a 256×256 image is around 2.8 seconds.
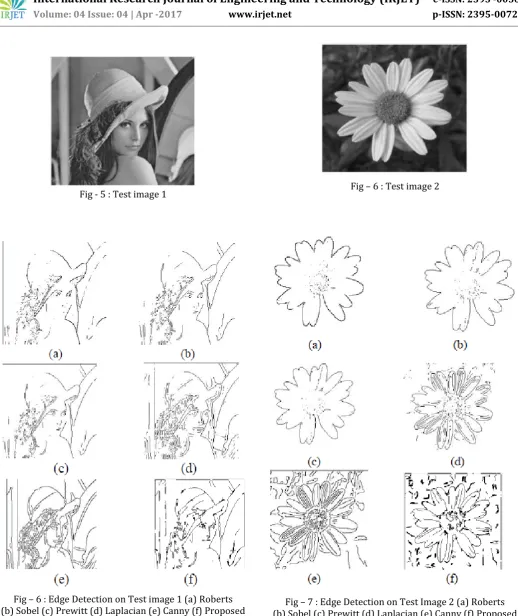
© 2017, IRJET | Impact Factor value: 5.181 | ISO 9001:2008 Certified Journal | Page 81 Fig - 5 : Test image 1
Fig – 6 : Edge Detection on Test image 1 (a) Roberts (b) Sobel (c) Prewitt (d) Laplacian (e) Canny (f) Proposed
[image:4.595.38.557.57.674.2]ACO approach
Fig – 6 : Test image 2
Fig – 7 : Edge Detection on Test Image 2 (a) Roberts (b) Sobel (c) Prewitt (d) Laplacian (e) Canny (f) Proposed
ACO approach
5. CONCLUSION
© 2017, IRJET | Impact Factor value: 5.181 | ISO 9001:2008 Certified Journal | Page 82 handles broken edges without any error.
Based on the experiments conducted on the test images by applying both ACO algorithm and the conventional operators for edge detection, the results have been summarized in Table 1. It can be clearly observed that the quality of edges detected using the proposed ACO is higher than other techniques.
Table – 1 : Comparative Analysis of Edge Detection Techniques
Edge Detection Technique Results
Sobel operator may not be discontinuous Edges are thicker, may or
Roberts operator Prominent discontinuities, Thickest edges
Prewitt operator Thin edges with discontinuities
Laplacian operator
Better than Sobel, Prewitt and Roberts. Malfunctioning occurs at
corners and curves
Canny operator Complex to implement but good for noisy images
Proposed ACO approach
Thin and clear edges, Simple to implement, Higher execution speed,
Continuous edges
ACKNOWLEDGEMENT
This research was encouraged by Mr. Rajiv Kumar Nath, Assistant Professor in the Dept. of CSE, GCET, Greater Noida, UP, India. His comments and suggestions greatly improved the manuscript. We would also like to extend our gratitude to Mr. Manish Kumar Sharma, Assistant Professor, Dept. of CSE, GCET, Greater Noida, India for sharing his pearls of wisdom with us during the course of this research.
REFERENCES
[1] M. Nayak and P. Dash, “ Edge Detection Improvement by Ant Colony Optimization Compared to traditional Methods on Brain MRI Image ”, Communications on Applied Electronics, Vol. 5 – No. 8, pp. 19 – 23, 2016. [2] P. Thukaram and S. J. Saritha, “ Image Edge Detection
Using Improved Ant Colony Optimization Algorithm ”, International Journal of Research in Computer and Communication Technology, Vol. 2 – No. 11, pp. 1256 – 1260, 2013.
[3] M. Dutta and P. Rai, “ Image Edge Detection Using Modified Ant Colony Optimization Algorithm based on
Computer Applications, Vol. 68 – No. 15, pp. 5 – 9, 2013. [4] C. Gupta and S. Gupta, “ Edge Detection of an Image based on Ant Colony Optimization Technique ”, International Journal of Science and Research, Vol. 2 – No. 6, pp. 114 – 120, 2013.
[5] J. Li and P. Xiao, “ An Improved Ant Colony Optimization Algorithm for Image Extracting ”, International Conference on Apperceiving Computing and Intelligence Analysis, 2010.
[6] C. C. Chen and D. S. Lu, “ Edge Detection Improvement by Ant Colony Optimization ”, Elsevier PatternRecognition Letters, Vol. 29 – No. 4, pp. 416 – 425, 2008.
[7] M. Dorigo and T. Stutzle, “ Ant Colony Optimization ”, IEEE Computational Intelligence Magazine, Vol. 1, pp. 28 – 39, 2006.
[8] H. N. Pour, E. Rashedi and S. Saryazdi, “ Edge Detection using Ant Algorithms ”, Soft Computing, Vol. 10, pp. 623 – 628, 2006
[9] M. Batouche and S. Ouadfel, “ Ant Colony System with Local Search for Markov random field image segemntation ”, IEEE International Conference on Image Processing, pp. 133 – 136, 2003.
[10] N. Otsu, “ A Threshold Selection Method from Gray – Level Histograms ”, IEEE Transactions on Systems, Man and Cybernetics, Vol. 9 – No. 1, pp. 62 – 66, 1979. [11] S. Calvard and T. W. Ridler, “ Picture Thresholding using