© 2017, IRJET | Impact Factor value: 5.181 | ISO 9001:2008 Certified Journal | Page 3163
Design and Performance Analysis of Solar Powered Absorption Cooling
System for Computer Laboratory
Khagendra Kumar Upman
a, B.L.Gupta
b*, Dhananjay Kumar
cPrashant Kumar Baheti
da,c
Apex Institute of Engineering and Technology Jaipur
302017 India.
b
Department of Mechanical Engineering, Govt. Engineering College Bharatpur 321001 India.
dDepartment of Computer Science and Engineering, Govt. Engineering College Bharatpur 321001 India.
---***---Abstract: This study covers the performance analysis of solar thermal cooling system for a computer lab situated in Government Engineering College Bharatpur using Flat Plate Collector, Evacuated Tube Collector and Compound Parabolic Collector. The computer lab has the floor and roof area 198.55 m2 .The peak cooling load is calculated and it is 34.940 kW, accordingly 10TR vapor absorption cooling system was adopted. The 10 TR vapour absorption system was operated by a field of collector area varying from 80-120 m2..The other parameters like hot storage tank, cold storage tank, pump, cooling tower etc are used. The simulation was carried out on TRANSOL Program for Bharatpur city situated in east of Rajasthan (INDIA). Parametric study and performance analysis of solar thermal cooling system has been carried out, considering the annual solar fraction, primary energy savings and electrical (grid) COP. It can be conclude that solar thermal cooling system is technically feasible because it offers good solar fraction in the range of 0.52-0.75 in the considered city and collector areas. The primary energy savings reaches up to 52%. In the solar thermal cooling system as the collector area increases the solar fraction also gets increased but after an optimum collector area it starts decreasing because at elevated temperature heat losses are also higher. If we use a high collector area then we have to increase either the capacity of storage tank or the cooling demand of the building otherwise there will be no effect of collector area after an optimum value. The highest solar fraction has been observed as 0.63, 0.72, and 0.75 for FPC/ETC/CPC for the collector area range in 80-120 m2.
Keywords: Vapor Absorption system, Solar Thermal Collector, Solar Fraction, Primary Energy
1. Introduction
To improve the thermal comfort conditions, particularly in the summer season, there is growing demand of
conventional vapour compression air conditioners. This growing demand not only increases electricity consumption but also global warming. Building architectural characteristics and trends like increasing ratio of transparent to opaque surfaces in the building envelope to even popular glass buildings has also significantly increased the thermal load on the air conditioners [Henning 2007]. The conventional vapour compression refrigeration cycle driven air conditioner using grid electricity, increases the consumption of electricity and fossil energy. Energy sources based on fossil fuels such as coal, oil, gas, nuclear, etc., are cause serious environmental hazards and are scarce in nature, location and volume. To reduce environmental pollution and global warming in Balghouthi et al. [2005] suggested the solar power air conditioning in place of conventional vapour compression air conditioning systems. Assilzadeh et al. (2005) carried out the modeling and simulation of absorption solar cooling system with TRNSYS program. In this paper a 3.5 kW (one ton refrigeration) system was simulated by using a typical metrological year file containing the weather parameters for Malaysia. The optimized system consists of 35 m2 evacuated tubes solar
collector at 20°. They suggested that in order to achieve the continuous operation of the generator and increase in the reliability of the system, a hot water storage tank is essential for high quality performance. Pongtornkulpanich et al. (2008) share the experience with fully operational solar driven 10 ton LiBr/H2O single effect absorption
cooling system in Thailand. They analyzed the data collected during 2006 and show that 72 m2 evacuated tube
solar collector delivered a yearly average solar fraction of 81%, while LPG –fired backup unit supplied the 19% thermal energy. They show that the initial cost of installation is higher than that of the conventional vapour compression system due to higher cost of solar collector array and chiller. Technology advancement, large production, and increase in price of electricity in future can make it more cost competitive with the conventional
system. Mateus et al. (2009) performed the energy and economic analysis of an integrated solar absorption cooling and heating system in three different location and climates. An office building, a hotel and a single family house were used for analysis and it was found that with the present energy cost, the solar integrated system is not justifiable in any location, using economical consideration only. Annual solar fraction is achieved 20-60% and compare to the flat plate collectors, vacuum tube collectors allow a reduction in collector area between 15 and 50 %. Eicker et al. (2009) develops a full simulation model for absorption cooling systems, combined with a stratified storage tank, dynamic collector model and hourly building loads. They found that depending on control strategy, location and cooling load time series, between 1.7 and 3.6 m2 vacuum tube collector per kW cooling load are required
to cover 80% of the cooling load.Tsoutsos et al. (2010) take for granted that the air conditioning is responsible for a large percentage of the greenhouse and ozone depletion effects. They suggest the solar cooling system for zero emission technologies and to reduce energy consumption and CO2 emission. In this paper a study is carried out to
simulate the solar absorption cooling system for a Greek hospital that required 123911 kWh annual cooling energy. The peak power of cooling was 121 kW and to meet this 70 kW absorption and 50 kW compression chillers were used. They find out that 200 m2 solar thermal collector area is
not suitable for this application and solar fraction of 74.23% is achieved with the 500m2 collector area. Y Hang
et al. (2011) carried out economical and environmental assessment of an optimized solar cooling system for a medium sized benchmark office building in Los Angeles (California) having the floor area 4983 m2. In this building
150 kW capacity absorption chiller was used with varying collector area of 80-490 m2. The Payback is calculated as
13.8 years when the 40% subsidy is provided on capital investment.
Renato M. Lazzarin (2013) analyzed the solar thermal cooling system with the flat plate, evacuated tube collector and parabolic trough collectors with tracking system. The system are evaluated during sunny days and compared with the PV driven system and found that the PV driven system is now quite comparable. Eicker et al. (2014) performed the primary energy analysis and economic evaluation of solar thermal cooling and solar photovoltaic cooling system, the comparison is made for three different climates corresponding to the Palermo, Madrid and Stuttgart. The same building area and geometry was used
with a different user profiles and construction properties, consequently different cooling loads, in total 12 cases are taken into consideration. The primary energy savings reaches 50% with photovoltaic cooling systems while in the case of solar thermal system relative primary energy savings reaches 37% in Palermo, 36% in Madrid and 29% in the Stuttgart. Various literature conclude that the primary energy saving and, economic analysis are different for different climates, countries and electric prices. In the present work parametric study and performance analysis of solar thermal cooling systems has been performed considering the annual solar fraction and relative primary energy savings. In the solar thermal cooling system, three types of collectors (FPC, ETC and CPC) with wide variance of area ranging from 80 m2-120 m2 have been considered.
2 Specification of Building Coupled with Solar Air
Conditioning.
The building being used in this research work is a computer lab situated in Government engineering college, Bharatpur rectangular shape building with envelope of 15.69 m length and 12.65 m width. The height of the building is 3.64 m and total floor area is 198.55 m2. The
entire building is used for laboratory purpose in day time only and whole area is conditioned .The detail dimension of building is given as follows:
1. Length of building = 15.690 m 2. Width of building = 12.655 m 3. Height of building = 3.64 m
4. Dimensions of 5 south wall glass windows = 1.65 × 1.5 m
5. Dimensions of 5 west wall glass windows = 1.65 × 1.5 m
6. Dimension of north wall door = 2.55 × 1.5 m 7. Dimension of north wall door = 2.52 × 0.92 m
Volume: 04 Issue: 06 | June -2017 www.irjet.net p-ISSN: 2395-0072
Fig.1 Computer lab of Govt. Engg. College Bharatpur (Top view)
Table 1 Climatic condition of Bharatur City S.No. City
Parameters Bharatpur
1 Climate Zone Hot and Dry
2 L titude N 27.2170
3 Longitude E 77.4895
4 Elevation (m) 183
5 Maximum Temp.(C) 41.6
6 Average RH (%) 55
3. Building Cooling Demand Analysis
After the maximum cooling load of the building was calculated the model of solar thermal cooling system was made in the TRANSOL software and selecting the appropriate input data and parameters. Fig.2 shows the annual cooling demand of simulated case and it has been observed that the annual cooling demand is high for Bharatpur city because of the high ambient temperature. The cooling demand is high in the months of May, June and July because the temperature is increased in the month of May, June and July.
[image:3.612.51.285.111.290.2]
Fig. 2 Annual Cooling Demand
4 Solar Thermal Cooling Systems
This system is simulated using a configuration SCH 601 from the program as shown in the fig 3. This configuration shows the complete heating, cooling and domestic hot water application. In this study only cooling is considered for analysis purpose. The solar thermal cooling system is composed of a solar collector field, solar storage tank, heat exchanger, cold storage tank and vapour absorption chiller. The solar collector field captures energy from the sun and exchanges it with the solar storage tank through an external heat exchanger. Two pumps are used in the solar collector loop, one is from solar collector to heat exchanger and another is from heat exchanger to solar storage tank. These pumps are known as primary and secondary pump respectively and operated by solar loop control depending on solar radiation intensity. The pump flow rate is constant. The system stops the pumps if the temperature in the solar storage tank exceeds the maximum security value. A vapour absorption machine (VAM) is directly connected to the solar storage tank, this machine is turned on when cooling is required and the temperature of the solar tank is over a set point temperature [Bongs, 2009]. The heat coming from the absorber and condenser is released by cooling tower controlled by a variable frequency drive that increases
energy efficiency and reduces electrical energy consumption. The cold water coming out from the evaporator of vapour absorption machine is stored in the
0 2000 4000 6000 8000 10000
Jan
u
ar
y
Fe
b
ru
ar
y
Ma
rch
Ap
ril
Ma
y
Ju
n
e
Ju
ly
Au
gu
st
Se
p
te
m
b
e
r
Octo
b
e
r
N
o
ve
mb
e
r
De
ce
m
b
er
Co
ol
in
g
De
m
an
d
kW
h
Month
Volume: 04 Issue: 06 | June -2017 www.irjet.net p-ISSN: 2395-0072
[image:3.612.30.297.354.455.2]cold storage tank. An electrically operated compression cooling machine is used as a backup in order to cover complete cooling demand of the building. This compression cooling machine is operated when there is need for cooling and the temperature of the cold storage tank is below than the specified set point temperature.
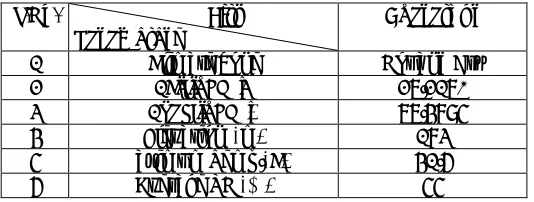
Table 2: Parameters considered for simulation of
solar thermal cooling system
Fig.3: Schematic of solar thermal cooling system
[TRANSOL]
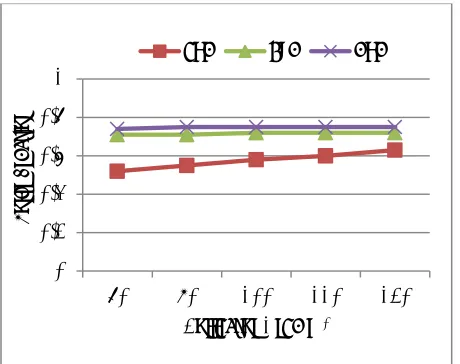
5 Solar Fraction
It is the ratio of the annual cooling effect produced by the solar to the total annual cooling demand of the building.
Fig 4 shows the variation of solar fraction for various collector area of FPC, ETC and CPC. It is clear from the fig 4 that in FPC, as the collector area increases the solar fraction also increases because more heat is collected by the collector and supplied to the solar thermal cooling system that produce the more amount of solar cooling. At small collector area of 80 m2 the annual heat production is
low for Bharatpur city and solar thermal cooling system produce the low amount of cooling If the collector area is increased from 80 m2 to 120 m2 the solar fraction
increases from 52 % to 63 %..In the solar thermal cooling system when ETC type collector is used than as the area of collector is increased then the solar fraction is also increase but after an optimum collector area it starts constant because the elevated temperature heat losses are also higher. If we utilize a high collector area then we have to increase either the capacity of storage tank or the cooling demand of the building otherwise there will be no effect of collector area after an optimum value. The solar fraction has been observed as 0.71, 0.71, 0.72, 0.72, and
Component Parameter Value Source
Solar Collector Surface Area m2
80-120 m2
Henning 2007 Solar Heat
Exchanger Thermal transfer coefficient
11 kW/K Eicker et al. 2014
Solar Storage Type Vertical
Volume 5000 ltr
Thermal
Chiller Type Absorption Mateous et.al 2009
Nominal
Cooling power 35 kW
Nominal COP 0.7
Pump power 210 W
Cold Storage
Tank Type Volume Vertical 1000 ltr Eicker et al. 2014 Compression
Chiller Nominal cooling power 10.5 kW (Back up )
Nominal COP 3.5
Cooling Tower Nominal Power 75 kW Advances
Cooling Tower Pvt Ltd. Mumbai.
Volume: 04 Issue: 06 | June -2017 www.irjet.net p-ISSN: 2395-0072
[image:4.612.29.299.230.559.2]0.72 for the area of 80m2, 90 m2, 100 m2, 110 m2 and
120m2 for the Bharatpur city. The solar fraction has been
observed for CPC as 0.74, 0.75, 0.75, 0.75, and 0.75 for the area of 80m2, 90 m2, 100 m2, 110 m2 and 120m2 for the
Bharatpur city.
Fig 4 Solar fraction for different areas
6. Primary Energy Savings
[image:5.612.323.576.109.288.2]Primary energy consumption is calculated from energy consumption of the cooling systems by dividing it to the conversion factor 0.36 [Eicker et al.]. In the solar thermal cooling system the electrical energy is consumed by pumps, controls and electrical chiller used as a backup. In the solar photovoltaic cooling system the electrical consumption is done by the compressor, condenser fan and blower. The primary energy savings is the difference between the primary energy consumption by the solar thermal cooling system and the primary energy consumption by the compression based cooling system operated by grid power.
Fig. 5 Relative primary energy savings for different
areas
Fig.5 shows the relative primary energy savings for the different areas. It has been observed that increased the collector area, relative primary energy savings is increased .In this study we found that for flat plate collector growth in primary energy savings due to increased area of collector. The relative primary energy savings reaches up to 42% for the collector area ranging 80- 120 m2. It has
been observed that increased the collector area, relative primary energy savings is increased .But an optimum collector area the relative primary energy saving is decrease. At high collector area the collected heat is increased in all the type of collector but in the case of ETC and CPC the heat losses also increase, so with the increase in the collector area the increment in the primary energy savings are higher for the FPC and lower for the ETC and CPC. In the ETC and CPC after an optimum collector area the primary energy savings gets decreased. For the same cooling machine type, capacity and building cooling load increase in collector area does not produce much effect in case of primary energy savings. The highest primary energy savings is 51.13% for CPC, 48.1% for ETC, 42.34% for FPC.
0 0.2 0.4 0.6 0.8 1
80 90 100 110 120
So
lar
Fr
ac
tion
Collector Area m2
FPC ETC CPC
0 10 20 30 40 50 60
80 90 100 110 120
Pr
im
ar
y E
n
e
rg
y
Sav
in
gs
%
Collector Area m2
FPC ETC CPC
Volume: 04 Issue: 06 | June -2017 www.irjet.net p-ISSN: 2395-0072
[image:5.612.37.267.182.364.2]7. Conclusions
Technical feasibility of solar thermal cooling system is evaluated based on the basis of solar fraction and primary energy savings.
7.1 Solar Fraction
The solar fraction is highest for the CPC type collector and lowest for the FPC.
It has been observed that for flat plate collectors the highest solar fraction occurs at 120 m2 collector area,
in the case of ETC highest solar fraction is at collector area of 100 m2, In the case of CPC highest solar
fraction occurs at 100m2 .
In the solar thermal cooling system as the collector area increases the solar fraction also gets increased but after an optimum collector area it starts decreasing because at elevated temperature heat losses are also higher. If we use a high collector area then we have to increase either the capacity of storage tank or the cooling demand of the building otherwise there will be no effect of collector area after an optimum value. The highest solar fraction has been observed as 0.63, 0.72, 0.73 for FPC/ETC/CPC for the collector area range in 80-120 m2.
7.2 Primary Energy Savings
In the solar thermal cooling system the highest primary energy saving is highest for CPC 49-52 % and lowest for the FPC 34-42%. It is between 45-48 % for ETC. The primary energy savings are highest for CPC and the primary energy savings are lowest for the FPC
Among the three types of collectors CPC has the higher primary energy savings.
At high collector area the collected heat is increased in all the type of collector but in the case of ETC and CPC the heat losses also increase, so with the increase in the collector area the increment in the primary energy savings are higher for the FPC and lower for the ETC and CPC. In the ETC and CPC after an optimum collector area the primary energy savings gets decreased. For the same cooling machine type, capacity and building cooling load increase in collector area does not produce much effect in case of
primary energy savings. The highest primary energy savings is 51.13% for CPC, 48.1% for ETC, 42.34% for FPC.
8. References
1. Advances Cooling Tower Pvt Ltd. Mumbai 2014 “Quotation for supplying the cooling tower” t Government Engineering College Bharatpur (Raj.) India.
2. Assilzadeh F., Kalogirou S. A., Alia Y.,, Sopiana K., 2005 “Simul tion nd optimiz tion of LiBr solar absorption cooling system with ev cu ted tube collectors” Renew ble Energy Vol.30., pp. 1143–1159.
3. Balghouthi M., Chahbani M. H., Guizani A., 2005 “Sol r powered air conditioning as a solution to reduce environmental pollution in Tunisi ” Des lin tion Vol. 185, pp.105-110. 4. Bongs C. 2009 “Benchm rks for comp rison of
system simulation tools – Absorption chiller simul tion comp rison” A technic l report of subtask C, Task 38 Solar Air-Conditioning and Refrigeration.
5. Eicker U., Colmenar-Santos A., Teran L., Cotr do M. 2014 “Economic ev lu tion of solar thermal and photovoltaic cooling systems through simulation in different climatic conditions: An analysis in three different cities in Europe” Energy nd Buildings, Vol. 70, pp. 207-223.
6. Eicker U., Pietruschk D. 2009 “Design nd performance of solar powered absorption cooling systems in office buildings” Energy and Building, Vol. 41, pp. 81-91.
7. Energy Conservation Building Code (ECBC) User Guide, Bureau of Energy Efficiency (2007).
8. Enibe S.O. 1997 “Sol r refriger tion for rur l pplic tions” J Renew Energy, Vol. 12, pp. 157-67.
9. F n Y., Luo L., Souyri B. 2007 “Review of sol r sorption refrigeration technologies: Development nd pplic tions” Renew ble &
Volume: 04 Issue: 06 | June -2017 www.irjet.net p-ISSN: 2395-0072
Sustainable Energy Reviews, Vol. 11, issue 8, pp. 1758-1775.
10. H mm d M.A., Audi M.S.1992 “Perform nce of a Solar LiBr-Water absorption refrigeration system” Renew ble Energy, Vol. 2, No. 3, pp. 275 -282.
11. Hang Y., Qu M., Zh o Fu. 2011 “Economic l and environmental assessment of an optimized solar cooling system for a medium-sized benchmark office building in Los Angeles, C liforni ” Renew ble Energy, Vol. 36, pp. 648-658.
12. Hartmann N., Glueck C. Schmidt F.P 2011 “Sol r cooling for small office buildings: Comparison of solar thermal and photovoltaic option for two different Europe n Clim tes.” Renewable Energy, Vol. 36, pp. 1329-1338. 13. Henning H.M. 2007 “Solar assisted air
conditioning of buildings – an overview” Applied Thermal Engineering, vol. 27 pp. 1734–1749.
14. Kim D.S., Inf nte Ferreir C.A. 2008 “Sol r refrigeration options – a state-of-the-art review” Int. Journ l of Refriger tion, Vol. 31, pp. 3–15.
15. L zz rin R.M. 2014 “Sol r cooling: PV or thermal? A thermodynamic and economical n lysis” Int.Journ l of Refriger tion, Vol.39, pp. 38-47.
16. M teus T., Oliveir A.C. 2009 “Energy nd economic analysis of an integrated solar absorption cooling and heating system in different building types nd clim tes” Applied energy, Vol. 86, pp. 949-957.
17. Mazloumi M., Naghashzadegan M., Javaherdeh K. 2008 “Simul tion of sol r lithium bromide –water absorption cooling system with p r bolic trough collector” Energy Conversion and Management, Vol. 49, pp. 2820-2832.
18. Pongtornkulpanich A., Thepa S.,
Amornkitbamrung M., Butcher C., 2008 “Experience with fully oper tion l sol r driven 10-ton LiBr/H2O single effect bsorption cooling system in Th il nd” Renewable energy Vol. 33, pp. 943-949.
19. TRANSOL, http://aiguasol.coop/en/transol-solar thermal -energy-software/ (accessed June 2017).
20. Tsoutsos T., Aloumpi E., Gkouskos Z., K r giorg s M. 2010 “Design of sol r absorption cooling system in Greek hospit l” Energy and Building, Vol. 42, pp. 265-272.
Volume: 04 Issue: 06 | June -2017 www.irjet.net p-ISSN: 2395-0072