R E S E A R C H
Open Access
Cross-cultural adaptation, reliability, and
validity of the Vertigo symptom scale
–
short
form in the central Kurdish dialect
Sherko Saeed F. Zmnako
*and Yousif Ibrahim Chalabi
Abstract
Background:Core vestibular symptoms are vague, hard for patients to describe, and difficult for examiners to
quantify. Reliable and validated patient-reported outcome measures (PROMs) have obtained acceptance and popularity in the specialty of vestibular disorders. In Kurdish, there is a critical shortage of such measures. The aim of this survey was to assess the psychometric properties of a central Kurdish version (VSS−SF−CK) of the Vertigo Symptom Scale −Short Form (VSS−SF).
Methods:The study utilized a regulated process of cross-cultural adaptation to produce the VSS−SF−CK. We examined its psychometric properties by using a cross-sectional survey. Owing to a non-normal distribution, both principal axis factoring and polychoric correlation were used to examine the structure. The internal consistency of the scales was evaluated using Cronbach’s alpha coefficient (α) and composite reliability. The discriminant validity was evaluated using the heterotrait–monotrait ratio of correlations (HTMT.85) and the Fornell-Larcker criterion. To assess convergent validity, the instrument was correlated with two comparators.
Results:The participants (n= 195) were composed of 165 patients with vestibular symptoms (mean−age 45 ± 15.8, range 61 years; 56.4% women) and 30 healthy participants (mean−age 35 ± 18.6; range 52 years; 60% women). Based on the scree plot, along with other criteria such as Horn’s parallel analysis and minimum average partial, two factors were extracted: vestibular (VSS−V) and autonomic-anxiety (VSS−AA). Both constructs showed a robust structure in terms of adequate loadings and weak cross-loadings. The scales’αs were 0.81, 0.81, and 0.87 for VSS-V, VSS-AA, and the total scale (VSS−T), respectively. Discriminant validity was established with a value of 0.71 for HTMT (< 0.85).
Spearman’s correlation supported the study’s hypotheses and confirmed the convergent validity. Intraclass correlation coefficients revealed high external reliability: test-retest results were 0.93, 0.94, and 0.97 for VSS-V, VSS−AA, and VSS−T, respectively.
Conclusion:Given a critical shortage in PROMs for the vestibular field, the psychometric properties of VSS−SF−CK were evaluated. The results were promising, as they revealed external consistency and construct validity. The goodness of fit indices showed that the VSS−SF−CK is a reliable and validated PROM that can be used by clinicians and researchers in the Kurdish-speaking population.
Keywords:Vestibular disorders, Psychometric properties, Non-normal distribution, Factor analysis, Polychoric correlation, Partial least squares, Vertigo and dizziness, Patient−reported outcome measures
© The Author(s). 2019, corrected publication August 2019.Open AccessThis article is distributed under the terms of the Creative Commons Attribution 4.0 International License (http://creativecommons.org/licenses/by/4.0/), which permits unrestricted use, distribution, and reproduction in any medium, provided you give appropriate credit to the original author(s) and the source, provide a link to the Creative Commons license, and indicate if changes were made. The Creative Commons Public Domain Dedication waiver (http://creativecommons.org/publicdomain/zero/1.0/) applies to the data made available in this article, unless otherwise stated.
* Correspondence:[email protected];
Background
Vestibular disorders (VD) produce a group of vestibular symptoms (VS) as well as a range of concomitant autonomic-anxiety symptoms [1]. Epidemiological data on VD in the general population are scarce. Studies have reported a discrepant range (6.1 to 27%) for one-year prevalence of VS [2]. However, they are prevalent among individuals visiting outpatient care centers [3]. VS are vague and present themselves in different patterns (acute, episodic, and chronic) [4]. That is, they are diffi-cult for patients to describe, and hard for healthcare pro-fessionals to evaluate [5]; hence, they place a burden on both patients and community [6].
One potential way to overcome the difficulty of evalu-ating demanding symptoms is the utilization of patient-reported outcome measures (PROMs) through reliable and validated questionnaires, which has gained accept-ance and popularity in different fields of medicine [7]. Based on the Consensus-based Standards for the Selec-tion of Health Status Measurement Instruments (COS-MIN) checklist of property measurements [8], the clinical utility of a group of PROMs related to VD was appraised through a systematic review; among them, the long form of the Vertigo-Symptom Scale earned the sec-ond highest score [9]. It was developed by Yardley et al. [10] and contains 34 items. However, Mendel et al. [11] found that utilizing the long form as a single aggregated scale may result in methodological bias; to overcome this hazard he suggested studying these items separately by using the short form (VSS−SF).
The VSS−SF is composed of 15 items [12], extracted from the long form. This self-rated questionnaire uses five-point scales ranging from 0 to 4, with response op-tions of never, a few times, several times, quite often, and very often. The score indicates the frequency of the 15 symptoms, which range from 0, suggesting no symp-toms, to 60, representing persistent symptoms. Accord-ing to the types of symptoms, the 15 items are divided into two subscales: vestibular (balance) (VSS − V), and autonomic-anxiety (VSS−AA) [13].
However, to use a PROM in a population with a lan-guage different from the source, it must undergo a process of cross−cultural adaptation, which includes both translation and cultural adaptation. However, trans-lation of any validated PROM can debilitate its psycho-metric properties; therefore, consistency and validity should also be confirmed and reported in accordance with international guidelines for measuring patient-reported health outcomes [14]. The psychometric prop-erties of the VSS−SF were assessed when Norwegian and Japanese versions were cross-culturally validated; both translated versions had acceptable internal consistency, external reliability, convergent validity, and discriminating validity. Two factors were explored in the
Norwegian version: VSS-V and VSS-AA [15]; however, a third factor related to duration of symptoms was also ex-tracted from the Japanese version [16].
Unfortunately, there is a critical shortage of validated tools in Kurdish that can quantify vestibular disorders. The VSS-SF is efficient, simple, short, and has not been adapted to Kurdish. Accordingly, in this study we applied an adjusted translation and cultural adaptation of the VSS−SF to the central Kurdish dialect (VSS −SF−CK). Utilizing a cross-sectional survey, and in accordance with the COSMIN checklist [8], we assessed the psychometric properties of the VSS−SF−CK.
Methods
Cross-cultural adaptation (CCA)
The focus group (FG)
In accordance with international regulations for qualified PROMs [8], the College of Medicine – University of Sulaimani (hereafter, “the institute”) assembled a FG, consisting of seven otolaryngologists (including one of the authors) who were all native speakers of the target language with 15 to 25 years of experience in the field of VD. The moderator of the group was aware of how to run the discussion sessions according to the correspond-ing guidelines [17].
Preparation:
Preparation consisted of three steps.
(1) The corresponding author contacted and confirmed the permission of Professor Lucy Yardley as one of the original developers.
(2) A junior otolaryngologist (who could easily contact the members of the FG and the translators) was recruited to follow the translation process.
(3) The concepts of clarity, fluency, and unambiguity in the forwarded translations were agreed upon and followed during CCA.
CCA:
in the pilot test were asked to give feedback on under-standability and to rate the contents of each translated item. The CCA process and results of the ratings were reviewed; consequently, the face and content validity were considered excellent. Ultimately, after proofreading and cognitive debriefing, the final version was estab-lished (Additional file 3) and the details of the process were reported to the institute.
Sample size and participants
Based on a subject-to-variable ratio of a minimum of 10 participants for each item [20] and factors extracted in previous research on the same instrument [16], we esti-mated that 165 participants would be sufficient to ob-serve the covariation among our 15 surface attributes; along with 30 healthy control participants for compari-son. Two well-equipped audio-vestibular tertiary clinics that cover a major proportion of the center and districts of Sulaimani-Governorate, Iraq enrolled participants from March 2017 to July 2018. Participants were pa-tients with chief complaints of VS who had been object-ively diagnosed as having VD.
Inclusion criteria allowed native speakers with sufficient communication and performance abilities. The exclusion criteria were: age below 17 or above 79, symptoms of less than 1 day duration (Patients needed to have experienced symptoms [a feeling of being dizzy, disoriented, or swimmy lasting all day] for at least 1 day in order to an-swer item-6), musculo-skeletal diseases and symptoms primarily due to other systems disorders such as neuro-logical, cardiopulmonary, and cognitive disorders.
Subgroups:
The heterogeneity of symptoms in the instrument re-quired patients with different presentations and from different settings [10]; consequently, the inclusion and exclusion criteria were adjusted to ensure that the sam-ple was a good representation of the target population (patients with VS of vestibular origin with no associated illnesses that may produce VS). The sample contained all types of patients that may be encountered in primary, secondary, and tertiary clinics. Furthermore, based on the patterns of presentation, and to evaluate the discrim-inating validity, the sample was classified into three subgroups: (1) Acute presentation (acute episode of symptoms at the time of rating), (2) Chronic presenta-tion (long-term sensapresenta-tions of symptoms), and (3) Episodic presentation (recurrent symptoms with symptom-free intervals) [21]. For the 76 participants who were randomly selected from the patients included in the reliability subgroup, the design was converted to a short-term longitudinal study to assess external reliability.
Educational level and raters
The VSS−SF−CK is a self-rated survey tool, that is, the role of the rater (interviewer) is trivial [22], but not everyone in the target population is literate, so partici-pants’ educational levels were documented. Methodolo-gists also recommend the involvement of a female interviewer to simplify the process, considering partici-pants’ psychological and/or societal obstacles [23]; that is, female interviewers can interview both genders, par-ticularly women in conservative or religious families. Hence, two female raters with similar qualifications and sufficient training were recruited.
Recruitment and randomization
While patients were waiting for the results of their in-vestigations or rehabilitation protocols, a systematic numbered sample was used on a daily basis to select pa-tient participants who fulfilled the inclusion criteria and accepted the invitation. The first participant was selected randomly followed by fixed-interval selection.
Comparators
To the best of our knowledge, there are no validated PROMs in Kurdish that measure the construct under in-vestigation. Consequently we employed two comparators that could measure a similar construct but using two dif-ferent approaches, that is, subjective and objective. First, in the subjective approach, a visual analogue scale (VAS) was applied so patients could rate their total self-perceived vestibular symptoms (VAS−T). The scale started with zero to represent no symptoms and ended with 100 to represent subjectively rated worst-possible symptoms. Second, in the objective approach, the Tandem Romberg (TR) was utilized, participants were requested to maintain balance for 60 s under the following four condi-tions: 1- right foot behind the left, eyes open; 2- same as the first, eyes closed; 3- left foot behind the right, eyes open; 4- same as the third, eyes closed. Only one of three trials was administered for each condition if the patient could complete 60 s successfully. The scores from all four conditions (TR−T) were summed out of 240 s [24].
External reliability
Steps recommended by Kottner and his colleagues were followed during reliability assessments and reporting [25]. Patients in the reliability subgroup (n= 76) were rated on two separate occasions. The timing of the second rating was arranged according to the patients’availability.
The following strategies were used to minimize meas-urement errors:
(2) The time interval between ratings was one to 5 days; furthermore, to avoid recall bias, the sequence of items for the second rating was different. However, the interval for Tandem Romberg was one to 2 hours to remove the effect of in-between rehabilitation.
(3) Similar settings were applied to all patients; ratings were performed in a quiet room to eliminate distractions and minimize auditory stimuli, so patients could not maintain their balance using these stimuli, especially in eye closed conditions (to test vestibular system alone, the role of other systems, that could help in maintaining balance, should be excluded).
(4) Raters were instructed not to prompt patients for specific answers.
Statistics
Data screening
Ceiling and floor effects were absent, while the percent-ages of patients with the highest and lowest scores in the three outcome measures were below 15% [26]; pair-wise exclusion was used with missing values. In our sample size (50 <N< 300), absolute Z-scores above 3.29 were considered to reflect a non-normal distribution [27]. Univariate and multivariate (Mardia test) statistics revealed an asymmetric distribution. Ordinal variables such as Likert-type items fail to assume normality [16,
28] and therefore require either log-transformation or distribution-free (e.g., nonparametric) tests; we chose the latter [29].
Structural validity
Exploratory factor analysis (EFA)To identify the latent constructs, considering a sample size of (≤300) and non-normality [20, 28], the authors conducted EFA. Some methodologists recommend use of parametric tests even if the distribution is non-normal [30]. However, for or-dinal data and non-normality, others advocate more ro-bust tests, such as polychoric correlations (PC) [31], specifically, Robust Diagonally Weighted Least Squares (DWLS) [32]. In view of the study context, principal axis factoring (PAF) was considered to outweigh maximum likelihood [28]. To certify that the same outcomes would be reproduced, and in light of the above circumstances, we utilized both PAF and DWLS in EFA. Assuming moderate inter-factor correlation (IFC), promax oblique rotation (Kappa = 4) was employed.
Number of factors to retain To avert bias, guidelines emphasize using diverse strategies for finding the ultim-ate number of internal attributes [28, 33]. This was re-solved based on five parameters:
(1) Kaiser Criterion (eigenvalue > 1). (2) Scree plot.
(3) Horn’s parallel analysis (HPA) [34]. (4) Minimum average partial (MAP).
(5) The a priori hypotheses that the instrument consists of two subscales: VSS−V and VSS−AA [15,16].
Discriminant validity (internal discrimination)To es-tablish this feature, four criteria were utilized:
(1) Cross-Loadings Inspection: Item−loading on its construct should be higher than its cross-loadings. (2) Fornell-Larcker: The average variance extracted
(AVE) by each factor should be higher than the square of IFC (IFC2).
(3) The heterotrait-monotrait ratio of correlations (HTMT) Value < 0.85 is favorable.
(4) HTMT−Inference: value < 1 is assuring [35]. The last two variables were estimated by the partial least squares (PLS) [36].
Model fitThis was appraised by a comparative fit index (CFI) value of ≥0.95 and the root mean square error of approximation (RMSEA) value of≤0.06 [37].
External reliability
Intraclass correlation coefficient (ICC) was utilized. Cut-off values for strength of reliability were: < 0.5─poor, from ≥0.5 to ≤0.75─moderate, from ≥0.75 to ≤0.9─good, and > 0.9─excellent [22].
Internal consistency reliability
The following seven variables were estimated and com-pared with the corresponding cut-off points:
(1) Cronbach’s alpha (α): > 0.7 [38,39].
(2) Average Inter-item correlation (AIC):≥0.2≤0.5 [26]. (3) Corrected Item-total correlation (CI−TC):≥0.4 (4) Alpha if item deleted (AIID): the resultant α of
the selected scale should not rise if any item is deleted [38].
Methodologists consider α to be a controversial esti-mate; accordingly, the following was also reported:
(5) The consistent reliability measure of the partial least squares (rhoA): > 0.7.
(6) Composite reliability (rhoC): > 0.7. (7) AVE by each factor: > 0.5 [40].
Hypotheses
subjective scores if they measure the same construct; however, the concept is not the same when subjective and objective scores are correlated even if they are measuring similar constructs [15, 41, 42]; accordingly, the following hypotheses were formed:
The positive correlation between the total score of VSS−SF− CK (VSS−T) and the VAS−T would be adequate, because they measure similar constructs with similar approaches.
The correlation between TR-T and VSS-V scores would be moderate because they measure similar
constructs with different approaches; furthermore, the value would be negative (moderately negative) because low scores on TR-T are associated with high scores on VSS-V.
The negative correlation between TR−T and the VSS−AA would be weak because they measure different constructs with different approaches. Rank coefficient (Spearman) was used to estimate the correlations. The study classified values from assorted regulations as follows: < 0.3─weak,≥0.3 < 0.5─moderate,≥0.5 < 0.7─adequate, and≥ 0.7─high correlations [16,43].
Discriminating validity (external discrimination)
It is assumed that the instrument has the ability to discrim-inate between subgroups as well as between the patient and healthy groups. The Mann-Whitney U test was used to test this assumption with a significance level of 5%.
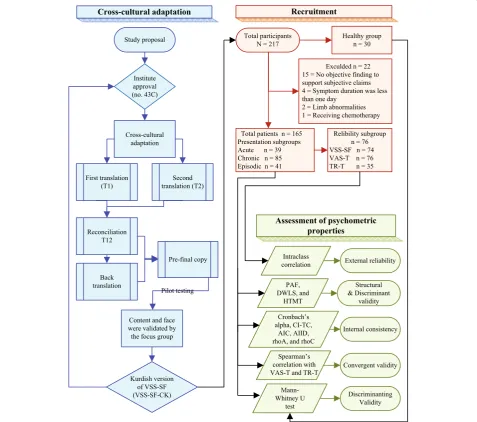
The flowchart (Fig. 1) illustrates the sequential order of the works implemented in the study.
More details on methodology are available in Additional file1.
Software
Three programs were utilized: 1- FACTOR V10.8.04 (Rovira i Virgili University, Tarragona, SPAIN) for PC, HPA, and goodness of fit [44]; 2- SmartPLS 3. (Boen-ningstedt: SmartPLS GmbH) [36] for rhoA and dis-criminant validity; and 3- IBM SPSS Statistics V21 (IBM, Armonk, NY, USA) for the rest of the analysis such as, PAF, α and syntaxes for HPA and MAP [45].
Results
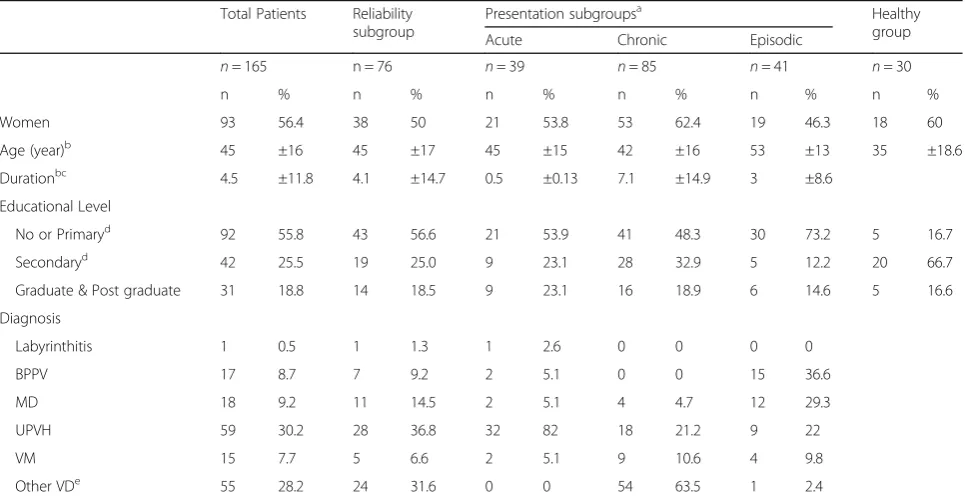
Data related to participants and exclusions are presented in Fig. 1; no valid differences in the results were exhib-ited based on exclusions. Furthermore, more details of participants’attributes are shown in Table1.
Factorability was achieved, the determinant was not equal to zero (0.007), the Kaiser-Meyer─Olkin test was meritorious (0.873), and Bartlett’s test of spher-icity was significant (p < 0.001). Based on eigenvalues
> 1, PAF revealed three factors. On this basis, a 3-factor solution was applied using DWLS. The cumula-tive proportions of variance (CPV) in the three
fac-tors were 53 and 59% in PAF and DWLS,
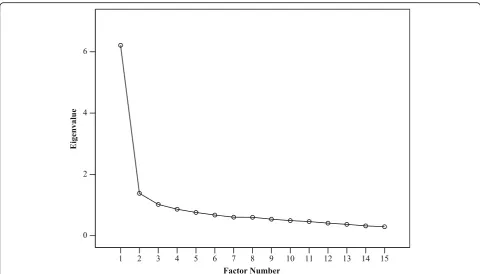
respectively. In the case of DWLS, the three consecu-tive eigenvalues and the CPV were 6.2 (41%), 1.6 (52%), and 1.1 (59%). Nonetheless, the elbow of the scree plot was distinctly flexed at the point where the second factor was located (Fig. 2). Furthermore, HPA, MAP “See Additional file 4: Table S1 and Table S2”, and the a priori hypothesis also supported the scree plot display; that is, a 2–factor solution.
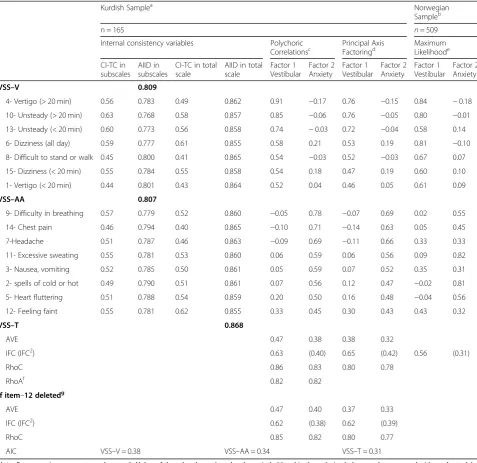
Consequently, a 2–factor solution was conducted with both PAF and DWLS. Two factors were extracted: vestibular (VSS−V) and autonomic-anxiety (VSS−AA), In the case of DWLS, the two consecutive eigenvalues and the CPV were 6.1(41%), 1.6 (52%). Each factor ad-equately loaded seven items with weak cross-loadings. The remaining Item–12 (feeling faint, about to black out), was loaded adequately by the VSS−AA; however, it was associated with noticeable cross loadings by VSS−V.
The AVE by neither method reached the acceptable level, as it was < 0.5 for both factors. Additional file 5
shows how to estimate AVE and rhoC. To assess the negative effects of low AVE on discriminant validity, AVE and IFC2 were compared (Fornell-Larcker criter-ion). In PAF, the AVE by both factors were lower
Table 1Demographic attributes of the groups and subgroups
Total Patients Reliability subgroup
Presentation subgroupsa Healthy group Acute Chronic Episodic
n= 165 n = 76 n= 39 n= 85 n= 41 n= 30
n % n % n % n % n % n %
Women 93 56.4 38 50 21 53.8 53 62.4 19 46.3 18 60
Age (year)b 45 ±16 45 ±17 45 ±15 42 ±16 53 ±13 35 ±18.6
Durationbc 4.5 ±11.8 4.1 ±14.7 0.5 ±0.13 7.1 ±14.9 3 ±8.6
Educational Level
No or Primaryd 92 55.8 43 56.6 21 53.9 41 48.3 30 73.2 5 16.7
Secondaryd 42 25.5 19 25.0 9 23.1 28 32.9 5 12.2 20 66.7
Graduate & Post graduate 31 18.8 14 18.5 9 23.1 16 18.9 6 14.6 5 16.6
Diagnosis
Labyrinthitis 1 0.5 1 1.3 1 2.6 0 0 0 0
BPPV 17 8.7 7 9.2 2 5.1 0 0 15 36.6
MD 18 9.2 11 14.5 2 5.1 4 4.7 12 29.3
UPVH 59 30.2 28 36.8 32 82 18 21.2 9 22
VM 15 7.7 5 6.6 2 5.1 9 10.6 4 9.8
Other VDe 55 28.2 24 31.6 0 0 54 63.5 1 2.4
Note:a
Nature of the symptoms at the time of rating not related to disorders or syndromes;b
Mean and ± Standard Deviation;c
Duration in month;d Schools;e
No specific diagnosis could be identified
than IFC2 (validity not established); while for DWLS, AVE was higher than IFC2 only in VSS − V (validity of one factor established). However, the validity was confirmed by HTMT value = 0.71 (< 0.85) and HTMT-inference value = 0.81 (< 1). To examine the situation, we deleted item−12 (the cross-loading item); conse-quently, in DWLS, the AVE by VSS–AA was slightly inflated and became more than a slightly deflated IFC2; hence, the Fornell-Larcker criterion was also achieved for the VSS − AA (Table 2). Additional file6
shows the details of 2-factor extraction by DWLS and the results of model fit, CFI = 0.985 (≥0.95) and RMSEA = 0.049 (≤0.06).
Moreover, Table 2 presents the outcomes for the in-ternal consistency variables, they were satisfactory for all methods and scales; regarding AIID, resultant α did not increase when any item was deleted. In both methods, values of rhoA and rhoC gained the accept-able limits.
The instrument and the comparators exhibited good to excellent reliabilities in all types (Table3).
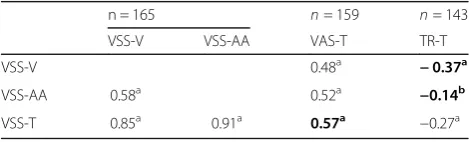
Table 4 shows the Spearman’s correlations between VSS−SF− CK and its subscales, VAS−T, and TR−T (Pearson’s correlations revealed similar results). The Mann-Whitney U test compared the medians of the scores and revealed that the distributions were similar in all scales across subgroups (ps> .05). However, they were
not similar when the mean ranks of the control group were compared to that of the subgroups and total pa-tients (ps< .05). For Pearson’s correlations and the me-dians/interquartile ranges, see Additional file 4: Tables S3 and Table S4. Further, the shapes of the scores are shown in Fig.3.
Discussion
The study utilized a regulated process of cross-cultural adaptation and produced a VSS−SF−CK. The steps as described in the methodology were mostly applied in ac-cordance with the related guidelines.
The nature of both the population and sample obliged the authors to involve raters (interviewers) and transform the instrument, as necessary, from self-administered to interviewer-self-administered (e.g., in cases of non-motivated and illiterate participants). The reli-abilities of the VSS − SF−CK and the comparators were enhanced by these measures which was consistent with the test-retest results of the Norwegian and Japa-nese versions.
The results of both DWLS and PAF were nearly similar during EFA: seven items (1, 4, 6, 8, 10, 13, and 15), which are directly related to VD, firmly loaded onto vestibular factor with weak cross-loadings to the autonomic-anxiety factor; this was a preliminary sign of the discriminant abil-ity of the VSS−V.
Previous studies as well as the present survey have used various types of analyses and samples; however, across these samples, two items (items-3 and 12) were associated with loading issues.
In five previous samples (Mexican, U.K. hospital, U.K. primary care, Norwegian [Table 3], and Japa-nese), item−3 (nausea, vomiting) loaded interchange-ably on both factors with noticeable cross-loadings on every occasion [15, 16, 46]. The mean loading
(calculated by the authors) in these samples showed that the reflective–effect of anxiety factor on item–3 (loading 0.41) was higher than that of vestibular (loading 0.35).
The story of item–3 began when the original devel-oper, for several reasons, intentionally decided to re-tain the item along with other items in the VSS − V [46], knowing that this item originally belonged to the VSS − AA from a physiological viewpoint [47].
Table 2Item loadings in exploratory factor analysis with 2–factor solution and the internal consistency variables
Kurdish Samplea Norwegian
Sampleb
n = 165 n= 509
Internal consistency variables Polychoric
Correlationsc Principal AxisFactoringd MaximumLikelihoode
CI-TC in subscales
AIID in subscales
CI-TC in total scale
AIID in total scale
Factor 1 Vestibular
Factor 2 Anxiety
Factor 1 Vestibular
Factor 2 Anxiety
Factor 1 Vestibular
Factor 2 Anxiety
VSS–V 0.809
4- Vertigo (> 20 min) 0.56 0.783 0.49 0.862 0.91 −0.17 0.76 −0.15 0.84 −0.18
10- Unsteady (> 20 min) 0.63 0.768 0.58 0.857 0.85 −0.06 0.76 −0.05 0.80 −0.01
13- Unsteady (< 20 min) 0.60 0.773 0.56 0.858 0.74 −0.03 0.72 −0.04 0.58 0.14
6- Dizziness (all day) 0.59 0.777 0.61 0.855 0.58 0.21 0.53 0.19 0.81 −0.10
8- Difficult to stand or walk 0.45 0.800 0.41 0.865 0.54 −0.03 0.52 −0.03 0.67 0.07
15- Dizziness (< 20 min) 0.55 0.784 0.55 0.858 0.54 0.18 0.47 0.19 0.60 0.10
1- Vertigo (< 20 min) 0.44 0.801 0.43 0.864 0.52 0.04 0.46 0.05 0.61 0.09
VSS–AA 0.807
9- Difficulty in breathing 0.57 0.779 0.52 0.860 −0.05 0.78 −0.07 0.69 0.02 0.55
14- Chest pain 0.46 0.794 0.40 0.865 −0.10 0.71 −0.14 0.63 0.05 0.45
7-Headache 0.51 0.787 0.46 0.863 −0.09 0.69 −0.11 0.66 0.33 0.33
11- Excessive sweating 0.55 0.781 0.53 0.860 0.06 0.59 0.06 0.56 0.09 0.82
3- Nausea, vomiting 0.52 0.785 0.50 0.861 0.05 0.59 0.07 0.52 0.35 0.31
2- spells of cold or hot 0.49 0.790 0.51 0.861 0.07 0.56 0.12 0.47 −0.02 0.81
5- Heart fluttering 0.51 0.788 0.54 0.859 0.20 0.50 0.16 0.48 −0.04 0.56
12- Feeling faint 0.55 0.781 0.62 0.855 0.33 0.45 0.30 0.43 0.43 0.32
VSS–T 0.868
AVE 0.47 0.38 0.38 0.32
IFC (IFC2) 0.63 (0.40) 0.65 (0.42) 0.56 (0.31)
RhoC 0.86 0.83 0.80 0.78
RhoAf 0.82 0.82
If item–12 deletedg
AVE 0.47 0.40 0.37 0.33
IFC (IFC2) 0.62 (0.38) 0.62 (0.39)
RhoC 0.85 0.82 0.80 0.77
AIC VSS–V = 0.38 VSS–AA = 0.34 VSS–T = 0.31
Note:For convenience, symptoms shortened; Alphas of the subscales and total scale are in bold and in three decimal places, to be compared with resultant alpha when any item deleted;a
Promax, Kappa = 4;b
Wilhelmsen K, Strand LI, Nordahl SHG, Eide GE, Ljunggren AE. Psychometric properties of the Vertigo symptom scale - Short form. BMC Ear Nose Throat Disord. 2008;8(1):2;cPolychoric algorithm by Diagonally Weighted Least Squares (DWLS);dPromax with Kaiser normalization in 3 iterations;e
Oblimin, Delta = 0;f
Values provided by SmartPLS 3;g
Inflation of AVE and deflation of IFC2
However, the present sample has strongly placed the item into the VSS − AA (Table 3), which can be at-tributed to the heterogeneous nature of the symptoms in this sample; that is, various presentations and durations.
The item−12 cross-loading issue (feeling faint, about to black out) is perhaps a structural matter. Out of six samples including the present survey, four of them in-cluded item−12 correctly with VSS −AA [15, 16, 46]; the order, starting from weaker cross-loadings, was U.K. primary care, Japanese, U.K. hospital, and then the present sample. In the remaining two samples, the item unexpectedly settled on VSS − V; the order, starting from stronger loadings, was Norwegian then Mexican. It is unexpected for an item to oscillate or cross-load between constructs unless it is flawed. Accordingly, we believe this item represents two different types of symptoms. The words are clear and assumed to belong to the autonomic-anxiety symptoms; however, we no-ticed that some patients tried using many words or clauses to describe strange feelings of dizziness (spatial disorientation), words that were similar to those used to describe fainting and/or being about to black out. In spite of this, in the present study, item −12 loaded adequately on VSS − AA (0.45); however, it was the only item characterized by the lowest
loading and the highest cross-loading. The situation was investigated by deleting item−12, which resulted (in both methods) in deflation of IFC and slight infla-tion of AVE by VSS − AA (Table 3). Consequently, the Fornell-Larcker criterion was also obtained for VSS − AA, leading to establishment of discriminant validity.
Regarding the 15 items’ structural consistency, the item loading results in both methods were nearly similar, but the robustness of polychoric correlation via DWLS was evident through higher AVE and item-loadings. The two-factor model in the VSS − SF −CK was suitable according to the recommended fit indi-ces. Along with structure, the construct was also vali-dated across internal consistency parameters such as αs, rhoA, and rhoC, and it was clear from the results that all values achieved desirable levels. Despite the low AVE, discriminant validity was also established by both HTMT and HTMT-inference, while the Fornell-Larcker criterion was obtained for only one factor, VSS −V.
The hypotheses regarding convergent validity were supported. An adequate positive correlation was found between VSS−T and VAS−T as well as a moderate negative correlation between the VSS − V and stability; the latter replicated a similar correlation (between VSS-V and path length) in a previous ana-lysis [15]. Although the types of scores in VSS−AA and TR−T are different (subjective and objective), the resultant weak negative correlation between them (−0.14) indicates the divergent ability of the VSS−AA because they measure two different constructs (anx-iety and stability).
The instrument significantly discriminated the healthy group from the patients’group and subgroups; however, it was not efficient in discriminating presen-tation subgroups, most probably because patients narrated the sum of their symptoms from the onset, regardless of the presence or absence of symptoms at the time of rating; as Yardley stated, the score is a cumulative measure [10]. The interpretability and responsiveness were beyond the scope of this study.
Strengths and limitations
We believe that the study’s strength is its sample be-ing representative of the target population. However, a potential limitation was related to convergent valid-ity, as there were no validated comparator PROMs in Kurdish that could measure the same construct; for that reason we utilized VAS and emphasized discrim-inant validity. Second, close observation was required to sustain patients’ motivation for self-rating; and fi-nally, because of the accommodation issue, we were
Table 4Spearman’s correlation of the scales with the comparators
n = 165 n= 159 n= 143
VSS-V VSS-AA VAS-T TR-T
VSS-V 0.48a −0.37a
VSS-AA 0.58a 0.52a −0.14b
VSS-T 0.85a 0.91a 0.57a −0.27a
Note:Correlations stated in the hypotheses are in bold;aCorrelations is significant at the level of 0.01;b
Correlation is significant at the level 0.05 Abbreviations:VSS–V/AA/TVertigo Symptom Scale– Vestibular/Autonomic-Anxiety/Total,VAS–TVisual Analogue Scale–Total,TR–T
Tandem Romberg–Total
Table 3External reliability of the instruments
VSS−SF−CKn= 74 n= 76 n= 35
VSS−V VSS−AA VSS−T VAS−T TR−T
ICCa n ICCa n ICCa n ICCa n ICCa n
Intra-rater1 0.88 28 0.93 28 0.95 28 0.98 28 0.95 12
Intra-rater2 0.83 28 0.96 28 0.97 28 0.90 29 0.80 13
Inter-rater 0.97 18 0.93 18 0.97 18 0.96 19 0.91 10
Test-retest 0.93 74 0.94 74 0.97 74 0.96 76 0.90 35
Note:a
Intraclass correlation coefficient: the model, two-way mixed effects; the type, mean of k raters; and the definition, absolute agreement
obliged to shorten the minimum interval between rat-ing events to 1 day.
Conclusion
The VSS−SF was cross-culturally adapted to Kurdish. It revealed high external reliabilities. The structure of the 2-factor model was associated with high internal consistency and composite reliability with the ability to discriminate two latent variables (vestibular and autonomic-anxiety). These stabilities were confirmed by goodness of fit indices. It has adequate correla-tions with the comparators, demonstrating convergent validity. VSS−SF−CK is, then, a consistent and vali-dated PROM that can be used by Kurdish researchers and clinicians to quantify vestibular symptoms before and/or after treatment protocols.
Additional files
Additional file 1:Methodology and statistics. More detail on: Kurdish population, Cross-cultural adaptation, comparator instruments, external reliability test, and statistical approach. (DOCX 29 kb)
Additional file 2:Subjective ratings of contents and cultural understandability . A specific form designed for subjective rating for the consistency of the contents of each of the 15 translated symptoms in regard to meaning, lucidity, and cultural understandability. (PDF 1015 kb)
Additional file 3:VSS−SF−CK. The final version of the Vertigo Symptom Scale–Short form in central Kurdish dialect. (PDF 803 kb)
Additional file 4:Table S1.Horn’s Parallel analysis.Table S2.Minimum average partial.Table S3.Pearson’s correlations.Table S4.Medians and interquartile range of the scales. (DOCX 25 kb)
Additional file 5:Estimation of the AVE and rhoC. contains equation to estimate the average variance extracted (AVE) and composite reliability (rhoC), with the URL of the explaining movie. (XLSX 13 kb)
Additional file 6:Exploratory factor analysis by DWLS, Output of the FACTOR: A computer program, containing the detail of the exploratory factor analysis using polychoric correlation through robust diagonally weighted least squares. (TXT 29 kb)
Additional file 7:Codes and abbreviations of dataset. Description: Clarification of the codes and abbreviations of the dataset supporting the conclusion. (XLSX 11 kb)
Additional file 8:Dataset. Dataset supporting the conclusions of this article (XLSX 37 kb)
Abbreviations
AIC:Average Inter-item Correlation; AIID: Alpha If Item Deleted; AVE: Average Variance Extracted; CFI: Comparative Fit Index; CI-TC: Corrected Item-Total Correlation; DWLS: Diagonally Weighted Least Squares; EFA: Exploratory Factor Analysis; HPA: Horn’s Parallel Analysis; HTMT: Heterotrait–monotrait ratio; ICC: Intraclass Correlation Coefficient; IFC/IFC2: Inter-Factor Correlation/ Square of IFC; MAP: Minimum Average Partial; PAF: Principal Axis Factoring; PC: Polychoric Correlations; PROMs: Patient-Reported Outcome Measures; rhoA: Reliability measure of the partial least squares; rhoC: Composite reliability; RMSEA: Root Mean Square Error of Approximation; TR-T: Tandem Romberg-Total; VAS-TR-T: Visual Analogue Scale-Total; VD: Vestibular Disorders; VS: Vestibular Symptoms; VSS-SF-CK/V/AA/ T: Vertigo Symptom Scale–Short Form-Central Kurdish/vestibular/Auto-nomic-Anxiety/Total;α: Cronbach’s alpha
Acknowledgments
The authors would like to express their appreciations to Professor Lucy Yardley for her permission. Further gratitude goes to Dr. Tebin Sabri and Fig. 3Shape and distribution of the scores in subgroups and healthy group. Note: Subgroups were classified based on the pattern of
Dr. Peshraw Bwrhan, for their joint effort concerning clinical indexing of the cases.
Authors’contributions
SZ contributed to the study design, cultural adaptation, data collection, statistical approach, data analysis, and writing the manuscript. YC contributed to the data collection, statistical approach, data analysis, and reviewed the manuscript. Both authors have read and approved the final manuscript.
Funding
There is no funding in this work to be reported.
Availability of data and materials
The datasets supporting the conclusions of this article are included within the article and its Additional files7and8.
Ethics approval and consent to participate
Approval (number 43C) was granted from the ethical committee of the College of medicine/University of Sulaimani, Iraq. The work was implemented in accordance with international guidelines and 2008 Declaration of Helsinki. Written informed consents were provided by participants.
Consent for publication Not applicable.
Competing interests
The authors declare that they have no competing interests.
Received: 13 November 2018 Accepted: 31 May 2019
References
1. Bisdorff A, Von Brevern M, Lempert T, Newman-Toker DE. Classification of vestibular symptoms: towards an international classification of vestibular disorders. J Vestib Res. 2009;19(1–2):1–13.
2. Koo JW, Chang MY, Woo SY, Kim S, Cho YS. Prevalence of vestibular dysfunction and associated factors in South Korea. BMJ Open. 2015;5(10): e008224.
3. Hannaford PC, Simpson JA, Bisset AF, Davis A, McKerrow W, Mills R. The prevalence of ear, nose and throat problems in the community: results from a national cross-sectional postal survey in Scotland. Fam Pract. 2005;22(3):227–33. 4. Newman-Toker DE, Edlow JA. TiTrATE: a novel, evidence-based approach to
diagnosing acute dizziness and vertigo. Neurol Clin. 2015;33(3):577–99 viii. 5. Newman-Toker DE, Cannon LM, Stofferahn ME, Rothman RE, Hsieh YH, Zee
DS. Imprecision in patient reports of dizziness symptom quality: a cross-sectional study conducted in an acute care setting. Mayo Clin Proc. 2007; 82(11):1329–40.
6. Neuhauser HK, Radtke A, von Brevern M, Lezius F, Feldmann M, Lempert T. Burden of dizziness and vertigo in the community. Arch Intern Med. 2008; 168(19):2118–24.
7. Prinsen CAC, Mokkink LB, Bouter LM, Alonso J, Patrick DL, de Vet HCW, et al. COSMIN guideline for systematic reviews of patient-reported outcome measures. Qual Life Res. 2018;27(5):1147–57.
8. Mokkink LB, Terwee CB, Knol DL, Stratford PW, Alonso J, Patrick DL, et al. The COSMIN checklist for evaluating the methodological quality of studies on measurement properties: a clarification of its content. BMC Med Res Methodol. 2010;10(1):22.
9. Stewart VM, Mendis MD, Low Choy N. A systematic review of patient-reported measures associated with vestibular dysfunction. Laryngoscope. 2018;128(4):971–81.
10. Yardley L, Masson E, Verschuur C, Haacke N, Luxon L. Symptoms, anxiety and handicap in dizzy patients: development of the vertigo symptom scale. J Psychosom Res. 1992;36(8):731–41.
11. Mendel B, Bergenius J, Langius A. Dizziness symptom severity and impact on daily living as perceived by patients suffering from peripheral vestibular disorder. Clin Otolaryngol Allied Sci. 1999;24(4):286–93.
12. Yardley L, Donovan-Hall M, Smith HE, Walsh BM, Mullee M, Bronstein AM. Effectiveness of primary care-based vestibular rehabilitation for chronic dizziness. Ann Intern Med. 2004;141(8):598–605.
13. Yardley L, Beech S, Zander L, Evans T, Weinman J. A randomized controlled trial of exercise therapy for dizziness and vertigo in primary care. Br J Gen Pract. 1998;48(429):1136–40.
14. Mokkink LB, Terwee CB, Patrick DL, Alonso J, Stratford PW, Knol DL, et al. The COSMIN study reached international consensus on taxonomy, terminology, and definitions of measurement properties for health-related patient-reported outcomes. J Clin Epidemiol. 2010;63(7):737–45.
15. Wilhelmsen K, Strand LI, Nordahl SHG, Eide GE, Ljunggren AE. Psychometric properties of the Vertigo symptom scale - Short form. BMC Ear Nose Throat Disord. 2008;8(1):2.
16. Kondo M, Kiyomizu K, Goto F, Kitahara T, Imai T, Hashimoto M, et al. Analysis of vestibular-balance symptoms according to symptom duration: dimensionality of the vertigo symptom scale-short form. Health Qual Life Outcomes. 2015;13:4.
17. Wong LP. Focus group discussion: a tool for health and medical research. Singap Med J. 2008;49(3):256–60.
18. Wild D, Grove A, Martin M, Eremenco S, McElroy S, Verjee-Lorenz A, et al. Principles of good practice for the translation and cultural adaptation process for patient-reported outcomes (PRO) measures: report of the ISPOR task force for translation and cultural adaptation. Value Health. 2005;8(2):94–104. 19. Beaton DE, Bombardier C, Guillemin F, Ferraz MB. Guidelines for the process
of cross-cultural adaptation of self-report measures. Spine (Phila Pa 1976). 2000;25(24):3186–91.
20. Beavers AS, Lounsbury JW, Richards JK, Huck SW, Skolits GJ, Esquivel SL. Practical considerations for using exploratory factor analysis in educational research. Pract Assess, Res Eval. 2013;18(6):1–13.https://pareonline.net/getvn.asp?v=18&n=6. 21. Bronstein AM, Lempert T. Symptoms and syndromes in the patient with
dizziness or unsteadiness. In: Bronstein AM, editor. Oxford textbook of vertigo and imbalance. Oxford: Oxford University Press; 2013. p. 115–21. 22. Koo TK, Li MY. A guideline of selecting and reporting intraclass correlation
coefficients for reliability research. J Chiropr Med. 2016;15(2):155–63. 23. dos SSI. Measurement of exposures and outcomes. In: dos SSI, editor.
Cancer epidemiology, principles and methods. Lyon: International Agency for Research on Cancer; 1999. p. 11–44.
24. Johnson BG, Wright AD, Beazley MF, Harvey TC, Hillenbrand P, Imray CH, et al. The sharpened Romberg test for assessing ataxia in mild acute mountain sickness. Wilderness Environ Med. 2005;16(2):62–6.
25. Kottner J, Audige L, Brorson S, Donner A, Gajewski BJ, Hrobjartsson A, et al. Guidelines for reporting reliability and agreement studies (GRRAS) were proposed. J Clin Epidemiol. 2011;64(1):96–106.
26. de Vet HCW, Terwee CB, Mokkink LB, Knol DL. In: de Vet HCW, Terwee CB, Mokkink LB, Knol DL, editors. Measurement in medicine: a practical guide Field-testing: item reduction and data structure. New York: Cambridge University Press; 2011. p. 65–95.
27. Kim HY. Statistical notes for clinical researchers: assessing normal distribution (2) using skewness and kurtosis. Restor Dent Endod. 2013;38(1):52–4. 28. Watkins MW. Exploratory factor analysis: a guide to best practice. J Black
Psychol. 2018;44(3):219–46.
29. Feng C, Wang H, Lu N, Chen T, He H, Lu Y, et al. Log-transformation and its implications for data analysis. Shanghai Arch Psychiatry. 2014;26(2):105–9. 30. Norman G. Likert scales, levels of measurement and the "laws" of statistics.
Adv Health Sci Educ Theory Pract. 2010;15(5):625–32.
31. Lloret-Segura S, Ferreres-Traver A, Hernández-Baeza A, Tomás-Marco I. Exploratory item factor analysis: a practical guide revised and up-dated. Ann Psychol. 2014;30(3):1151–69.
32. Mindrila D. Maximum likelihood (ML) and diagonally weighted least squares (DWLS) estimation procedures: a comparison of estimation bias with ordinal and multivariate non-normal data. Int J Digital Soc. 2010;1(1):60–6. 33. Zygmont C, Smith MR. Robust factor analysis in the presence of normality
violations, missing data, and outliers: empirical questions and possible solutions. Tutor Quant Methods Psychol. 2014;10(1):40–55.
34. Garrido LE, Abad FJ, Ponsoda V. A new look at Horn's parallel analysis with ordinal variables. Psychol Methods. 2013;18(4):454–74.
35. Henseler J, Ringle CM, Sarstedt M. A new criterion for assessing discriminant validity in variance-based structural equation modeling. J Acad Mark Sci. 2015;43(1):115–35.
36. Ringle CM, Wende S, Becker J-M. SmartPLS3. Bönningstedt. 2015.http:// www.smartpls.com.
38. Gliem JA, Gliem RR: Calculating, interpreting, and reporting Cronbach’s alpha reliability coefficient for Likert-type scales. Midwest Research-to-Practice Conference in Adult, Continuing, and Community Education. Columbus: The Ohio State University; 2003:82–8.
39. Terwee CB, Bot SD, de Boer MR, van der Windt DA, Knol DL, Dekker J, et al. Quality criteria were proposed for measurement properties of health status questionnaires. J Clin Epidemiol. 2007;60(1):34–42.
40. Henseler J. Partial least squares path modeling. In: Leeflang PSH, Wieringa JE, Bijmolt THA, Pauwels KH, editors. Advanced methods for modeling markets. Basel: Springer International Publishing; 2017. p. 361–81. 41. Son EJ, Lee DH, Oh JH, Seo JH, Jeon EJ. Correlation between the dizziness
handicap inventory and balance performance during the acute phase of unilateral vestibulopathy. Am J Otolaryngol. 2015;36(6):823–7. 42. Jacobson GP, Newman CW. The development of the dizziness handicap
inventory. Arch Otolaryngol Head Neck Surg. 1990;116(4):424–7. 43. Abma IL, Rovers M, van der Wees PJ. Appraising convergent validity of
patient-reported outcome measures in systematic reviews: constructing hypotheses and interpreting outcomes. BMC Res Notes. 2016;9:226. 44. Lorenzo-Seva U, Ferrando PJ. FACTOR: a computer program to fit the
exploratory factor analysis model. Behav Res Methods. 2006;38(1):88–91. 45. O'Connor BP. SPSS and SAS programs for determining the number of
components using parallel analysis and velicer's MAP test. Behav Res Methods Instrum Comput. 2000;32(3):396–402.
46. Yardley L, Medina SM, Jurado CS, Morales TP, Martinez RA, Villegas HE. Relationship between physical and psychosocial dysfunction in Mexican patients with vertigo: a cross-cultural validation of the vertigo symptom scale. J Psychosom Res. 1999;46(1):63–74.
47. Abell TL, Parajuli D. Nausea and vomiting related to autonomic nervous system disorders. In: Kock K, W H, editors. Nausea and vomiting - diagnosis and treatment. Basel: Springer International Publishing; 2017. p. 89–107. Publisher’s Note