United Kingdom Vol. VI, Issue 4, April 2018
Licensed under Creative Common Page 455
http://ijecm.co.uk/
ISSN 2348 0386
STATISTICAL DIAGNOSTICS FOR BIVARIATE CORRELATION AND
REGRESSION ANALYSIS BETWEEN CRYPTOCURRENCY
EXCHANGE RATES OF BITCOIN AND ETHEREUM
Nashirah Abu Bakar
Islamic Business School, College of Business, Universiti Utara Malaysia, Malaysia [email protected]
Sofian Rosbi
School of Mechatronic Engineering, Universiti Malaysia Perlis, Malaysia [email protected]
Abstract
Cryptocurrency is digital money that exists in form of cryptography. The popular cryptocurrencies are Bitcoin and Ethereum. Both of this cryptocurrency implements public ledger that maintain by decentralized system. In year 2017, both of this cryptocurrency attracts attention from investors because of high return for investment. However, in year of 2018, both of these cryptocurrency exhibits a reduction trend in their price. Therefore, the objective of this study is to evaluate the correlation of dynamic movement of exchange rate between Bitcoin and Ethereum. This study implemented statistical approach of correlation test to detect the covariance movement of exchange rate. Result indicates the correlation factor between Bitcoin and Ethereum is 0.653. Therefore, result concluded there is significant, positive and strong association between Bitcoin and Ethereum exchange rate. The finding of this study can benefits investors to predict the price movement among cryptocurrencies. In the same time, the knowledge of price movement can help investor to gain better profit and reducing loss for their investment portfolio.
Licensed under Creative Common Page 456
INTRODUCTION
In February 2018, the price for cryptocurrency starting to drop sharply. This situation attracted most researchers and statutory bodies to investigate the factors that influenced the dynamic behavior of cryptocurrency. Cryptocurrency is open-source, block chain-based distributed computing platform and can be transferred between accounts and used to compensate participant mining nodes for computations performed (Abu Bakar, et al., 2017; Ram, et al., 2016; Rees, et al., 2014). The ability of cryptocurrencies is to enable anonymous transactions allows users to trade virtual currency regardless of their geographic location, without revealing either the real-world source of their income or their own identity (Reynolds and Irwin, 2017).Among the highest demand for cryptocurrency is Bitcoin and Ethereum.
Bitcoin and Ethereum cryptocurrency was getting high demand from investor due to high price that was generate high return to investors. The high price recorded by Bitcoin isUSD19343while, the high price recorded by Ethereum is USD1397. Therefore, the investors was interested to invest in this two cryptocurrencies. But, the problem arise is investors was faced with high risk and high volatility of market price for Bitcoin and Ethereum cryptocurrency transaction. According to Abu Bakar and Rosbi (2017) the standard error for Bitcoin volatility is 4.458 %, and considered as high value of volatility. High value of volatility indicates that the investment in Bitcoin transaction is categorical as high risk investment. Therefore, this study was investigates the bivariate correlation and regression analysis between Bitcoin and Ethereum cryptocurrency. This study implemented statistical approach of correlation test to detect the covariance movement of exchange rate.
Bitcoin is the first virtual currency that was introduced by Satoshi Nakamotoin 2008 and this cryptocurrency is not regulated by any central authoritative body (Nakamoto, 2008). Bitcoin offers the promise of lower transaction fees than traditional online payment mechanisms and is operated by a decentralized authority, unlike government issued currencies. While, Ethereum is newest technologies that was launched in 2015.Ethereum is the largest and most well-established, open-ended decentralized software platform. The potential applications of Ethereum are wide ranging and run on its platform-specific cryptographic token known as Ether (Bajpai, 2018). Bitcoin were designed by engineers with no apparent influence from lawyers or regulators. Rather than store transactions on any single server or set of servers, Bitcoin is built on a transaction log that is distributed across a network of participating computers. It includes mechanisms to reward honest participation, to bootstrap acceptance by early adopters and to guard against concentrations of power. Bitcoin’s design allows for irreversible transactions, a
Licensed under Creative Common Page 457
LITERATURE REVIEW
The cryptocurrency attracted high attention from investors, researchers and statutory bodies due to high return generated by investing in cryptocurrency market. Cryptocurrency is defined as a digital currency in which encryption techniques are used to regulate the generation of units of currency and verify the transfer of funds, operating independently of a central bank. A cryptocurrency is a digital asset designed to work as a medium of exchange using cryptography to secure the transactions and to control the creation of additional units of the currency. A cryptocurrency is a virtual currency that uses cryptography for security. A cryptocurrency is difficult to counterfeit because of this security feature.
There are two types of cryptocurrency that was attracted most investors to invest that known as BItcoin and Ethereum. Most cryptocurrencies are designed to gradually decrease production of currency, placing an ultimate cap on the total amount of currency that will ever be in circulation, mimicking precious metals (Barber, et al., 2012).A ledger is the principal book or computer file for recording and totaling economic transactions measured in terms of a monetary unit of account-by-account type, with debits and credits in separate columns and a beginning monetary balance and ending monetary balance for each account (Ron and Shamir, 2013). A blockchain is an open, distributed ledger that can record transactions between two parties efficiently and in a verifiable and permanent way (Reid and Harrigan, 2013).
Ciaian et al., (2016) analyzed the relationship between Bitcoin price and supply-demand fundamentals of Bitcoin, global macro-financial indicators and Bitcoin’s attractiveness for
investors. The data used was from 2009 until 2014 and subjected to time-series analysis. They found that the Bitcoin market fundamentals and Bitcoin’s attractiveness for investors have a
significant impact on Bitcoin price. Bitcoin is not regarded as legal tender by a central authority or backed by goods/services having an intrinsic value (Chistopher, 2014) and Bitcoin is also decentralized in the sense that it is not issued by a government or single institution (Ram, et al., 2016). The security of cryptocurrency ledgers is based on the assumption that the majority of miners are honestly trying to maintain the ledger, having financial incentive to do so. While, Buchholz, et al., (2012) use ARCH/GARCH models to investigate the performance of Bitcoin. They found before the peak of the bubble, volatility had a statistically significant positive effect on price. Then, after the bubble burst, they see that market participants feared holding Bitcoins because many realized that they could lose their wealth due to fluctuations in Bitcoin price.
RESEARCH METHODOLOGY
Licensed under Creative Common Page 458
Pearson correlation analysis
The bivariate correlation is evaluated using Pearson correlation analysis. There are four assumptions that data that can be apply the Pearson correlation analysis.
The assumptions are:
(1) The data type must be interval or ratio.
(2) There is linear relationship between two variables. (3) There is no significant outlier.
(4) Variables should be approximately normally distributed.
The Pearson correlation is represented by equation below:
cov , var var x y x y x y
……… (1)In the Eq. (1), consider there are two variables.
Variable 1:
x
x x x
1,
2,
3,...,
x
n
.Variable 2:
y
y y y
1,
2,
3,...,
y
n
.The mean of the sample for variable is described as follow:
Mean for variable 1:
1 n i i x x n
.Mean for variable 2:
1 n i i y y n
Next, the covariance for bivariate is described in next equation:
1
1
cov( , )
1
n
i i
i
x y
x
x
y
y
n
Then, the standard deviation is described in below equation:
21
1
var
1
n x i iS
x
x
x
n
,
21
1
var
1
n y i iS
y
y
y
n
Licensed under Creative Common Page 459 Therefore, Eq. (1) can be re-write as:
1
2 2
1 1
n
i i
i
x y n n
i i
i i
x
x
y
y
x
x
y
y
………….……… (2)
Regression analysis
Linear regression analysis is developed to determine the association between dependent variable (y-variable) with dependent variables (x-variables). The function of linear regression is described as below:
(a) To describe linear dependence of one variable to another.
(b) To predict the value of dependent variables based on independent variables.
(c) To correct for the linear dependence of one variable on another, in order to clarify other features of its variability.
Regression equation is represented by following equation:
Y
a bX
……… (3)Where, Y is dependent variable, a is intercept, b is coefficient of correlation and X is independent variables.
Linear regression determines the best-fit line through a scatterplot of data, such that the sum of squared residuals is minimized. The residual is the vertical distance between a data point and the fitted line. The best linear fitted line is the line with lowest squared residual error. In the same time, the best linear fitted line also indicated the line with lowest error variance.
RESULT AND DISCUSSIONS
Data selection process
This study selected Bitcoin exchange rate starting from 16th January 2018 until 25th March 2018. The exchange rate is represented in United States Dollar (USD) for each Bitcoin. Data are collected daily at 00:00 hour from https://www.coindesk.com. Figure 1 shows the dynamic movement of Bitcoin exchange rate. There are 69 observations involved in this study. The maximum value of Bitcoin exchange rate is USD 12759.6 on 20th January 2018 (5th observation).
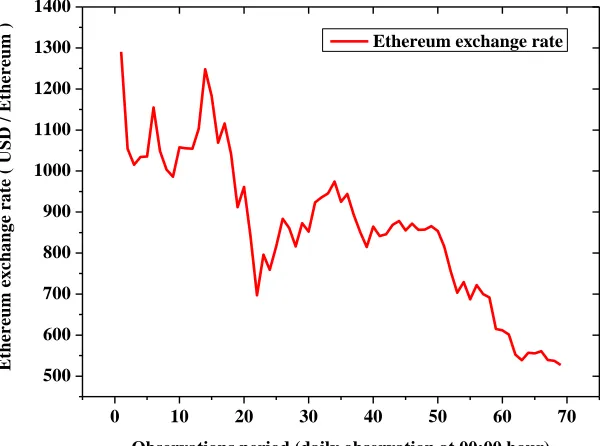
Licensed under Creative Common Page 460 Ethereum exchange rate. The maximum value of Ethereum exchange rate is USD 1290.6 on 16th January 2018 (1st observation).
0 10 20 30 40 50 60 70 6000 7000 8000 9000 10000 11000 12000 13000 14000
Observations period (daily observation at 00:00 hour)
B it c o in e x c h a n g e r a te ( U S D / E th e r e u m
) Bitcoin exchange rate
Figure 1: Dynamic movement of Bitcoin exchange rate
0 10 20 30 40 50 60 70 500 600 700 800 900 1000 1100 1200 1300 1400 E th er eu m e x ch a n g e ra te ( U S D / E th er eu m )
Observations period (daily observation at 00:00 hour) Ethereum exchange rate
Licensed under Creative Common Page 461
Pearson correlation analysis
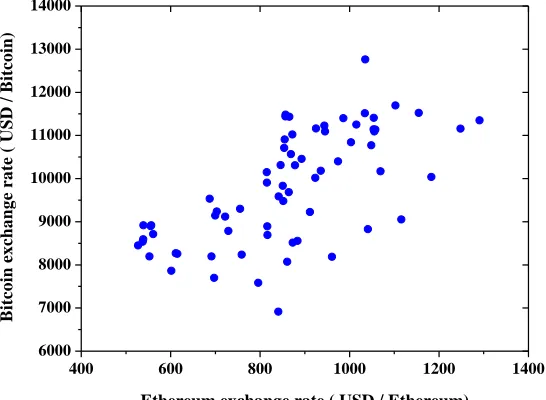
This section describes the correlation between Bitcoin exchange rate and Ethereum exchange rate. The analysis is carried out using graphical and numerical test. Figure 3 shows the correlation plot between Ethereum with Bitcoin exchange rate. Figure 3 shows there is positive correlation between Ethereum and Bitcoin exchange rate.
400 600 800 1000 1200 1400
6000 7000 8000 9000 10000 11000 12000 13000 14000
B
it
c
o
in
e
x
c
h
a
n
g
e
r
a
te
(
U
S
D
/
B
it
c
o
in
)
Ethereum exchange rate ( USD / Ethereum)
Figure 3: Correlation plot between Ethereum and Bitcoin
Next, this study performed statistical test to evaluate the correlation between Bitcoin and Ethereum exchange rate. Table 1 shows the Pearson correlation diagnostics for correlation analysis between Bitcoin and Ethereum. The significant value is 0.000, which less than alpha which is 0.05. Therefore, we reject null hypothesis. The p-value indicates there is significant correlation between Bitcoin and Ethereum exchange rate. Pearson correlation is 0.653 that indicates there is strong, positive correlation between Bitcoin and Ethereum exchange rates.
The correlation can be described as(0.653,n69,p0.000).
Table 1: Pearson correlation for Bitcoin and Ethereum Ethereum
Bitcoin
Pearson correlation 0.653
Licensed under Creative Common Page 462
Regression analysis
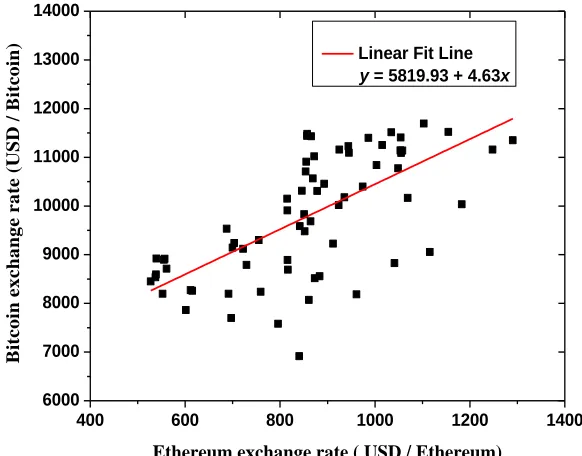
This section develops the regression analysis for Bitcoin exchange rate with Ethereum exchange rate. Bitcoin exchange rate is setting as dependant variable (y-axis variable); Ethereum exchange rate is setting as independent variable (x-axis variable). Figure 4 shows the scatter plot including the linear fit line.
400 600 800 1000 1200 1400
6000 7000 8000 9000 10000 11000 12000 13000 14000
Linear Fit Line y = 5819.93 + 4.63x
B
it
c
o
in
e
x
c
h
a
n
g
e
r
a
te
(
U
S
D
/
B
it
c
o
in
)
Ethereum exchange rate ( USD / Ethereum)
Figure 4: Scatter plot with linear fit line
The linear fit line is represented by below equation: 5819.93 4.63
y x……… (4)
In Eq. (4), y-variable is Bitcoin exchange rate and x-variable is Ethereum exchange rate. This equation indicates for every increment in Ethereum exchange rate (x-variable), there is increment of 4.63 in Bitcoin exchange rate (y-variable).In opposite direction, if there is decrement of one unit in Ethereum exchange rate (x-variable), it will creates 4.63 unit of decrement in Bitcoin exchange rate (y-variable).
Licensed under Creative Common Page 463 Table 2: Model summary
Correlation coefficient, R R-squared
0.653 0.427
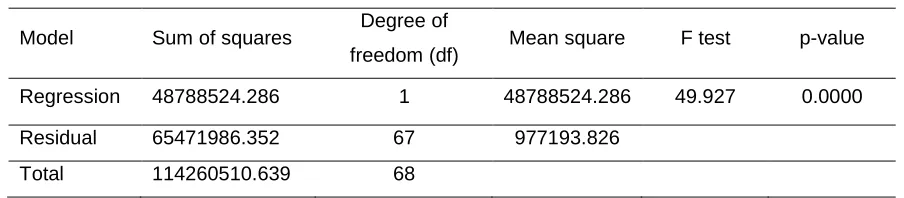
Then, this study performed F-test analysis to check whether the regression model fits the data better than the model with no independent variables. Table 3 shows the result of F-test analysis for regression model in Eq. (4). The p-value is 0.000 which is less than 0.05. Therefore, the study concluded that the model fits the data better than the model without independent variable. This study concluded the regression equation that represented by Eq. (4) is statistically significant to address the relationship between dependent variable and independent variable.
Table 3: F-test analysis
Model Sum of squares Degree of
freedom (df) Mean square F test p-value
Regression 48788524.286 1 48788524.286 49.927 0.0000
Residual 65471986.352 67 977193.826
Total 114260510.639 68
CONCLUSION
The objective of this study is to evaluate the correlation between Bitcoin and Ethereum exchange rate. In addition, this study also evaluated the regression analysis of dependent variable (Bitcoin exchange rate) and independent variable (Ethereum exchange rate). The main findings of this study are:
(a) This study selected Bitcoin exchange rate starting from 16th January 2018 until 25th March 2018. There are 69 observations involved in this study. The maximum value of Bitcoin exchange rate is USD 12759.6 on 20th January 2018 (5th observation).
(b) Next, this study selected Ethereum exchange rate data starting from 16th January 2018 until 25th March 2018. There are 69 observations involved in the calculation. The maximum value of Ethereum exchange rate is USD 1290.6 on 16th January 2018 (1st observation).
(c) Then, this study performed statistical test to evaluate the correlation between Bitcoin and Ethereum exchange rate. The p-value indicates there is significant correlation between Bitcoin and Ethereum exchange rate. Pearson correlation is 0.653 that indicates there is strong, positive correlation between Bitcoin and Ethereum exchange rates. The correlation can be
Licensed under Creative Common Page 464 (d) Next, this study analyzed the fitness of the model. The R-squared value indicates the degree of total variation in the dependent variable, can be explained by independent variable. In this study, the 42.7 percentages of variation for Bitcoin exchange rate can be explained by Ethereum exchange rate.
(e) Then, this study performed F-test analysis to check whether the regression model fits the data better than the model with no independent variables. The regression equation is represented the data as below:
5819.93 4.63
y x
The p-value is 0.000 which is less than 0.05. Therefore, the study concluded that the model fits the data better than the model without independent variable. This study concluded the regression equation is statistically significant to address the relationship between dependent variable and independent variable.
The findings of this study will help investors monitor the changes of cryptocurrency exchange rate closely in gaining better return and preventing loss in investment portfolio selection.
The further research of this study area can be extending to analysis of determinant factors that contributes to the movement of exchange rate for Bitcoin and Ethereum. In addition, the analysis of volatility level for cryptocurrency also is one of the scope for future studies of this study.
REFERENCES
Abu Bakar, N.,Rosbi, S. and Uzaki, K. (2017), Cryptocurrency Framework Diagnostics from Islamic Finance Perspective: A New Insight of Bitcoin System Transaction, International Journal of Management Science and Business Administration, Vol. 4, Issue: 1, pp. 19-28.
AbuBakar, N. and Rosbi, S. (2017), High Volatility Detection Method Using Statistical Process Control for Cryptocurrency Exchange Rate: A Case Study of Bitcoin, The International Journal of Engineering and Science, Vol. 6, Issue: 1, pp. 39-48.
Bajpai, P. (2018), Bitcoin Vs Ethereum: Driven by Different Purposes, available at:
https://www.investopedia.com/articles/investing/031416/bitcoin-vs-ethereum-driven-different-purposes.asp#ixzz5BODKZUe4
Barber, S., Boyen, X., Shi, E. and Uzun, E. (2012), Bitter to better - how to make Bitcoin a better currency,International Conference on Financial Cryptography and Data Security, Vol. 7397, pp. 399-414.
Bohme, R., Christin, N., Edelman, B., and Moore, T. (2015),Bitcoin: Economics, technology, and governance,The Journal of Economic Perspectives, Vol. 29, Issue: 2, pp. 213-238.
Buchholz, M., Delaney, J., Warren, J. and Parker, J. (2012), Bits and Bets, Information, Price Volatility, and Demand for Bitcoin, Economics 312 (Spring 2012), available at: http://www.bitcointrading.com/pdf/bitsandbets.pdf
Ciaian, P. Rajcaniova, M. and Kancs, D.A. (2016), The economics of Bitcoin price formation. Apply Economic, Vol. 48, Issue: 19, pp. 1799-1815.
Christopher, C.M. (2014), Whack-a-mole: why prosecuting digital currency exchanges won’t stop online laundering, Lewis and Clark Law Review, Vol. 1 No. 1, pp. 1-36.
Licensed under Creative Common Page 465 Ram, A., Maroun, W. and Garnett, R. (2016), Accounting for the Bitcoin: accountability, neoliberalism and a correspondence analysis, Meditari Accountancy Research, Vol. 24, Issue: 1, pp.2-35.
Rees, M. (2014),Bitcoin to earth: don’t look now, but your paradigm is shifting, Bitcoin Magazine, available at: http://bitcoinmagazine.com/15054/bitcoin-earthdont-look-nowparadigm-shifting/ (accessed 9 December 2017) Reynolds, P. and Irwin, A.S.M. (2017), Tracking digital footprints: anonymity within the Bitcoin system, Journal of Money Laundering Control, Vol. 20, Issue: 2, pp.172-189.
Reid,F. and Harrigan,M., (2011) An analysis of anonymity in the Bitcoin system,IEEE Third International Conference on Social Computing, pp. 1318-1326.