www.nat-hazards-earth-syst-sci.net/13/3457/2013/ doi:10.5194/nhess-13-3457-2013
© Author(s) 2013. CC Attribution 3.0 License.
Natural Hazards
and Earth System
Sciences
Modelling of tsunami-like wave run-up, breaking and impact on a
vertical wall by SPH method
M. H. Dao1, H. Xu2, E. S. Chan3, and P. Tkalich2
1Center for Environmental Sensing and Modeling, Singapore-MIT Alliance for Research and Technology, Singapore 2Tropical Marine Science Institute, National University of Singapore, Singapore
3Department of Civil Engineering, National University of Singapore, Singapore
Correspondence to: M. H. Dao ([email protected])
Received: 21 May 2013 – Published in Nat. Hazards Earth Syst. Sci. Discuss.: 22 June 2013 Revised: 8 November 2013 – Accepted: 18 November 2013 – Published: 23 December 2013
Abstract. Accurate predictions of wave up and run-down are important for coastal impact assessment of rela-tively long waves such as tsunami or storm waves. Wave run-up is, however, a complex process involving nonlinear build-up of the wave front, intensive wave breaking and strong tur-bulent flow, making the numerical approximation challeng-ing. Recent advanced modelling methodologies could help to overcome these numerical challenges. For a demonstration, we study run-up of non-breaking and breaking solitary waves on a vertical wall using two methods, an enhanced smoothed particle hydrodynamics (SPH) method and the traditional non-breaking nonlinear model Tunami-N2. The Tunami-N2 model fails to capture the evolution of steep waves at the proximity of breaking that was observed in the experiments. Whereas the SPH method successfully simulates the wave propagation, breaking, impact on structure and the reform and breaking processes of wave run-down. The study also indicates that inadequate approximation of the wave break-ing could lead to significant under-predictions of wave height and impact pressure on structures. The SPH model shows po-tential applications for accurate impact assessments of wave run-up on to coastal structures.
1 Introduction
The recent tsunami generated by the Honshu earthquake in 2011 caused tremendous damages to residential and in-dustrial installations at the affected area. Approximately 15 000 people were killed and more than 300 000 buildings were damaged by the earthquake and tsunami (Mimura et al.,
2011). The deep-inland and powerful run-up of the tsunami wave damaged the power cooling units of the Fukushima Daiichi nuclear power plant, triggering one of the world’s scariest nuclear disasters (US Geological Survey, 2012). All of these events and the lessons learnt from the 2004 Indian Ocean Tsunami disaster have shown that in spite of studies during the past decades, the run-up threats and destructive force of powerful waves have been underestimated.
have been successful in capturing the build-up and breaking of steep wave fronts. However, for very steep surface defor-mation and intensive breaking, very fine meshes are needed to resolve the breaking free surface and water jets created by the breaking wave fronts. Even then, mass conservation is still a challenge for the surface tracking methods, leading to inaccurate modelling of post-breaking processes.
Recently, meshless methods have become popular in mod-elling of similar fluid dynamics problems. The smooth parti-cle hydrodynamics (SPH) method is one of the most robust, efficient, stable and accurate meshless methods. The SPH method was first introduced independently by Gingold and Monaghan (1977) and Lucy (1977) and has later been mod-ified for modelling wave breaking on beaches in two and three dimensions, green waters and wave structure interac-tions (Colagrossi and Landrini, 2003; Dalrymple and Rogers, 2006; Gomez-Gesteira et al., 2005). Dao (2010) and Dao et al. (2011) extended the method and simulated the propaga-tion, focusing and breaking of a wave group in deep water us-ing an advanced modellus-ing methodology and a very fine res-olution. Very promising results that have not been achieved in past numerical studies were obtained, including the wave front evolution, fine flow structures under the breaking wave, water jets and sprays above the wave crest and the evolution of entrapped air bubbles. These features match very well with experimental observations.
The original SPH methods, although satisfying the mass conservation, still have zero order in the kernel approxi-mation which sometimes leads to significant reduction of wave height (Liu and Liu, 2006). Several studies (Bonet and Kulasegaram, 2000; Vidal et al., 2007; Oger et al., 2007) have introduced correction terms on the governing equations to improve the kernel approximation to first order. Xu et al. (2010) and Xu (2013) extended and implemented an en-hanced correction method proposed by Liu and Liu (2006). The enhanced SPH model was used to simulate sloshing and solitary wave propagations and impacts on to structures. Ob-tained results showed significant improvement of momentum conservation. The enhanced SPH method is able to simulate wave propagations over a long distance, breaking and impact pressures at a satisfactory level of accuracy.
In this study, the enhanced SPH method is used to simulate solitary wave run-up and run-down over a sloping beach with breaking and impact on a vertical wall. The simulation re-sults of the SPH model are compared with that of the famous tsunami model, Tunami-N2 (Goto et al., 1997), and verified against the experiments conducted at the US Army Corps of Engineers Waterways Experiment Station, Vicksburg, Mis-sissippi (Briggs et al., 1995). In the experiment, three types of solitary wave run-up, which include non-breaking, closed to breaking, and breaking wave, were considered. A brief in-troduction of important features of the numerical models is presented, whereas for more details, readers are referred to previous publications on SPH (Dao, 2010; Dao et al., 2011;
Xu et al., 2010; Xu, 2013) and the Tunami-N2 model (Goto et al., 1997; Dao and Tkalich, 2007).
2 Numerical models
2.1 Governing equations
The wave propagation and run-up can be governed by the Navier–Stokes equations which take the form of
dρ
dt = −ρ∇ ·u, (1)
du
dt = − 1
ρ∇p+g, (2)
where,ρandpare the density and pressure of the fluid. In two-dimensional space,u=(ux, uy)is the fluid velocity and
g=(gx, gy)is the gravitational acceleration.
2.2 SPH model
SPH method uses a set of discrete particles to approximate the fluid domain. The governing equations are approximated by the interaction of particles within a support domain of a kernel function. This approximation allows the divergences and gradients of fluid properties are transferred to the kernel function. The formulas take the following forms:
dρi
dt = −ρi∇ ·u= −ρi
X
j
mj
ρj
uj−ui· ∇iWij, (3)
dui
dt = −
X j
mj
p
i
ρiρj
+ pj ρiρj
∇iWij+gi, (4)
dxi
dt =ui, (5)
whereiandj are the particle indices,mis the mass of the particles, x is the position of the particles, andWis the kernel function. In this study, the following fifth-order Wendland kernel function is used:
Wij=W (q)=αD
1−q 2
4
(2q+1) , 0≤q≤2, (6) where,αD=7/(4π h2)andq=x−x0
/ his the
normal-ized distance from particle j to particle i. The parameter h, often called smoothing length, is a measure of the length scale of the support domain of the kernel function.
The relationship of the pressure and density of a particle follows the equation of state (Batchelor, 1967):
pi(ρ)=
ρoc20
γ ρi ρo γ −1
+po, (7)
wherec0 is the numerical sound speed,pois the reference
pressure,ρois the reference density andγ=7 for water. This
controlled by the numerical sound speed, thus the approx-imated fluid is weakly compressible. In this study, single-phase SPH is used. The numerical sound speed for water is chosen as 20 m s−1.
Sensitive studies on setting parameters and simulations of wave generation, propagation, breaking and impact on struc-tures by SPH have been verified in the previous studies by the authors (Dao, 2010; Dao et al., 2011; Xu et al., 2010; Xu, 2013)
2.3 Tunami-N2 model
The Tunami-N2 model used in this paper was originally de-veloped in the Disaster Control Research Center (Tohoku University, Japan) through the Tsunami Inundation Modeling Exchange (TIME) program (Goto et al., 1997). Tsunami-N2 solves a set of nonlinear shallow water approximation of the Navier–Stokes equations. The model uses second-order ex-plicit leap-frog finite difference scheme to discretize the set of nonlinear shallow water equations. Horizontal eddy turbu-lence is neglected and the bottom friction is computed from the Manning formulation. No specific treatment of breaking surface was introduced in the model.
The Tunami-N2 model has been intensively verified using analytical solutions, laboratory experiments and real cases, and subsequently applied to simulate tsunami propagation and run-up in the Pacific, Atlantic and Indian oceans, focus-ing on particular regional seas and coastal areas (Shuto et al., 1990; Shuto and Goto, 1988; Yalciner et al., 2004; Dao and Tkalich, 2007; Dao et al., 2008).
3 Solitary wave run-up simulations and discussions
3.1 Experiment setup
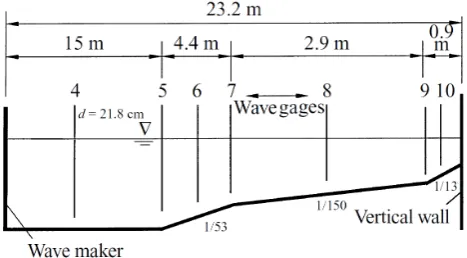
The experiment was conducted at the US Army Corps of En-gineers Waterways Experiment Station, Vicksburg, Missis-sippi (Briggs et al., 1995). The wave flume consisted of a wave maker located at the left side of the flume, a flat bot-tom followed by three slopes (1:53, 1:150 and 1:13) and a vertical wall located at the right side (see Fig. 1). Still water depth at the flat section wasd=21.8 cm. Several wave gages (4–10) were distributed in the flume to measure the surface elevation (the values in the brackets are the distances of the gages from the wave maker’s initial position): 4 (12.64 m), 5 (15.04 m), 6 (17.22 m), 7 (19.4 m), 8 (20.86 m), 9 (22.33 m) and 10 (22.78 m).
In the experiment, three different solitary waves were gen-erated by the movement of the piston paddle. The target wave height,htar/d, for each case was 0.05 (case A), 0.3 (case B)
and 0.7 (case C), respectively.
Fig. 1. Experiment setup.
3.2 Numerical setups and calibrations
The same wave flume configuration as in the experiment is used in the SPH simulations. A total of about 1.1 million water particles with a uniform diameter of dx=0.002 m is used. The fine particle resolution is used in order to resolve small wave heights of these cases, especially case A. Sec-ondly, more particles per wave length would improve the nu-merical decay of wave height. And thirdly, we are not only interested in the wave height of wave propagation, but also interested in the wave impact pressure on the wall. With more particles introduced, the pressure oscillation in the simula-tion (as a result of slightly-compressible SPH approach) will be reduced. The wave impact pressure on the wall will also be more accurate.
Fig. 2. Paddle trajectory used experiments and numerical simulations of three cases of solitary waves.
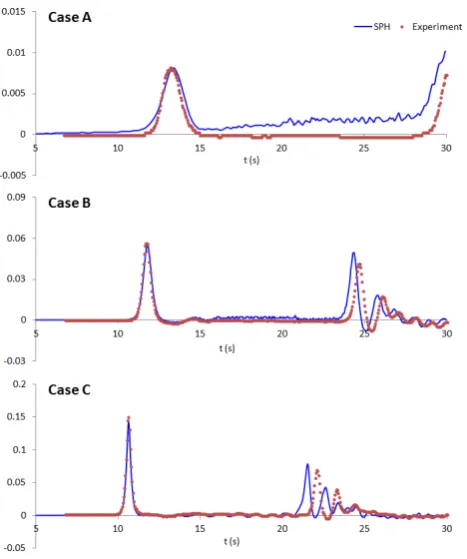
Fig. 3. Water levels recorded at gage 4.
In the simulations by Tunami-N2, the numerical domain is similar to the real wave flume, except that the left boundary is truncated at the location of gage 4. The time histories of wave height recorded at gage 4 in the experiments are used as prescribed water elevation boundary condition at the left boundary. The horizontal resolution of dx=0.002 m, which is equal to the particle size in the SPH simulations, is used in all simulations. Manning coefficient is 0.0025. No special treatment for wave breaking is added in Tunami-N2.
Fig. 4. Snapshot of an SPH result (case A) of solitary wave impact on the wall and pressure distribution at time instancet=21 s.
3.3 Numerical simulations of case A
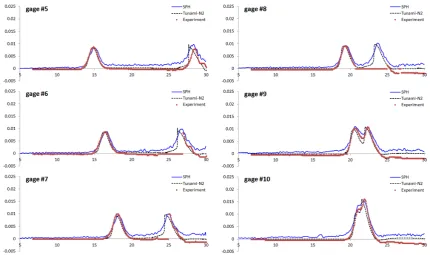
Fig. 5. Comparisons of time histories of wave height obtained from the experiment and numerical simulations at gages 5–10 of case A.
has passed the gages. Overall, Tunami-N2 achieves a slightly better result than SPH in comparison with the experiment. However, one must note that the incident wave at gage 4 used by Tunami-N2 takes the exact value of the experiment, while that of SPH is generated by numerical wave paddle and is slightly different from the experiment record (see Fig. 3). 3.4 Numerical simulation of case B
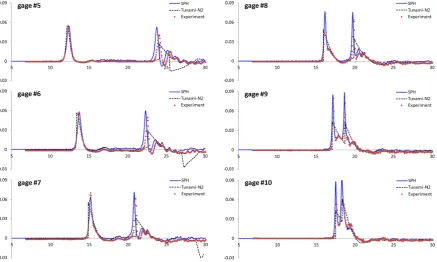
In case B, the incident wave in the experiment is steep and breaking possibly takes place. Snapshots of the solitary wave approaching and impacting on the vertical wall and pressure distribution obtained from the SPH simulation are shown in Fig. 6. Comparisons of time histories of wave height at gages 5–10 obtained from numerical simulations and experi-ment are shown in Fig. 7. Incident wave from both SPH and Tunami-N2 simulations agree well with experiment results at gage 5 and gage 6. At gage 7, both numerical incident waves are lower than that in the experiment but the SPH result is closer to the experiment. At gage 8 and gage 9, the SPH result agrees very well with the experiment while the Tunami-N2 wave height decreases drastically. We can see in Fig. 7 that, the wave is very steep when it is passing by gage 7. High non-linearity evolution of the steep wave front is captured in the SPH but not in the Tunami-N2; which could be attributed to the sharp reduction of wave height in the Tunami-N2 simula-tion. At gage 10, the wave height recorded in the experiment decreases remarkably while that of the SPH simulation does not. This could be because the wave breaking may occur in the experiment somewhere in between gage 9 and gage 10
but not occur in the SPH simulation. As we could see from the simulation results in Fig. 6, when the wave approaches the wall the wave front is steepening but no breaking is ob-served (Fig. 6a, b). The wave directly impacts on the wall creating a water jet shooting upwards that can reach more than three times of the still water depth (Fig. 6c).
The SPH simulation also captures well the reflected wave (the second peak in the time series). At gage 10, the reflected wave recorded in the experiment is significantly lower than that in the SPH simulation. It could be because the incident wave in the experiment already broke before hitting the wall (as discussed above). The experimental and SPH time histo-ries at gage 9 show that the reflected wave could be steepened and break again. The reflected wave in Tunami-N2 is signif-icantly lower than that in the experiment. Overall, the SPH performs much better than Tunami-N2 in case B where the wave is very steep and breaking possibly takes place.
3.5 Numerical simulation of case C
Fig. 6. Snapshots of SPH results (case B) of wave approach and impact on the wall and pressure distribution at time instances (a) 17.6 s, (b) 17.7 s, (c) 17.85 s.
Fig. 7. Comparisons of time histories of wave height obtained from the experiment and numerical simulations at gages 5–10 of case B.
readers could refer to Dao (2010) for the discussions on wave breaking.
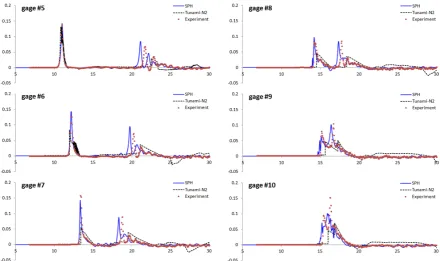
Comparisons of time histories of wave height recorded at gages 5–10 obtained from the numerical simulations and ex-periment are shown in Fig. 9. At gage 5, both numerical re-sults of incident wave agree well with the experiment. The wave steepens when passing by gages 6 and 7. The SPH sim-ulation captures very well the steepening process while the Tunami-N2 does not. The incident wave heights recorded at these gages from the SPH simulation match well the ex-perimental data, while the Tunami-N2 results show a sud-den drop in wave height after gage 5 due to lack of the
wave-breaking modelling capability. The reduction of wave height could be a result of large numerical dissipation in the simulation when the gradient of the free surface is very large. Wave steepening sometimes causes Tunami-N2 to crash if the time stepping is not small enough. Spurious oscillations may appear at the rear of the wave when it is too steep as seen at gages 5 and 6.
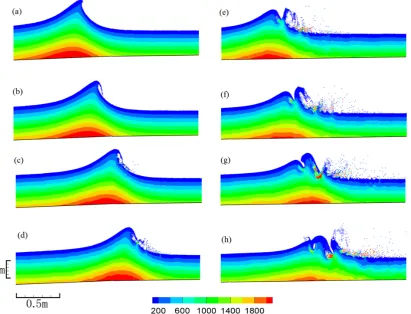
Fig. 8. Snapshots of SPH results (case C) of wave breaking and pressure distribution at time instances (a) 13.1 s, (b) 13.2 s, (c) 13.3 s, (d) 13.4 s, (e) 13.6 s, (f) 13.7 s, (g) 13.8 s, (h) 13.9 s.
(the second peak in the time series). Tunami-N2 consistently under-predicts both the incident and reflected waves. More-over, due to the predicted lower total water depth, the wave travels slower and arrives later in the Tunami-N2 simulation as compared to that in the experiment and SPH simulation. Overall, Tunami-N2 performs very badly as compared with SPH in case C where wave breaking takes place early.
Snapshots of breaking wave impact on the vertical wall simulated by SPH are shown in Fig. 10. The solitary wave breaks at the second slope from the left and continues to propagate forward to the wall on the right. The wave front is composed by water sprays splashing forwards instead of a sharp interface (Fig. 10a). The splash of water is approach-ing the wall (Fig. 10b). As the whole breakapproach-ing wave is hit-ting the wall, water splashes upward and the water elevation at the wall increases quickly (Fig. 10c). The main part of the reformed wave impacts on the wall and creates an up-ward water jet. Water surface at the wall continues to rise and the water jet shoots up. The water jet could reach up to 2.5 times of the still water depth (Fig. 10d) before falling and im-pacting on the water surface near the corner (Fig. 10e). Even though the incident wave is almost double that of case B, the ratio of maximum run-up height over the still water depth is
lower. This could be attributed to the large amount of wave momentum that was dissipated through the breaking before the wave hits the wall.
Figures 8 and 10 show the occurrence of some fragmenta-tion of the free surface after the breaking events. This frag-mentation of free surface is mainly due to lack of air resis-tance and incomplete kernel operation at the free surface in the single-phase SPH simulation. The inclusion of air parti-cles in two-phase simulation would significantly improve the result (Dao, 2010).
3.6 Impact pressure on wall
Fig. 9. Comparisons of time histories of wave height obtained from the experiment and numerical simulations at gages 5–10 of case C.
impact area. Impact pressures of a breaking wave on to a vertical wall have been successfully modelled by the SPH program developed by the authors. The SPH was able to ac-curately reproduce the magnitudes of the impact pressures and shapes of pressure evolutions observed in the Lugni et al. (2006) experiments (Xu, 2013).
In the SPH simulations of the solitary waves in this study, the numerical pressure sensor is located on the wall at the initial still water level. The recorded pressure is normalized to the maximum hydrostatic pressure due to incident wave run-up at the wall,ρghwmax. The results of impact pressures
for the three cases are shown in Fig. 11 together with the hydrostatic pressure estimated from incident wave run-up at the wall,ρghw(Fig. 11a).
When the wave hits the wall and reflects, the pressure mea-sured in case A shows a gradual increase and then decrease. The peak pressure is approximately ρghwmax. This is,
in-deed, mostly contributed by the increase of static pressure which is characterized by the increase and decrease of water level at the wall. The normalized impact pressure before and after the wave has hit the wall is non-zero due to the increase of water level resulting from particle disorder in SPH (as dis-cussed above). In case B and case C, impact pressure is char-acterized by sharp rises of 2 peaks and significant oscilla-tions. Case B shows a typical flip-through wave impact. The second peak impact pressure in this case is approximately 1.5ρghwmaxand occurs after the peak hydrostatic pressure.
The normalized impact pressure is less than 1 at the time of peak hydrostatic pressure and approximately 0.5 during the
rising period of hydrostatic pressure; which indicates the es-timation of hydrostatic pressure based on rising water level at the wall and gravitational acceleration might be not ade-quate. That could be explained as the water jet at the wall is significantly accelerating upwards, resulting in lower to-tal downward acceleration and hence lower static pressure. The second peak is explained by the falling to the water jet. Case C characterizes a different impact as the reformed bro-ken wave and water splash impact the wall. There is no strong upward shooting jet as observed in case B. The drop of es-timated hydrostatic pressure after the first peak (Fig. 11) is probably due to the fragmentation of water splashing on the wall, making the estimation of water level inaccurate. The peak impact pressure of case C reaches 5.5 ρghwmax. The
magnitude of the peak impact pressures of case C is close to the observation (3–6 times) by Lugni et al. (2006).
4 Conclusions
Fig. 10. Snapshots of SPH results (case C) of breaking wave impact on the wall and pressure distribution at time instances (a) 15.0 s, (b) 15.2 s, (c) 15.4 s, (d) 15.6 s, (e) 15.8 s, (f) 15.9 s.
Fig. 11. Pressure time histories due to wave impact on the wall (obtained from the SPH simulations): (a) hydrostatic pressure es-timated from wave run-up height on wall, (b) impact pressure.
The study also highlighted that neglecting or using an in-adequate numerical scheme for the approximation of break-ing waves could lead to significant under-predictions of run-up height and impact pressure on coastal structures.
The SPH method outperforms traditional gridded methods in simulating breaking surface waves due to several advan-tages. Firstly, the method discretizes governing equations in Lagrangian form, leading to several benefits: surface tracking is not necessary; the advection term can be treated exactly by tracking the movement of the particles; and numerical
diffusion due to grid discretization can be avoided. Secondly, because the computation elements are based on the particles, the air–water multiphase flow could be modelled easily. Fur-thermore, the SPH method is based on the interaction be-tween particles, hence the continuum, coalescence and frag-mentation of the materials could be treated in a natural way.
Acknowledgements. The research described in this publication was supported by the Singapore National Research Foundation (NRF) through the Singapore-MIT Alliance for Research and Technology (SMART), Center for Environmental Sensing and Modeling (CENSAM). The authors also thank the Department of Civil and Environmental Engineering, National University of Singapore, for providing computational resources.
Edited by: I. Didenkulova
Reviewed by: S. Venkatachalam and one anonymous referee
References
Batchelor, G. K.: An introduction to fluid dynamics, Cambridge University Press, United Kingdom, 1967.
Bonet, J. and Kulasegaram, S.: Correction and stabilization of smooth particle hydrodynamics methods with applications in metal forming simulations, Int. J. Numer. Meth. Eng., 47, 1189– 1214, 2000.
Briggs, M. J., Synolakis, C. E., Harkins, G., and Green, D. R. Benchmark Problem #3: Runup of Solitary Waves on a Verti-cal Wall, Long-Wave Runup Models, International Workshop on Long Wave Modeling of Tsunami Runup, Friday Harbor, San Juan Island, WA, 12–17 September, 1995.
Chan, E. S.: Mechanics of deep water plunging-wave impacts on vertical structures, Coast. Eng., 22, 115–133, 1994.
Chan, E. S. and Melville, W. K.: Deep-water plunging wave pres-sures on a vertical plane wall, P. Roy. Soc. Lond. A Mat., 417, 95–131, 1988.
Chan, E. S., Cheong, H. F., and Gin, K. Y. H.: Breaking-wave loads on vertical walls suspended above mean sea level, J. Waterway Port. Coast. Ocean Eng., 121, 195–202, 1995.
Colagrossi, A. and Landrini, M.: Numerical simulation of inter-facial flows by smoothed particle hydrodynamics, J. Comput. Phys., 191, 448–475, 2003.
Dalrymple, R. A. and Rogers, B. D.: Numerical modeling of water waves with the SPH method, Coast. Eng., 53, 141–147, 2006. Dao, M. H.: Numerical study of plunging wave in deep water, Ph.D.
thesis, Civil Engineering, National University of Singapore, Sin-gapore, 2010.
Dao, M. H. and Tkalich, P.: Tsunami propagation modelling – a sensitivity study, Nat. Hazards Earth Syst. Sci., 7, 741–754, doi:10.5194/nhess-7-741-2007, 2007.
Dao, M. H., Tkalich, P., and Chan, E. S.: Tsunami forecasting using proper orthogonal decomposition method, J. Geophys. Res., 113, C06019, doi:10.1029/2007JC004583, 2008.
Dao, M. H., Xu, H., Chan, E. S., and Tkalich, P.: Numerical mod-elling of extreme waves by Smoothed Particle Hydrodynamics, Nat. Hazards Earth Syst. Sci., 11, 419–429, doi:10.5194/nhess-11-419-2011, 2011.
Dommermuth, D. G, Yue, D. K. P., Lin, W. M., Rapp, R. J., Chan, E. S., and Melville, W. K.: Deep water plunging breakers a compar-ison between potential theory and experiments, J. Fluid. Mech., 189, 423–442, 1988.
Gingold, R. A. and Monaghan, J. J.: Smoothed particle hydrody-namics: theory and application to non-spherical stars, Mon. Not. R. Astron. Soc., 181, 375-389, 1977.
Gomez-Gesteira, M., Cerqueiroa, D., Crespoa, C., and Dalrymple, R. A.: Green water overtopping analyzed with a SPH model, Ocean Eng., 32, 223–238, 2005.
Goto, C., Ogawa, Y., Shuto, N., and Imamura, F.: Numerical method of tsunami simulation with the leap-frog scheme (IUGG/IOC Time Project), IOC Manual, UNESCO, No. 35, Paris, France, 1997.
Grilli, S. T., Svendsen, I. A., and Subramanya, R.: Breaking crite-rion and characteristics for solitary waves on slopes, J. Waterway Port. Coast. Ocean. Eng., 123, 102–112, 1997.
Hughes, S. A.: Physical models and laboratory techniques in coastal engineering, World Scientific, London, United Kingdom, 1993. Khayyer, A., Gotoh, H., and Shao, S. D.: Corrected
incompress-ible SPH method for accurate water-surface tracking in breaking waves, Coast. Eng., 55, 236–250, 2008.
Kim, S. K., Liu, P. L. F., and Liggett, J. A.: Boundary integral-equation solutions for solitary wave generation, propagation and run-up, Coast. Eng., 7, 299–317, 1983.
Li, Y. and Raichlen, F.: Energy balance model for breaking solitary wave runup, J. Waterway Port. Coast. Ocean Eng., 129, 47–59, 2003.
Liu, M. B. and Liu, G. R.: Restoring particle consistency in smoothed particle hydrodynamics, Appl. Numer. Math., 56, 19– 36, 2006.
Liu, P. L. F., Cho, Y. S., Briggs, M. J., Kanoglu, U., and Syno-lakis, C. E.: Runup of solitary waves on a circular island, J. Fluid Mech., 302, 259–285, 1995.
Lucy, L. B.: Numerical approach to testing the fission hypothesis, Astron. J., 82, 1013–1024, 1977.
Lugni, C., Brocchini, M., and Faltinsen, O. M.: Wave impact loads: The role of the flip-through, Phys. Fluids, 18, 122101, doi:10.1063/1.2399077, 2006.
Maiti, S. and Sen, D.: Computation of solitary waves during propa-gation and runup on a slope, Ocean Eng., 26, 1063–1083, 1999. Mimura, N., Yasuhara, K., Kawagoe, S., Yokoki, H., and Kazama,
S.: Damage from the Great East Japan Earthquake and Tsunami – A quick report, Mitig. Adapt. Strateg. Glob. Change, 16, 803– 818, doi:10.1007/s11027-011-9297-7, 2011.
Oger, G., Doring, M., Alessandrini, B., and Ferrant, P.: An im-proved SPH method: Towards higher order convergence, J. Com-put. Phys., 225, 1472–1492, 2007.
Shuto, N. and Goto, C.: Numerical simulations of the transoceanic propagation of tsunamis, In: Sixth Congress Asian and Pacific Regional Division. International Association for Hydraulic Re-search, Kyoto, Japan, 20–22 July, 1988.
Shuto, N., Goto, C., and Imamura, F.: Numerical simulation as a means of warning for near-field tsunami, Coast. Eng. Jpn., 33, 173–193, 1990.
Titov, V. V. and Synolakis, C. E.: Numerical modeling of tidal wave runup. J. Waterway, Port, Coastal, Ocean Eng., 124, 157–171, 1998.
Tkalich, P. and Dao, M. H.: Tsunami Modelling and Forecasting Techniques Environmental Hazards, in: The Fluid Dynamics and Geophysics of Extreme Events, Lecture Notes Series, edited by: Moffatt, K. and Shuckburgh, E., Institute for Mathematical Sci-ences, National University of Singapore, 21, World Scientific, ISBN: 978-981-4313-28-5, 269–294, 2011.
eqinthenews/2011/usc0001xgp/usc0001xgp.php, page last mod-ified: 27 October 2012, last access: 4 December 2012.
Vidal, Y., Bonet, J., and Huerta, A.: Stabilized updated Lagrangian corrected SPH for explicit dynamic problems, Int. J. Numer. Meth. Eng., 69, 2687–2710, 2007.
Xu, H.: Numercial Simulation of breaking wave impact on struc-tures, Ph.D. thesis, Civil Engineering, National University of Sin-gapore, SinSin-gapore, in press, 2013.
Xu, H., Dao, M. H., and Chan, E. S.: An SPH model with C1 con-sistency, edited by: Rogers, B. D., 5th Internetional SPHERIC Workshop, Manchester, 2010.