ISSN (e): 2250-3021, ISSN (p): 2278-8719
Vol. 08, Issue 8 (August. 2018), ||V (IV) || 68-77
Development of ANN Model for Analysis of Response Parameters
of Wire Cut EDM for EN-47 Spring Steel
Rohit Jangid
1, Deepak Agrawal
21
M.Tech, Mechanical Engineering (Production), Sri Balaji College Of Engineering & Technology, Jaipur, Rajasthan
2Assistant Professor, Mechanical Engineering, Sri Balaji College Of Engineering & Technology, Jaipur,
Rajasthan
Abstract: -
This paper presents the development of an artificial neural network model that predicts wire cut EDM response parameters. Pulse on time, pulse off time, current and servo voltage have been taken as control parameters. Design of experiment has prepared by using taguchi L16 orthogonal array. Dimensional deviationand surface roughness have been taken as response parameters, these parameters represents the dimensional accuracy and surface quality of EN-47 spring steel part, machined through wire cut EDM process. Process parameters, machining conditions, tool material are the factors that affect product quality. Better understanding of these factors reduces material wastage, machining cost, machining time and improves product quality and productivity.
Keywords: -
Artificial neural network, dimensional deviation, EN-47, surface roughness, wire cut EDM. --- --- Date of Submission: 06-08-2018 Date of acceptance: 23-08-2018 --- ---I.
INTRODUCTION
Electro discharge machining (EDM) is a popular non-traditional material removal process. Lower cutting forces, mechanical vibrations are appeared during electro discharge machining process and effects of the material’ s hardness are regardless. EDM process is an optimal solution in order to machine super alloys, composites materials which have low machinability & high hardness. [1]
Fig. 1 Setup of EDM [1]
EDM is based on the principle of spark erosion. Spark are continuously generated between electrode and work-piece. Electrical discharges produce erosive effect and material is removed from tool and work piece. Three types of electro discharge machining processes are most popular in manufacturing industries.
a) Die-sinking EDM
b) Hole drilling EDM
Hole drilling EDM is based on spark erosion principle and famed for small holes drilling, micro holes are drilled by using a hollow electrode. This type of EDM having different names such as start hole drill EDM, hole popper EDM. [2]
c) Wire cut EDM (WEDM)
In 1770’ s Joseph Priestly an English scientist explored that the electrical discharge is able to destruct metal because of erosion. Soviet scientists use a wire as an electrode and developed first Wire EDM which is commercially available in 1967. After that Andrew Engineering, a company of united state used CNC drawing plotter & optical line follower techniques and developed 1st CNC wire cut EDM in 1976. [3]
(a) (b) (c)
Fig. 2 (a) Die-sinking EDM process (b) Hole drilling EDM process (c) Wire cut EDM process [2]
WEDM is very popular in manufacturing industries and its demand is increasing day by day because of its uses like manufacturing of molds, tools, dies and aerospace, automobile, pharmaceutical components etc. This process has the ability to cut complex shapes and easy machining of hard materials. Wire cut EDM process offers higher dimensional accuracy with best surface quality outputs.
1.1 Principle of wire cut EDM
Wire cut EDM works on the principle of thermal erosion which is also known as thermoelectric effect. When electric current passes through electrode wire & work piece which are immersed in a dielectric fluid then thermoelectric energy is formed between them. Due to this energy sparks are generated in a small gap (Gap in the middle of wire and work piece) which is known as spark gap. The dielectric fluid is also filled in this spark gap and act as insulating medium. Because of high temperature material is removed from both work piece & electrode.
Fig. 3 Principle of wire cut EDM [4]
1.2 Wire Cut EDM Process Parameters a) Pulse on Time
Time period in which current is allowed to flow in the middle of wire and work-piece is known as pulse on time (Ton), it is measured in μs. At this time duration electrical discharge arises between electrode wire
b) Pulse off Time
Time duration in the middle of two continuous sparks known as pulse off time. It is denoted by Toff and
measured in μs. During this time voltage supply is stopped, low value of pulse off time causes wire breakage, and reduces cutting efficiency.
c) Peak Current
The maximum current allowed to flow between wire & work-piece. It is represented by IP and
measured in A (ampere). Mostly low value of peak current is preferred because it’ s high value increase power consumption and reduces surface quality of work-piece. [5]
d) Servo Voltage
This voltage controls the movement of wire and maintains very small space between wire and work-piece. It highly affects accuracy of machining. It is denoted by Sv and measured in volts. Low value of this
voltage increases spark generation during machining.
e) Wire Feed Rate
The speed at which the wire moves during cutting operation is known as wire feed rate. Higher the wire feed rate tends to higher the surface roughness, tool wear rate and power consumption during wire cut process. Wire feed rate measured in m/min, a small feed rate is the reason of wire breakage.
f) Wire Tension
Axial force applied on both sides of wire is known as wire tension. It is measured in newton. If wire tension is more than tensile strength of electrode wire then it causes wire breakage. If wire tension increases then accuracy & cutting speed also increases. At lower wire tension, electrode wire vibrates during cutting operation and decreases surface finishing.
g) Dielectric Flow Rate
The speed at which dielectric fluid circulates is known as dielectric flow rate. It is measured in liter/min. Increase in flow rate improves surface finish and dimensional accuracy. But over a limit this reduces material removal rate. [6]
h) Surface Roughness
This is the most significant output parameter of wire cut EDM process. It is a measurement of surface quality. Irregularities appear on machined surface are measured in the form of surface roughness. It is measured in µm.
i) Dimensional Deviation
Dimensional accuracy measures in terms of dimensional deviation (Dd). The difference in the middle of
actual profile traced by the wire and the required job profile is termed as dimensional deviation. It is measured in µm.
D
a
D
d
0
.
5
(1)Where
D = Required dimension of work piece
a = Real dimension of work-piece after cutting. [7]
j) Material Removal Rate
Rate at which material has been removed from work piece surface is known as material removal rate (MRR). Higher material removal rate offers high productivity.
t
MRR
W
iW
f (2)Where
Wi = Work-piece weight before cutting operation.
Wf = Work-piece weight after cutting operation.
t = Cutting time
ρ = work-piece material density. [6]
Rate at which material has been removed from surface of electrode wire is known as tool wear rate (TWR). Higher tool wear rate is the reason of high machining cost and more consumption of power and electrode wire.
t
TWR
W
tb
W
ta(3)
Where
Wtb = Wire weight before cutting
Wta = Wire weight after cutting
t = Cutting time [6]
II.
ARTIFICIAL NEURAL NETWORK
Some processing elements called artificial neurons are interconnected with each other and make a network called artificial neural network. Basically artificial neural network is a set of programming codes which is inspired by biological nervous systems. The Artificial Neural Network processes the information in the same manner as the human brain.
The biological nervous system consists of for parts called Dendrites (this part of nervous system receives all information), Cell body (process the complete information), Axon (convert all input signals into output signals) and the last one is Synapses (connections between neurons).
Fig. 4 biological neuron [8]
All artificial neurons available in the network are connected with each other through connections. High strength of connections gives more accurate results. All these connections are characterized through weights. Weight is a numerical value lie in a specific range.
Inputs are multiplied with their weights then summation function generates total input of the network. A bias is another input added in the network whose value is always equal to 1. During training of network weight and bias are changes continuously in order to find out optimum results with high accuracy.
Fig. 5 An artificial neuron [9]
Mathematically artificial neuron is expressed as follows:
X
W
u
jm
j kj
k
1 (4)And
u
b
y
k
k
k (5)x1, x2,……., xm = Input signals
wk1, wk2 ,…….., wkm = Weights
uk = Total input in a neuron
bk = Bias
φ = Transfer function yk = Output of neuron. [9]
Transfer function is used to convert input signals into output signals or we can say transfer function provides output of a neural network. Transfer function is also known as activation function, it compresses the range of output signals at a certain limit. Sigmoid and linear transfer functions are commonly used in training of artificial neural network.
Fig. 6 Types of transfer function [10] Artificial neural networks are divided in two categories.
a) Feed-forward Network
In Feed-forward network initially the data is processed in input neurons after that in output neurons. Feed-forward network does not have any feedback connections and no records of earlier outputs are stored into it.
b) Feedback Network
In this type of networks additional feedback connection from output neurons to input neurons are available and extra weights are adopted. Current results are depending on previous outputs.
Fig. 7 Types of artificial neural network [8]
2.1 Training of Artificial Neural Network
Initially values of weights and bias are set from a range -1 to 1 when tan-sigmoid function is used or 0 to 1 if log-sigmoid function is used for training of network. Submission function calculates total input.
X
W
u
jm
j kj
k
1 (6)Activation function generates network output.
u
b
y
k
k
k (7)By using mean square error function network calculates the difference between experimental output and predicted outputs.
ni
y
i
y
pred
i
n
MSE
12
,
exp,
1
(8)
Where
n = Number of data points yexp,i = Experimental values
ypred,i = Predicted values [11]
Backpropagation algorithm is used to update the weights.
w
w
w
j j
j
E
(9)Where
= Learning ratew
jE
= Partial derivative
This process is continuing till the difference between given output and predicted output is not minimal. [12]
2.2 Artificial Neural Network Learning Strategies
Artificial neural network learns with the help of several learning strategies which are supervised learning, unsupervised Learning and reinforcement learning. By using these strategies network learn how input and target datasets are related with each other and what similarities, interactions and patterns they have. Learning algorithm calculates, changes in weights how much affect the network outputs. [13]
a) Supervised learning
Network collects input and target datasets then make several computations and finally predict the outputs. With the use of error function the difference between given outputs and predicted outputs are observed, weight and bias change continuously as long as the difference between given outputs and predicted outputs is not minimal.
b) Unsupervised learning
Fig. 8 Types of learning [12]
c) Reinforcement learning
An ANN with this learning strategy was able to detect repetition, interactions and make decision for their next step. An algorithm under reinforcement learning helps the network to learn new things. Network observes many conditions for solving several specific problems. [14]
III. DESIGN
OF
EXPERIMENT
In this work EN-47 spring steel has been machined through wire cut EDM process and also developed an artificial neural network model for analysis of response parameters (dimensional deviation and surface roughness). This material is widely used for automobile, aerospace & pharmaceuticals components. Other than this it is also used in oil, gas and chemical industries. This spring steel having high tensile strength, hardness, corrosion resistance and good bending & forming properties which are the basic requirements of manufacturing industry. The industrial applications of EN-47 spring steel are gear manufacturing, Leaf spring, train Shockers, crankshafts, steering, spindles, pumps etc.
Table.1 Chemical composition of EN-47 spring steel
Elements %
C 0.393
Mn 0.566
Si 0.239
Ni 0.387
Mo 0.185
Cu 0.0713
V 0.0218
Al 0.0242
B 0.0023
Minitab-17 software has been used to for design of experiment. Taguchi L16 orthogonal array provided
best combinations of control factor levels for pulse on time, pulse off time, current and servo voltage.
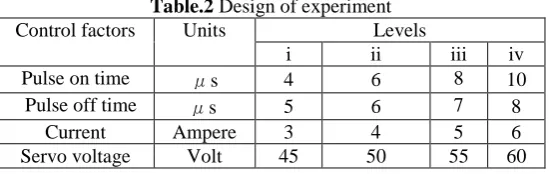
Table.2 Design of experiment Control factors Units Levels
i ii iii iv Pulse on time μs 4 6 8 10 Pulse off time μs 5 6 7 8
Current Ampere 3 4 5 6
Servo voltage Volt 45 50 55 60
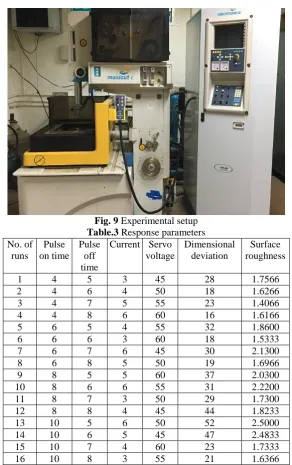
Fig. 9 Experimental setup Table.3 Response parameters No. of
runs
Pulse on time
Pulse off time
Current Servo voltage
Dimensional deviation
Surface roughness
1 4 5 3 45 28 1.7566
2 4 6 4 50 18 1.6266
3 4 7 5 55 23 1.4066
4 4 8 6 60 16 1.6166
5 6 5 4 55 32 1.8600
6 6 6 3 60 18 1.5333
7 6 7 6 45 30 2.1300
8 6 8 5 50 19 1.6966
9 8 5 5 60 37 2.0300
10 8 6 6 55 31 2.2200
11 8 7 3 50 29 1.7300
12 8 8 4 45 44 1.8233
13 10 5 6 50 52 2.5000
14 10 6 5 45 47 2.4833
15 10 7 4 60 23 1.7333
16 10 8 3 55 21 1.6366
Analyses of experimental outputs show that pulse on time and servo voltage highly affects the dimensional deviation. Current and pulse off time also produced minor effect on dimensional deviation. For surface roughness pulse on time and current are the most effective parameters.
IV. DEVELOPMENT
OF
ARTIFICIAL
NEURAL
NETWORK
MODEL
The artificial neural network model has been developed for analysis of response parameters. Network has been trained by using experimental data. The experimental data has been divided in two categories, input dataset and target dataset. From experimental data set 70% data is taken for training, 15% for testing and 15% for validation. A neural network of feed forward back-propagation type selected and trained with logsigmoid transfer function, mean square error function and levenberg-marquardt algorithm. Number of neurons has been selected among the range of 1 to 20 neurons, network performance was good in this range. At last 4-14-14-2 architecture has been finalized.
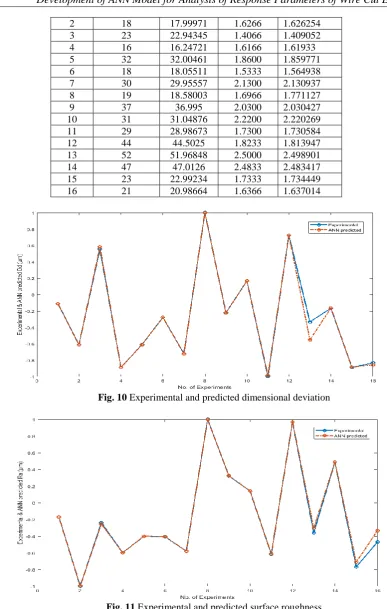
Table.4 Experimental and predicted response parameters No. of
runs
Expt. dimensional
deviation
Predicted dimensiona
l deviation
Expt. Surface roughness
2 18 17.99971 1.6266 1.626254 3 23 22.94345 1.4066 1.409052 4 16 16.24721 1.6166 1.61933 5 32 32.00461 1.8600 1.859771 6 18 18.05511 1.5333 1.564938 7 30 29.95557 2.1300 2.130937 8 19 18.58003 1.6966 1.771127 9 37 36.995 2.0300 2.030427 10 31 31.04876 2.2200 2.220269 11 29 28.98673 1.7300 1.730584 12 44 44.5025 1.8233 1.813947 13 52 51.96848 2.5000 2.498901 14 47 47.0126 2.4833 2.483417 15 23 22.99234 1.7333 1.734449 16 21 20.98664 1.6366 1.637014
Fig. 10 Experimental and predicted dimensional deviation
Fig. 11 Experimental and predicted surface roughness
Results of artificial neural network model show that network accurately predicted the response parameters of wire cut EDM process which are very close to experimental outputs.
V.
CONCLUSION
Experimental work show that pulse on time and servo voltage highly affected the dimensional deviation. For surface roughness pulse on time and current are the most effective parameters. Performance of wire cut EDM process depends on selection of input process parameters, machining conditions, electrode wire etc. The developed artificial neural network (ANN) model accurately predicted the response parameters. Selection of feed forward back-propagation type network, logsigmoid transfer function, mean square error function and levenberg-marquardt algorithm provide optimum results.
REFERENCES
[1]. Priyesh N. Santoki, Prof. Ashwin P. Bhabhor, A review - Status of recent developments & effect of machining parameters on performance parameters in EDM, International Journal of Innovative and Emerging Research in Engineering, 2(1), 2015.
[2]. C. Sommer and S. Sommer, Complete EDM Handbook, 23-31.
[3]. Kumar Sandeep, Current research trends in electrical discharge machining: a review, Research Journal of Engineering Sciences, 2(2), 2013, 56-60.
[4]. Foroogh Hosseinzadeh, P . J. Bouchard, Towards good practice guidelines for the contour method of residual stress measurement, Journal of Engineering, 2014, 1-16.
[5]. Jaskarn Singh, Mr. Rishavraj Singh, Review on effects of process parameters in wire cut EDM and wire electrode development, International Journal for Innovative Research in Science & Technology, 2(11), 2016, 701-706.
[6]. Daud B Attar, Unmesh S pawar, An overview of electro discharge machining” , International Research Journal of Engineering and Technology, 4(5), 2017, 131-137.
[7]. Mohinder P. Garg, Ajai Jain, Gian Bhushan, An investigation into dimensional deviation induced by wire electric discharge machining of high temperature titanium alloy, Journal of Engineering and Technology, 2(2), 2012.
[8]. Tripti Rani Borah, Kandarpa Kumar Sarma and Pranhari Talukdar, biometric identification system using neuro and fuzzy computational approaches” in IGI Global book series Advances in Computational Intelligence and Robotics, Handbook of research on emerging perspectives in intelligent pattern recognition, analysis, and image processing (United States of America: Information Science Reference,1967) 335-366.
[9]. Erdi Tosun, Kadir Aydin, Mehmet Bilgili, Comparison of linear regression and artificial neural network model of a diesel engine fueled with biodiesel-alcohol mixtures, Alexandria Engineering Journal, 2016, 3081–3089.
[10]. Pichai Janmaneea and Sanya Kumjingb, A study of tungsten carbide surfaces during the electrical discharge machining using artificial neural network model, International Journal of Applied Engineering Research, 12(12), 2017, 3214-3227.
[11]. Juan Jose Garcia a, Franklin Garcia, José Bermúdez , Luiz Machado, Prediction of pressure drop during evaporation of R407C in horizontal tubes using artificial neural networks, International Journal of Refrigeration, 2017, 292–302.
[12]. Shouyi Wang, Wanpracha Chaovalitwongse, Robert Babuska, Machine learning algorithms in bipedal robot control, Article in IEEE Transactions on Systems Man and Cybernetics Part C (Applications and Reviews), 42(5), 2012, 728-743.
[13]. Sakshi Kohli, Surbhi Miglani, Rahul Rapariya, Basics of artificial neural network” International Journal of Computer Science and Mobile Computing, 3(9), 2014, 745-751.
![Fig. 1 Setup of EDM [1]](https://thumb-us.123doks.com/thumbv2/123dok_us/7809458.1662404/1.595.155.437.481.640/fig-setup-of-edm.webp)
![Fig. 2 (a) Die-sinking EDM process (b) Hole drilling EDM process (c) Wire cut EDM process [2]](https://thumb-us.123doks.com/thumbv2/123dok_us/7809458.1662404/2.595.192.402.529.685/fig-sinking-process-hole-drilling-process-wire-process.webp)
![Fig. 5 An artificial neuron [9]](https://thumb-us.123doks.com/thumbv2/123dok_us/7809458.1662404/4.595.200.398.535.635/fig-an-artificial-neuron.webp)
![Fig. 6 Types of transfer function [10] Artificial neural networks are divided in two categories](https://thumb-us.123doks.com/thumbv2/123dok_us/7809458.1662404/5.595.122.469.535.678/types-transfer-function-artificial-neural-networks-divided-categories.webp)