ISSN (e): 2250-3021, ISSN (p): 2278-8719
Vol. 08, Issue 11 (November. 2018), ||V (III) || PP 01-07
Performance Analysis of Multilevel Classifiers for Feature
Reduced Intrusion Detection
Dharmendra Kumar
1, Ravi Singh Pippal
2 1(Research Scholar, RKDF University, Bhopal) 2(Professor, Vedica Institute of Technology, RKDF University, Bhopal) Corresponding Author:Dharmendra Kumar
Abstract:
-
The rapid growth of Internet technologies and networks has led to a significant increase in attacks and intrusions. The detection and prevention of these attacks has become an important element for security. One of the important way to achieve security is to design intrusion detection to analyse and various attacks. Intrusion detection systems have a dimensionality defect that tends to increase temporal complexity and reduce the use of resources. Therefore, it is desirable that the important data features be analysed by an intrusion detection system in order to reduce dimensionality. In this paper co-relation coefficient, particle swarm optimization and genetic algorithm based feature reduction technique is used. These reduced features are then fed to multilevel classifiers for training and testing on KDD99 dataset. Comparison of these three feature reduction technique is performed and result is shown with respect to detection rate and false alarm rate metrics.Keywords: -
Intrusion Detection, Feature Reduction, Correlation, Particle Swarm Optimization, Genetic Algorithm, Multilevel Classifiers--- --- Date of Submission: 11-11-2018 Date of acceptance: 23-11-2018 --- ---
I.
INTRODUCTION
In today‟s modern computer era intrusion occurs in network in each and every fraction of time. Intrusion occurs with a motive to steal data or to change some useful information from network log data. Intrusion detection system can rationally distinguish between normal and intrusive records. Most existing systems have vulnerabilities that make them vulnerable and untreatable. In addition, intrusion detection technology, which is still considered immature and not a perfect tool against intrusion, has done important research. For network administrators and security experts, this becomes a priority and difficult task. Thus, it can not be replaced by safer systems. The data mining-based IDS can effectively identify data of interest to the user and also predict the results that can be used in the future.
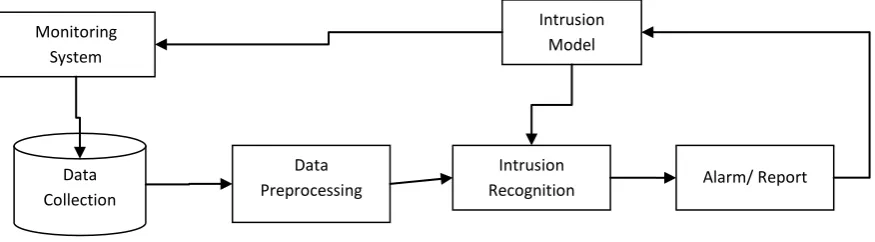
Figure 1: Intrusion Detection System
Fig. 1 illustrates the architecture of IDS. It has been centrally located to capture all incoming packets transmitted on the network. Data is collected and sent to pre-processing to eliminate noise; Irrelevant and missing attributes are overwritten. Thus, the pre-processed data are analysed and classified according to their severity. If the registration is normal, it does not require further changes or sends the report to activate the alerts. Alarms are triggered based on data status so the administrator can handle the situation in advance. The attack is modelled to allow classification of network data. The whole process above will continue as soon as the transfer starts.
Intrusion Model
Data Preprocessing
Intrusion
Recognition Alarm/ Report Data
International organization of Scientific Research
2 | Page
IDS must be sufficiently accurate and adaptable to counteract attacks by intruders. The IDS distinguish between legitimate and illegitimate users and must be used with the first line of defence to prevent intrusions and aberrations both internally and externally.The classification and selection of features is an important perspective in intrusion detection systems for better performance. Entity classification and feature selection methods are useful to answer the question about the importance of entities in a data set and to classify them into larger or smaller entities. These features help classify network traffic in normal or abnormal (attack) classes. However, features that contribute marginally or unusual to the detection of various types of attacks must be removed to improve the accuracy and speed of intrusion detection systems. The removal of these features will improve the performance of the IDS in terms of calculation, reduction of dimensionality and temporal complexity.
II.
RELATED
WORK
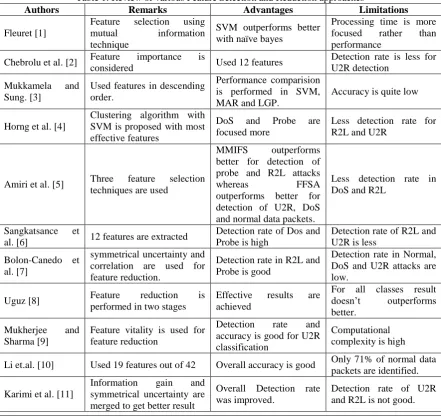
The intrusion detection system has dimensionality problem i.e. large data sets that simulate real network data increase the complexity of training and testing time in IDS. Large amounts of data also determine resource consumption and can affect detection stability. This leads to the development of an effective extraction and downsizing strategy that not only can help reduce training time, but also provide greater accuracy and protection from unknown attacks. Feature selection reduces computer complexity, information redundancy, increases the accuracy of the learning algorithm, facilitates data comprehension and improves generalization. The methods for selecting and classifying functionalities are divided into two types: packaging methods and filtering methods. Filtering methods use predefined criteria to select entities in the dataset and delete irrelevant entities. Wrapper methods, on the other hand, are based on training data to evaluate feature. Some of the contributions in the feature reduction process is discussed below in table 1.
Table 1: Review of various Feature Selection and Reduction approaches
Authors Remarks Advantages Limitations
Fleuret [1]
Feature selection using mutual information technique
SVM outperforms better with naïve bayes
Processing time is more focused rather than performance
Chebrolu et al. [2] Feature importance is
considered Used 12 features
Detection rate is less for U2R detection
Mukkamela and Sung. [3]
Used features in descending order.
Performance comparision is performed in SVM, MAR and LGP.
Accuracy is quite low
Horng et al. [4]
Clustering algorithm with SVM is proposed with most effective features
DoS and Probe are focused more
Less detection rate for R2L and U2R
Amiri et al. [5] Three feature selection techniques are used
MMIFS outperforms better for detection of probe and R2L attacks
whereas FFSA
outperforms better for detection of U2R, DoS and normal data packets.
Less detection rate in DoS and R2L
Sangkatsance et
al. [6] 12 features are extracted
Detection rate of Dos and Probe is high
Detection rate of R2L and U2R is less
Bolon-Canedo et al. [7]
symmetrical uncertainty and correlation are used for feature reduction.
Detection rate in R2L and Probe is good
Detection rate in Normal, DoS and U2R attacks are low.
Uguz [8] Feature reduction is
performed in two stages
Effective results are achieved
For all classes result doesn‟t outperforms better.
Mukherjee and Sharma [9]
Feature vitality is used for feature reduction
Detection rate and accuracy is good for U2R classification
Computational complexity is high
Li et.al. [10] Used 19 features out of 42 Overall accuracy is good Only 71% of normal data packets are identified.
Karimi et al. [11]
Information gain and symmetrical uncertainty are merged to get better result
Overall Detection rate was improved.
Al-Jarrah et al. [12]
Feature weight is identified and lowest feature weight is removed out.
Accuracy rate was increased
Only accuracy rate is focused
Akashdeep et al. [13]
Information gain and correlation feature reduction techniques are merged to find out important features.
DoS accuracy is high
Normal and U2R
accuracy is low.
Computational Overhead due to two feature reduction techniques.
III.
PROPOSED
METHODOLOGY
Followings steps are performed in proposed methodology:
A. Data Selection
The first step involves selection of dataset KDD-99 which consists of five classes:
Normal class
Four are attack classes known as DoS, U2R, R2L and Probe.
Denial of Service (DOS) is the type of attack that denies legitimate users or waits for resources to be exploited by malicious users so that legitimate users cannot use resources or their resource request is denied. Example: Smurf, Neptune, teardrop, back etc.
In Probing, attackers collect all information on computer networks and look for vulnerabilities to launch the attack. Port scanning is one of the main attacks in this category, the others are ip-sweep, saint and nmapetc. In, Remote to local (R2L) attackers attack computer systems so that vulnerabilities are accessible as local users. The attacker attempts to create an account on the victim machine by guessing a password or by attacking. Guess password, multi-hop, phf, spy, Warezclientetc. are examples of R2L attacks.
User to root (U2R) with local access to the operating system of the vulnerability system to obtain the root privileges of a system.Example: buffer overflow, root-kit, land module, Perl etc.
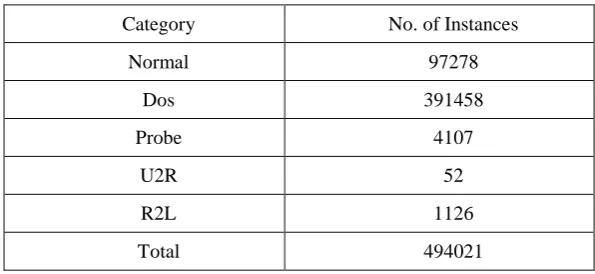
Table 2 illustrates the number of instances of KDD-99 dataset.
Table 2: Number of Instances of KDD-99 Dataset
Category No. of Instances
Normal 97278
Dos 391458
Probe 4107
U2R 52
R2L 1126
Total 494021
B. Data Preprocessing
Data pre-processing was performed manually by deleting the duplicate instances of the KDD-99 dataset and subdividing the instances into different classes. The method starts by removing some redundant instances from the commonly used classes. The result of the preprocessing step provides a compact data set with the elimination of redundancy and imbalance.
C. Data Normalization
After data preprocessing data normalization is performed. Attribute normalization reduces the computational complexity by normalizing the data values between 0 and 1. For this mean range normalization technique is used. Mean range value is calculated as:
Datai=
xi− min(xi)
max xi − min(xi)
(i)
Where , xi = original data of the feature or attribute min(xi)= minimum value of data attribute
max(xi)= maximum value of data attribute
Normally xi is set to zero if the maximum is equal to the minimum.
D. Feature Selection and Reduction
International organization of Scientific Research
4 | Page
complexity by removing irrelevant data. This task is accomplished by using the Particle Swarm Optimization (PSO). In this research work for feature selection Correlation Analysis is performed using Pearson,
Spearman and Kendall coefficients, Particle swarm optimization and genetic algorithm which are discussed below:
1. Co-relation Coefficient Feature Selection and Reduction Pearson Correlation Analysis
Pearson correlation coefficient 𝜌 is calculated by the formula as given below:
𝜌 = 𝐸 𝐴𝐷 − 𝐸 𝐴 𝐸[𝐷]
𝐸 𝐴2 − (𝐸 𝐴 )2 𝐸 𝐷2 − (𝐸 𝐷 )2
(ii)
Where:
A stands for the Attribute Vector D stands for the Decision Vector
E[A] stands for the sum of the elements in A
Spearman Correlation Analysis
Spearman Correlation coefficient 𝜎 is calculated by the formula mentioned below: 𝜎 = 1−(6Σdi
2
)/n(n2 − 1) (iii)
Where,
distands for the difference between the ranks of variables P and Q n stands for the sample size
Kendall Correlation Analysis
Kendall Correlation coefficient 𝜏 is calculated by the formula as given below:
𝜏 =(nc − nd)/(1/2n(n − 1)) (iv)
Where,
distands for the difference between the ranks of variables P and Q n stands for the sample size
After doing Pearson Correlation, Spearman Correlation and Kendall-rank Correlation, we get a list of attributes that satisfy the respective correlation criteria. After obtaining the three individual results which reduces the number of features using Algorithm discussed below:
Attribute Selection after Correlation
procedure ATTRIBUTESELCTION(Dataset) rows ← nrows(Dataset)
cols ← ncols(Dataset)
pearsonVector ← pearson(Dataset) spearmanVector ← spearman(Dataset) kendallVector ← kendall(Dataset) for each i in 1:cols do
ifpearsonVector[i]>0 AND spearmanVector[i]>0 AND kendallVector[i]>0 then Selection ← true
else
Selection ← false end if
end for
return dataset[,Selection] end procedure
2. Particle Swarm Optimization based Feature Selection and Reduction
The basic process of the PSO algorithm is given by:
Step 1: (Initialization) Create random initial particles. For the PSO algorithm, the complete set of entities is represented by a string of length N.
Step 2: (Fitness) Measure the fitness of each particle in the population. This fitness value is used to optimize the result. In this algorithm global minimum to determine fitness function for the accuracy of detection. Step 3: (Update) Calculates the speed of each particle.
Step 4: (Construction) For each particle, move to the next position.
Step 5: (Termination) Stop the algorithm if the termination criterion is satisfied; return to Step 2 otherwise.
PSO Algorithm
For every particle or jobs Initialize jobs
International organization of Scientific Research
5 | Page
For each job
Calculate fitness value
If the fitness value is greater than the best fitness value (pBest) in history Then set current fitness value as the new pBest
End
Choose the job with the best fitness value of all the particles as the gBest For each job
Calculate particle velocity Update job position in queue End
While maximum iterations or minimum error criteria is not attained.
Calculation of fitness function
Each Particle‟s fitness function is calculated using pbest as well as gbest which is best position among entire group of particles.
In each generation velocity and position of each particle is updated using following equation vnew = vold + c1 * r1 * (pbest – present_position) + c2 * r2 * (gbest – present_ position)
present_ position = present position + vold
(9)
Where, v is the particle velocity
Present_position is the current particle (solution) Pbest and gbest are defined as stated before. r1 and r2 is a random number between (0,1). c1, c2 are learning factors.
3. Genetic Algorithm based Feature Selection and Reduction
The Genetic algorithm operates on binary search space as the chromosomes are bit strings. To begin with gemetic algorithm following steps are performed:
Initial Population Selection: Initially, the genetic algorithm begins with a primary population including random chromosomes that consist of genes with a sequence of 0s or 1s.
Evaluate Fitness Function: In genetic algorithm binary chromosome are employed i.e. „1‟ and „0‟. The gene having gene value „1‟ is selected feature whereas „0‟ gene represents that that feature s not selected for evaluation. Out of all features top „n‟ features are selected for next generation.
Selection: In each successive generation, a new population is created by selecting the members of the current generation based on their relevance. Regulators are almost always selected, which leads to a preferred selection of the best solution.
Crossover: The most important step in the production of a new generation is the crossover. To create a new generation, the crossover process selects some individuals as parents in the collection determined by the breed selection process.
E. Intrusion Detection Phase
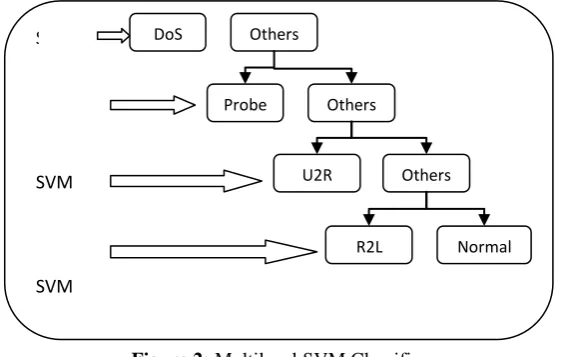
For intrusion detection or classification dataset multilevel classifier is used. In this research work two multilevel classifier performance is analyzed i.e. Multilevel SVM and SVM-ELM-SVM-ELM classifier are used. For Multilevel SVM classifier at all level classifier support vector machine (SVM) algorithm is applied i.e. DOS, Probe, U2R, R2L and Normal are classified using SVM algorithm (as shown in figure 2).
Figure 2: Multilevel SVM Classifier
SVM
SVM
SVM
SVM
DoS Others
Probe Others
Others U2R
International organization of Scientific Research
6 | Page
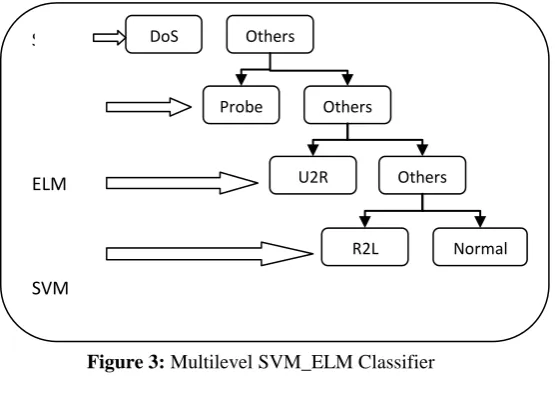
Whereas in Multilevel SVM_ELM at four levels of classifier support vector machine(SVM) and extreme learning machine (ELM) is used alternately i.e. DOS and U2R are classified using SVM as well as Probe and R2L is classified using ELM (as illustrated in figure 3).
Figure 3: Multilevel SVM_ELM Classifier
IV.
RESULT
ANALYSIS
For performance evaluation, multilevel hybrid classifiers are used. The performance evaluation are performed using normalized feature based multilevel classifiers. In this work performance of correlation coefficient feature reduction, particle swarm optimization feature reduction and genetic algorithm feature reduction technique are evaluated with varying number of features. The result analysis is performed on 10 features, 15 features and 20 features. Table 2 and 3 shows the result analysis for detection rate and false alarm rate respectively.
Table I: Performance Analysis of Detection Rate over Feature Reduction Techniques
Techniques
10 Features 15 Features 20 Features
Correlation
Coefficient PSO GA
Correlation
Coefficient PSO GA
Correlation
Coefficient PSO GA Multilevel
SVM Classifier
94.1791 91.2855 93.2219 99.3579 89.6229 96.178 98.707 99.1619 97.88
SVM-ELM-SVM-ELM Multilevel
Classifier
83.6034 86.2045 86.7607 85.9404 82.6314 86.3404 88.7935 92.5735 86.4005
Table 3: Performance Analysis of False Alarm Rate over Feature Reduction Techniques
Techniques
10 Features 15 Features 20 Features
Correlation
Coefficient PSO GA
Correlation
Coefficient PSO GA
Correlation
Coefficient PSO GA Multilevel
SVM Classifier
3.0966 4.3598 4.6957 0.4141 5.2016 1.9204 0.s6514 0.5832 1.0647
SVM- ELM-SVM-ELM
Multilevel Classifier
8.2557 6.9003 8.029 7.0436 8.6979 6.8382 5.6032 3.7206 6.8006
From the result analysis it has been analysed that:
Upto 15 features co-relation co-efficient feature reduction technique outperforms better.
More than 20 features particle swarm optimization feature reduction technique outperforms better.
SVM
ELM
SVM
ELM
Multilevel SVM_ELM
DoS Others
Probe Others
Others U2R
V.
CONCLUSION
This paper proposed intrusion detection system that is based on reduced number of features. The system extracts features using concepts of correlation co-efficient, particle swarm optimization and genetic algorithm. The method uses elimination of redundant and irrelevant data from the dataset as well as normalization in order to improve resource utilization and reduce time complexity. A classification system was designed using multi-level hybrid classification which was trained on KDD99 dataset.From the result analysis it has been analyzed that detection rate and false alarm rate of Multilevel classifier outperforms better with co-relation coefficient feature reduction technique upto 15 features whereas particle swarm optimization outperforms better more than 15 features are considered. So, in future work particle swarm optimization will be proceeded with clustering technique for multilevel hybrid classifier.
REFERENCES
[1]. Fleuret, F., “Fast binary feature selection with conditionalmutual information”,Journal of Machine Learning Research, 5, 1531–1555, 2004.
[2]. Chebrolu, S., Abraham, A. & Thomas, P., “Feature deduction and ensemble design of intrusion detection systems”,Computer and Security, 24 (4), 295–307, 2005.
[3]. Mukkamela, S., & Sung, A. H., “Significant feature selection using computational intelligent techniques for intrusion detection”, Advanced Information and Knowledge Processing, 24, 285–306, 2006.
[4]. Horng, S. J., Su, M.-Y., Chen, Y. H., kao, T. K., Chen, R. J., & Lai, J. L. , “A novel intrusion detection system based on hierarchical clustering and support vector machines”, Expert Systems with Applications, 2010.
[5]. Amiri, F., Yousefi, M. M. R. , Lucas, C. , Shakery, A. , &Yazdani, N., “Mutual information based feature selection for intrusion detection”,Network and Computer Application, 34 , 1184–1199, 2011.
[6]. Sangkatsance, P. , Watlanapongsakorn, N. , &CharnsriPinyo, C., “Practical real time intrusion detection using machine learning approach”,Journal of Computer Communication, 34 , 2227–2235, 2011.
[7]. Bolon-Canedo, V. ,Sanchnez-Marano, N. , & Alonso- Betanzos, A.,“Feature se-lection and classification in multiple class dataset: An application to KDD cup 99 dataset”, Expert System with Applications, 38 , 5947–5957, 2011 .
[8]. Uguz, H., “Two stage feature selection method for text categorization by using information gain, principal component analysis and genetic algorithm”,Journal of Knowledge Based Systems, 24 , 1024–1032, 2011. [9]. Mukherjee, S., & Sharma, N., “Intrusion detection using Naïve Bayes classifier with feature reduction”,
Procedia Technology, 4, 119–128, 2012.
[10]. Li, Y. , Xia, J. , Zhang, S. , Yan, J. , Chuan, X. , & Dai, K., “An efficient intrusion detection system based on support vector machine and gradually features removal method”, Expert System with Applications, 39 , 424–430, 2012.
[11]. Karimi, Z. , Mansour, M. , &Harounabadi, A., “Feature ranking in intrusion detection dataset using combination of filter methods”, International Journal of Computer Application, 78 , 21–27, 2013.
[12]. Al-Jarrah, O. Y., Siddiqui, A., Elsalamouny, M., Yoo, P. D., Muhaidat, S., & Kim, K., “Machine learning based feature selection techniques for large scale intrusion detection”, IEEE, pp. 177–181, 2014.
[13]. Akashdeep,IshfaqManzoor, Neeraj Kumar. “A feature re duce d intrusion detection system using ANN classifier”, Expert Systems with Applications 88 (2017) 249–257.
[14]. Dharmendra Kumar, Ravi Singh Pippal, “A comprehensive review on intrusion detection system and techniques,” In: Proceedings of the Conference on Contemporary Technological Solutions towards fulfillment of Social Needs, August 31, 2018, Bhopal, India, pp. 133-137.