An Approach to Embed Power Flow Control
Model of UPFC into PSASP Based on User
Program Interface Function
Fang Zhang1,a
1Key Laboratory of Smart Grid of Ministry of Education, Tianjin University, Tianjin 300072, China
Email: [email protected]
Jianping Chen1,a,Chuandong Li2,b,Yanjuan Wu3,c
1Key Laboratory of Smart Grid of Ministry of Education, Tianjin University, Tianjin 300072, China; 2Electric Power Research Institute of Fujian Provincial Power Co. Ltd, Fuzhou 350007, Fujian, China 3Tianjin Key Laboratory for Control Theory & Applications in Complicated Industry System, Tianjin University of
Technology, Tianjin 300384, China
Email: {b[email protected], c[email protected]}
Abstract—The unified power flow controller (UPFC) is one of the most promising flexible AC transmission systems (FACTS) devices for the power flow control. The main objective of power flow control for UPFC is to improve the power flow distribution and increase the transmission capacity over the existing transmission corridor or line. This paper presents a practical engineering methodology of embedding the power flow control model of UPFC into the commercial software -- power system analysis software package (PSASP) based on its user program interface (UPI) function. In the proposed methodology, the interface currents of UPFC series side and UPFC shunt side between the UPFC device and the network are used to control the transmission line power flow and UPFC bus voltage, respectively. In UPFC series side, the current of UPFC series branch is calculated from the target equation of the power flow in the controlled line. In UPFC shunt side, the decoupling control between the active power and reactive power is implemented and the reactive current of UPFC shunt side is used to control the bus voltage. In this study, simulations are performed on a typical two-area power system and a practical 496-bus power system and simulation results show that the proposed methodology can be efficiently applied to the engineering research and analysis of the real power grid with UPFC with good convergence and with only one control parameter needed to be prescribed.
Index Terms--interface current; power flow control; UPFC; PSASP; UPI
I. INTRODUCTION
The unified power flow controller (UPFC) is the most versatile FACTS device [1]. The world’s first UPFC has been installed at the Inez Substation of American Electric Power (AEP) in eastern Kentucky [2]. UPFC is able to control the bus voltage and power flow in the
transmission line simultaneously. Determination of system steady state operating solution or load flow control, in the presence of UPFC, is essential in power system operation and planning studies [3, 4].
In recent years a number of investigations have been carried out on various capabilities of UPFC such as power flow control [5-7] and oscillation damping [8, 9]. Moreover some neural network-based intelligent controllers [10, 11] have been developed in the literature.
In recent years there has been increasing interest in modeling of the UPFC in power flow. The objective of UPFC power flow control is to adjust the power flow distribution along the transmission corridor and to increase the transmission capability through controlling power flows along the designated corridor or the transmission line. Hence, it is expected to upgrade the existing power flow analysis program to include the behavior of UPFC devices.
Ref. [12] represents the power flow model of UPFC as the series coupling transformer impedance together with a set of active and reactive nodal power injection at each end of the series impedance. UPFC is represented as the two-source power injection model [13-15]. Moreover, UPFC model is incorporated into the existing power flow programs through constructing the modified Jacobin matrix [16, 17].
calculation of PSASP by writing the user program codes. Ref. [21] constitutes the power flow model of UPFC based on injected power method using the UPI function provided by PSASP, however some simplifications are made such as neglecting the impedance of series transformer.
This paper pays attention to the interface between the power flow control model of UPFC and power system analysis software package (PSASP) without modifying the original load-flow codes. This paper proposes a novel interface-current–based method to insert the power flow control model of UPFC into PSASP based on its UPI function [22] without making any simplifications and assumptions. Control performance of UPFC in a typical two-area power system and a practical 496-bus power system in China validated the effectiveness and correctness of the proposed method.
II. INTERFACE POWER FLOW CONTROL MODEL OF UPFC
WITH PSASP
A. Basic Concept of UPFC
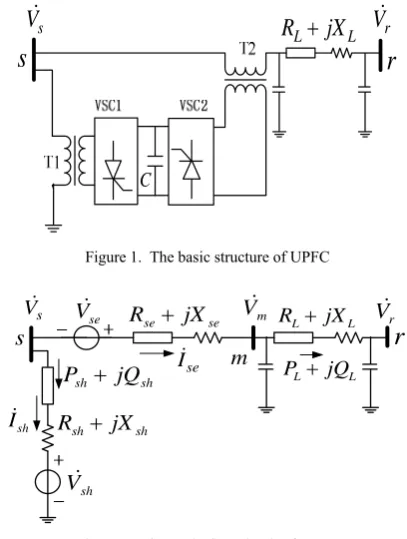
Fig.1 and Fig.2 show the basic structure of UPFC and its equivalent circuit, respectively. The UPFC consists of series and shunt voltage source converters, which can be modeled as controllable voltage sources. The series branch of the UPFC injects a voltage of controllable magnitude and phase angle via an injecting transformer, it can control the power flow along the transmission line and hence improve the power flow capability of the line. The shunt branch of the UPFC can independently exchange reactive power with the system to control the voltage of the connected bus, and absorbs the real power demanded by the series converter to maintain the constant voltage across the dc capacitor connected between the two converters.
s
V
V
rs
r
L L
R
+
jX
C
Figure 1. The basic structure of UPFC
Figure 2. The equivalent circuit of UPFC
In Fig.2, the subscript sh and se denote the shunt side and series side of UPFC, respectively. Vsh,Ish,Vse and Ise are the equivalent voltage and branch current of the shunt and series converters, respectively.Rsh, Xsh, Rse , Xseare the equivalent resistance and reactance of the coupling transformer T1 and T2, respectively.
B. Calculation of UPFC Series Side
UPFC series side can control the power flow of transmission line to the prescribed value through regulating the magnitude and phase of series injected voltage Vse. As shown in Fig.2, when the voltage Vs and
m
V are known, according to the reference value PLref and
Lref
Q of the power flow of the controlled transmission line, the current of the UPFC series branch can be calculated by (1).
*
Lref Lref
se
m
P jQ
I
V +
⎛ ⎞
= ⎜ ⎟
⎝ ⎠
(1)
Then the series injected voltage Vse can be obtained
through (2).
( )
se m se se se s
V =V +I R + jX −V (2) The real power injected to the transmission line by the series converter can be calculated according to Eq. (3).
Re
se se se
P V I
∗
⎡ ⎤
= ⎢ ⎥
⎣ ⎦ (3)
C. Calculation of UPFC Shunt Side
The equivalent voltage Vsh and current Ish of the UPFC shunt branch can be calculated by the following equations.
( 1) ( )
_ _ _
( )
Re Re
( )
s sh sh sh sh
sh sh se se se
k k
sh q sh q v s ref s
V V I R jX
V I V I P
I I k V V
∗ ∗
+
⎧ = + +
⎪
⎪ ⎡ ⎤= ⎡ ⎤=
⎨ ⎢ ⎥ ⎢ ⎥
⎣ ⎦ ⎣ ⎦
⎪
⎪ = + −
⎩
(4)
In (4), the first formula is the voltage equation of UPFC shunt branch, the second formula reflects the power balance relationship between the series and the shunt converters, which is a prerequisite to maintain the constant voltage across the dc capacitor. And the last formula employs the feedback control to the bus voltage through the reactive current component of the shunt current of the UPFC, where the superscript k+1 and k denote the iteration times, and kv is the feedback coefficient of the voltage error.
The basic principle of the last formula in (4) is illustrated as follows. An important function of the shunt side of the UPFC is to maintain the voltage of the connected bus constant. Let Vs be in phase with the d-axis,
the phasor diagram of UPFC shunt branch is represented
s
RL+ jXLr
m
V
s V
r
V
sh
V
se
V
sh sh jX
R +
se se jX
R +
se I
sh
I
m
L L
P + jQ
sh sh jQ
as Fig.3, where Ish d_ and Ish q_ are the d-axis and q-axis
components of UPFC shunt current, and θs is the angle of the bus voltageVs.
Figure 3. The phasor diagram of UPFC shunt branch
Based on the instantaneous power theory, the active power and reactive power absorbed by the UPFC shunt converter from the system can be expressed as:
_ _
_ _
sh s sh sd sh d sq sh q
sh s sh sq sh d sd sh q
P V I V I V I
Q V I V I V I
⎧ = ⋅ = + ⎪
⎨
= × = −
⎪⎩ (5)
As Vs is in phase with the d-axis, so the d-axis
component Vsd =Vs and q-axis component Vsq =0 , therefore (1) can be simplified as:
_
_ sh s sh d
sh s sh q
P V I
Q V I
= ⎧⎪ ⎨ = −
⎪⎩ (6) It can be seen from (6) that the decoupled control between the active power and reactive power is realized through the d-q transformation, and that the reactive
power Qsh can be controlled by the reactive current
component Ish q_ .
When Ish_q>0, Qsh<0, the UPFC shunt converter
supplies the reactive power to the system and then the bus voltage will be boosted; when Ish_q<0, Qsh>0, the UPFC
shunt converter absorbs the reactive power from the system and the bus voltage will be reduced.
Hence, the reactive current of UPFC shunt branch can be calculated according to the error between reference voltage Vs_ref and actual bus voltage Vs as shown in the last
formula in (4).
D. Inserting UPFC Model into PSASP Based on UPI Function
PSASP is powerful commercial software, which provides the electromechanical simulation environments as well as user program interface (UPI) function. The UPI function provided by PSASP makes PSASP significant difference from other commercial software, which allows incorporating new power system component into PSASP such as FACTS device with less workload of developing the new program through writing the user program (UP). The UP can be written in C++ language and converted into the dynamic link library, which is called by the
load-flow program (LP) or the transient stability program of PSASP in order to finish one calculation task.
In order to embed the power flow control model of UPFC into PSASP, the UPFC installed on the transmission line is removed from the grid with the interface currents Is inj_ and Im inj_ injected to the node-s and node-m as shown in Fig.4.
Figure 4. The current injection model of UPFC
According to Fig.2 and Fig.4, the interface currents
_
s inj
I and Im inj_ .can be expressed as:
_
_
( )
s inj se sh
m inj se
I I I
I I
⎧ = − + ⎪
⎨ = ⎪⎩
(7)
The power flow along the transmission line and the voltage of the connected bus can be controlled to the preset reference value through regulating the interface currents Is inj_ and Im inj_ , which are calculated based on
se
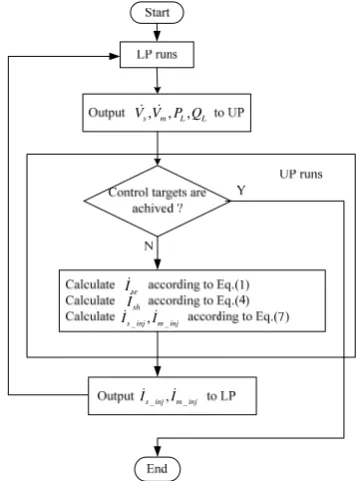
I and Ish as shown in (7). The calculation steps of the interface currents are illustrated in Fig. 5.
, , , s m L L
V V P Q
se
I
sh
I
_ , _
s inj m inj
I I
_ , _
s inj m inj
I I
Figure 5. The flow chart of alternate solution between LP and UP
The load-flow program (LP) of PSASP and the user program (UP) developed by the user are solved alternately until the control objectives are achieved. The interface variables between LP and UP include: the complex voltage of node-s and node-m Vs andVm, the power flow of the controlled transmission line PL and QL, and the
s
L Lr
R
+
jX
m
V
s
V
V
rm
L L
P
+
jQ
_
s inj
I
I
m inj_q
d
x y
sh I
s V
_
sh d I
_
sh q I
s θ shy I
injected currents of node-s and node-m Is inj_ and Im inj_ .
The LP transfers the data Vs, Vm, PL and QL to the UP,
_
s inj
I and Im inj_ calculated from UP are transferred back
to the LP. The flow chart of alternate solution between LP and UP is shown in Fig. 5.
III. CASE STUDY
A. Two-area Power System
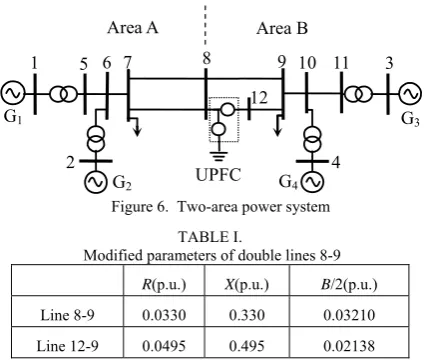
A two-area power system as shown in Fig.6 is firstly used to verify the proposed approach of embedding the power flow control model of UPFC into the commercial software PSASP without modifying the original load flow codes. The parameters of the two-area system are the same as in [23] except that the impedances of line 8-9 and line 12-9 are modified, and the modified line parameters are shown in Table I.
Without UPFC, the voltage magnitude of bus 8 is 0.9894 p.u., while the power flows of line 8-9 and line 9-12 are 0.2558-j0.05953 p.u. and 0.1705-j0.03967 p.u. respectively. It can be seen that without UPFC the power flow distributions of the transmission lines are determined by the reciprocal value of the line impedance and line 8-9 has larger real power flow than line 12-9.
UPFC
1 5 6 7 8
G4
9 10 3
4 11 Area A
12 Area B
G3 G1
G2 2
Figure 6. Two-area power system
TABLE I.
Modified parameters of double lines 8-9
R(p.u.) X(p.u.) B/2(p.u.)
Line 8-9 0.0330 0.330 0.03210
Line 12-9 0.0495 0.495 0.02138
In order to balance the power flow of line 8-9 and line 12-9, one UPFC is installed on line 12-9 as shown in Fig.6. The reference voltage of bus 8 and the reference reactive power of line 12-9 are set as follows: V8ref=1.0
and QLref_line 12-9=-0.03967 p.u. (the reactive power is set
to the original value without UPFC). Then the reference active power of line 12-9 is increased until the power flows along line 8-9 and line 12-9 are balanced. Here control precisions of the bus voltage and line power flow are both set at 0.0001, the voltage feedback coefficient kv
is set at 2.0. Control results are shown in Table II.
TABLE II.
Control results with UPFC installed on Line 12-9
Control references Control results Series voltage Comparisons of active power
Vsref
(p.u.)
PLref
(p.u.)
QLref
(p.u.)
Vs
(p.u.)
PL
(p.u.)
QL
(p.u.) se
V
(p.u.∠°)
PLine 8-9
(p.u.)
PLine 12-9
(p.u.)
PTotal
(p.u.)
Case 1 1.0 0.17500 -0.0397 0.99993 0.17501 -0.03969 0.0099∠128.75 0.17501 0.25102 0.42603
Case 2 1.0 0.18500 -0.0397 0.99990 0.18500 -0.03968 0.0173∠110.81 0.18500 0.24104 0.42604
Case 3 1.0 0.19500 -0.0397 0.99998 0.19500 -0.03970 0.0254∠104.45 0.19500 0.23104 0.42604
Case 4 1.0 0.20500 -0.0397 1.00006 0.20498 -0.03972 0.0338∠101.39 0.20498 0.22112 0.42610
Case 5 1.0 0.21307 -0.0397 1.00006 0.21308 -0.03971 0.0406∠100.20 0.21308 0.21307 0.42615
It can be observed from TABLE II that UPFC can track the control targets very well. It can be seen from the column of comparisons of active power of Table II that the active power flow of line 12-9 will decrease when the active power flow of line 8-9 is controlled to increase. However the total power flow of line 8-9 plus line 12-9 almost keeps constant. When the active power flow of line 8-9 reaches 0.21308 p.u., the power flow of line 8-9 equals to that of line 12-9, which shows that UPFC can adjust the power flow distribution along the transmission corridor.
Variation curves of controlled bus voltage and power flow of controlled line of the two-area power system are illustrated in Fig.7. It can be seen that the proposed method has fast convergence speed with at most six alternate iterations between LP and UP.
0 1 2 3 4 5 6
0.988 0.99 0.992 0.994 0.996 0.998 1 1.002
Alternate solution times between LP and UP
V
ol
tage
of
c
ont
ro
lle
d bu
s(
p.
u.
)
Case1 Case2 Case3 Case4 Case5
0 1 2 3 4 5 6 0.16
0.17 0.18 0.19 0.2 0.21 0.22
Alternate solution times between LP and UP
A
ct
ive
powe
r f
low
of
c
ont
rol
le
d
line
(p.
u.
)
Case1 Case2 Case3 Case4 Case5
(b) Variation of the active power of line 12-9 with alternate times
0 1 2 3 4 5 6
-0.04 -0.0395 -0.039 -0.0385 -0.038 -0.0375 -0.037 -0.0365 -0.036 -0.0355 -0.035
Alternate solution times between LP and UP
R
eact
iv
e p
ow
er
f
lo
w
o
f co
nt
ro
lled
li
ne(
p.
u.
)
Case1 Case2 Case3 Case4 Case5
(c) Variation of the reactive power of line 12-9 with alternate times
Figure 7. Variation curves of controlled bus voltage and power flow of controlled line of two-area power system
B. Real Power System in China
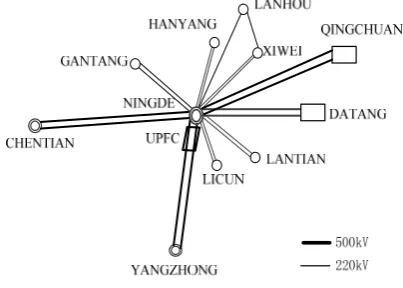
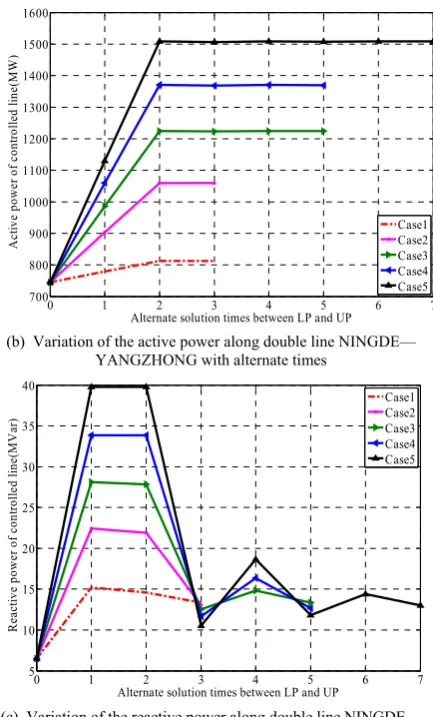
A real 496-bus power system in China is also studied. The local map of the real power system is shown in Fig.8. The double lines NINGDE-YANGZHONG have completely identical parameters, and the thermal current of single line NINGDE-YANGZHONG is 2700 A. Without UPFC, the voltage magnitude of bus NINGDE is 1.019 p.u., while the power flow of double lines NINGDE-YANGZHONG is 777.05+j13.35MVA, which is far less than the thermal capacity of the line.
Now two UPFCs are installed at the NINGDE side of double transmission lines NINGDE-YANGZHONG in order to increase the active power transmission capacity of the double lines. The maximum magnitude of the series injected voltage of UPFC is set to 0.1 p.u. Set the
reference voltage of bus NINGDE and the reference reactive power of the controlled double lines to the level before UPFCs are installed, that is, Vsref=1.019p.u. and
QLref =13.35Mvar, then increase the reference active
power to the different level, the control results are shown in Table III. Here control precisions of the bus voltage and line power flow based on per-unit value are both set at 0.005, the voltage feedback coefficient kvis set at 0.75.
Figure 8. The local map of the real power grid in China
As shown in Table III, with the increase of active power of the controlled double line, the magnitude of series injected voltage increases and the voltage of bus NINGDE and the reactive power of the double line are controlled well at the preset reference values. When the control ability of UPFC reaches the limit with the magnitude of the series injected voltage at maximum 0.1, the active power of the double line is controlled at 1508MW. The results show the powerful control ability of UPFC compared to the original active power of 777MW of the double line NINGDE-YANGZHONG without UPFC, and verify the correctness and effectiveness of the power flow control method proposed for UPFC.
For Case 1−Case 5 shown in Table III, the variation curves of controlled bus voltage and the power flow of the controlled line with the alternate solution times between LP and UP are shown in Fig. 9. It can be seen from Fig. 9 that the power flow control method for UPFC proposed in this paper has good convergence, and that the bus voltage and the power flow can track the reference values quickly with at most seven iterations. Especially the active power flow reaches the reference value with only two iterations between LP and UP, which is because the power flow of the line is controlled directly based on the power flow target equation of the controlled line.
TABLE III.
Control result of UPFC installed on NINGDE—YANGZHONG double lines
Control references Control results Control variables of each UPFC
Vsref
(p.u.)
PLref
(MW)
QLref
(Mvar)
Vs
(p.u.)
PL
(MW)
QL
(MVar) se
V
(p.u.∠°)
Case 1 1.019 812 13.35 1.0201 812.00 13.35 0.0087∠85.2
Case 3 1.019 1224 13.35 1.0222 1224.00 13.35 0.0626∠91.8
Case 4 1.019 1370 13.35 1.0232 1369.72 12.69 0.0818∠92.7
Case 5 1.019 1508 13.35 1.0244 1507.89 13.00 0.0999∠93.8
(a) Variation of the voltage of bus NINGDE with alternate times
(b) Variation of the active power along double line NINGDE— YANGZHONG with alternate times
(c) Variation of the reactive power along double line NINGDE— YANGZHONG with alternate times
Figure 9. Variation curves of controlled bus voltage and power flow of controlled line of the real power system in China
IV. CONCLUSION
Power flow control is the basic control function for UPFC. This paper proposes a novel interface-current–
based method of embedding UPFC power flow model into the commercial software –PSASP by using the user program interface function provided by PSASP. In the proposed method, the load-flow program (LP) of PSASP and the user program (UP) are solved alternately through regulating the interface currents between the UPFC device and the network until the control objectives of UPFC are achieved.
Case studies on a typical two-area power system and a real power system show that the proposed method of power flow control for UPFC has the good convergence characteristics without taking any assumptions and simplification, and that the proposed method is easy to implement in engineering application with only one preset control parameter.
REFERENCES
[1] L. Gyugyi, C. D. Schauder, S. L. Williams, T. R. Rietman, D. R. Torgerson, A. Edris, “The unified power flow controller: a new approach to power transmission control”, IEEE Trans. on Power Delivery, 1995, 10(2), pp. 1085–1097.
[2] B. A. Rem, A. Keri, C. Schauder, E. Stacey,A. S. Mehraban, “AEP unified power flow controller performance”, IEEE Trans. on Power Delivery, 1999, 14(4), pp. 1374-1381.
[3] S. A. Taher, M. K. Amooshahi, “New approach for
optimal UPFC placement using hybrid immune algorithm in electric power systems”, International Journal of Electrical Power & Energy Systems, 2012, 43, pp. 899-909.
[4] H. Alasooly, M. Redha, “Optimal control of UPFC for
load flow control and voltage flicker elimination and current harmonics elimination”, Computers and Mathematics with Applications, 2010, 60, pp. 926-943.
[5] L.M. Liu, P.C. Zhu, Y. Kang, J. Chen, “Power-flow
control performance analysis of a unified power-flow controller in a novel control scheme”, IEEE Trans. on Power Deliv, 2007, 22(3), pp. 1613-1619.
[6] Ajam, A.M. Shotorbani, M.P. Aagababa, “Application of the direct Lyapunov method for robust finite-time power flow control with a unified power flow controller”, IET Generation, Transmission & Distribution, 2012, 6(9), pp. 822–830.
[7] Zangeneh, A., Kazemi, A., Hajatipour, M., Jadid, J., “A Lyapunov theory based UPFC controller for power flow control”, Electr. Power Energy Syst., 2009, 31, pp. 302-308.
[8] C.T. Chang and Y.Y. Hsu, “Design of UPFC controllers and supplementary damping controller for power transmission control and stability enhancement of a longitudinal power”, IET Generation, Transmission & Distribution, 2002, 149(4), pp. 463-471.
[9] J. Guo, M. L. Crow, JagannathanSarangapani, “An
Improved UPFC Control for Oscillation Damping”, IEEE Trans. on Power System, 2009, 24(1), pp. 288-296.
[10] G.K. Venayagamoorthy, R.P. Kalyani, “Two separate
continually online-trained neurocontrollers for a unified power flow controller”, IEEE Trans. on Industry
0 1 2 3 4 5 6 7
5 10 15 20 25 30 35 40
Alternate solution times between LP and UP
R
ea
cti
ve
p
ow
er o
f c
on
tro
lle
d li
ne
(M
V
ar)
Case1 Case2 Case3 Case4 Case5
0 1 2 3 4 5 6 7
700 800 900 1000 1100 1200 1300 1400 1500 1600
Alternate solution times between LP and UP
Act
iv
e power
o
f cont
ro
lle
d l
in
e(
M
W
)
Case1 Case2 Case3 Case4 Case5
0 1 2 3 4 5 6 7
1.0195 1.02 1.0205 1.021 1.0215 1.022 1.0225 1.023 1.0235 1.024 1.0245
Alternate solution times between LP and UP
V
ol
ta
ge
of
c
ont
ro
lle
d
bus
(
p.
u.
)
Applications, 2005, 41(4), pp. 906-916.
[11] P. K. Dash, S. Mishra, and G. Panda, “A radial basis function neural network controller for UPFC”, IEEE Trans. Power Syst., 2000, 15(4), pp. 1293-1299
[12] M.H. Haque, C.M. Yam, “A simple method of solving
the controlled load flow problem of a power system in the presence of UPFC”, Electric Power Systems Research, 2003, 65, pp. 55-62.
[13] M. Zarghami, M. L. Crow, “The existence of multiple
equilibria in the UPFC power injection model”, IEEE Trans. on Power Systems, 2007, 22(4), pp. 2280-2282.
[14] A. Rajabi-Ghahnavieh, M. Fotuhi-Firuzabad, M.
Shahidehpour, R. Feuillet, “UPFC for Enhancing Power System Reliability”, IEEE Trans. on Power Delivery., 2010, 25(4), pp. 2881-2890.
[15] A. LashkarAra, A. Kazemi, S.A. NabaviNiaki,
“Modelling of Optimal Unified Power Flow Controller (OUPFC) for optimal steady-state performance of power systems”, Energy Conversion and Management, 2011, 52, pp. 1325-1333.
[16] C. R. Foerte-Esquivel, E. Acha, H. Amhriz-PBrez, “A
Comprehensive Newton-Raphson UPFC Model for the Quadratic Power Flow Solution of Practical Power Networks”, IEEE Trans. on Power Systems, 2000, 15(1), pp. 102-109.
[17] S. Kamalasadan, G.D. Swann, “An indirect UPFC model to enhance reusability of newton power-flow codes”, IEEE Trans. on Power Delivery, 2008, 23(4), pp. 2079-2088.
[18] S.J. Yao, X.Y. Song, Y. Wang, “Power flow modeling of unified power flow controller based on power system analysis software package (PSASP)”, Journal of North China Electric Power University, 2011, 38(5), pp.11-16. [19] Y. Zhang, X.Y. Mao,Z. Xu.”UPFC models for power
system steady-state and dynamic analysis”, Power System Technology, 2002, 26(7), pp. 30-33.
[20] A. Mete Vural, Mehmet Tümay, “Mathematical modeling and analysis of a unified power flow controller: A
comparison of two approaches in power flow studies and effects of UPFC location”, International Journal of Electrical Power and Energy Systems, 2007, 29(8), pp. 617-629.
[21] Q.J. Liu, X. Li, Y.Z. Sun, “Power flow modeling of
FACTS based on PSASP”, Power System Technology, 2000, 27(7), pp. 6-9.
[22] China Electric Power Research Institute User Manual of Power System Analysis Software Package (Version 6.2) Beijing(2005)
[23] X. Xu, R.M. Mathur, J. Jian, G.J. Rogers, P. Kundur, “Modeling of Generators and Their Controls in Power System Simulations Using Singular Perturbations”, IEEE Transactions on Power Systems, 1998, 13(1), pp. 109-114.
Fang Zhang received her MEng degree in 2000 and PhD Degrees in 2007 from Tianjin University, Tianjin, China. She joined Tianjin University in 2000 and is currently an associate professor. Her main research interests are in Flexible AC transmission systems control.
Jianping Chen is pursuing his Master degree in Tianjin
University, Tianjin, China. His research interests are in FACTS control and wind farm modeling and simulations.
Chuandong Li received his MEng degree in 2005 and PhD
Degrees in 2007 from Tianjin University, Tianjin, China. He joined Electric Power Research Institute of Fujian Provincial Power Co. Ltd of China in 2007 and is currently a senior engineer. His research interests are in FACTS and power system planning.