International Journal of Pharmaceutical Research & Allied Sciences, 2016, 5(3):476-488
Research Article
CODEN(USA) : IJPRPM
ISSN : 2277-3657
Evaluation of the enzyme changes in different grades of fatty liver syndrome in
dairy cows
Running title: Enzyme changes in fatty liver
Mojgan Ahmadi
1, Shahabeddin Safi
2*, Pejman Mortazavi
3, Noordahr Rokni
4 1, 2, 3, 4Departments of Clinical Pathology, Pathology and Health and Food, Faculty ofSpecialized VeterinarySciences, Science and Research Branch, Islamic Azad University, Tehran, Iran.
________________________________________________________________________________________
ABSTRACT
Fatty liver syndrome often occurs in high producing dairy cows at early lactation and causes an increase in liver inflammation, veterinary costs, long calving intervals, reduced lifetime and eventually economic losses. Existing dogma posits that liver biopsy is the most reliable approach for identifying the presence of fatty liver but it is limited by cost, sampling error, and procedure-related morbidity and mortality. The objective of the present study was to measure the serum activities and changes in liver enzymes including Paraoxonase-1 (PON1), Protein Kinase C (PKC) as well as Non-esterified Fatty Acid (NEFA) and Beta hydroxybutyrate (BHB) concentrations to compare their sensitivities and specificities with biopsy as the gold standard and also to evaluate the probability of fatty liver and its different grades. A total of 90 serum and liver samples were collected from two slaughterhouses around Tehran. Using histopathologic examination, 19 cows were diagnosed as healthy and 18 cows were diagnosed with different grades of fatty liver. Then, serum activities and concentrations of the above mentioned parameters were measured. The area under the receiver operating characteristic curve (AUC-ROC) of these parameters were also calculated and Bayesian logistic regression was used to estimate the odds of different grades of fatty liver compared to the healthy cows based on the most suitable variables as well as the best model. Both PON1 and PKC activities were reduced in the cows with fatty liver, but the decrease was significant only for PKC (P<0.001). According to the results, GGT, NEFA, BHB, PON1 and PKC were selected as the variables which can be used to make the best model for grade 1. ALT, GGT, BHB and PKC for grade 2, AST, NEFA and GGT, NEFA for prediction of grade 3 and 4, were also selected, respectively. It was finally concluded that NEFA concentration (AUC= 0.877) and PKC activity (AUC=0.865) have the highest diagnostic accuracy for fatty liver diagnosis and addition of PKC to the biochemical profile can improve the fatty liver diagnosis in dairy cows and also the obtained functions can be used to estimate probability of fatty liver without performing biopsy to use the best ways for early treatment and prevent more economic losses.
Keywords: enzyme changes, fatty liver, probability
_____________________________________________________________________________________________
INTRODUCTION
Fatty liver has no specific clinical sign and is usually develops concurrently with the other diseases which typically are seen at or shortly after calving such as metritis, retained placenta, mastitis, displaced abomasum, acidosis and hypocalcemia which makes its diagnosis confusing (Gruenberg, 2015; Sevinc et al. 2001).
Liver biopsy is the gold standard of diagnosis of FLS, but diagnosis is more based on biochemical analysis and ultrasonography due to biopsy is an invasive and expensive procedure and can cause hemorrhage, infection and in some cases, the animal death (Gruenberg, 2015; Ametaj, 2005)
Using ultrasound is common in diagnosis of nonalcoholic fatty liver disease (NAFLD) in humans and a positive relationship between the amounts of fat in the liver and the increased echogenicity in ultrasound is reported (Ametaj, 2005; Acorda et al. 1995); but due to the high cost of the device, its use in practical conditions of dairy industry in many regions is limited and biochemical analysis is still used more to diagnose FLS.
Routine biochemical analysis for diagnosis of FLS is included measuring the blood metabolites such as non-esterified fatty acids (NEFA) and beta-hydroxybutyrate (BHB) as well as serum activities of liver enzymes such as aspartate aminotransferase (AST), alanine aminotransferase (ALT), alkaline phosphatase (ALP) and gamma-glutamyltransferase (GGT) which are not reliable enough to diagnose fatty liver due to the variation in their basic concentrations among individual cows and also some of the parameters like ALT are not sensitive enough in ruminants to be used as liver function tests, so they have limited diagnostic value in diagnosis of this disease. In addition, since the above mentioned liver enzymes are not specific for liver and their activities do not increase in mild or moderate cases, their use in practical conditions has its own drawbacks (Rezaei Saber and Nazeri, 2012; Sevinc et al. 2001). Sevnic et al. (2001) reported that biochemical analysis has relatively high negative predictive value (NPV) and low positive predictive value (PPV) depending on the intensity of fat infiltration in the liver. For more robust biochemical tests, Paraoxonase 1 (PON1) and Protein Kinase C (PKC) were also measured and evaluated simultaneously in the present study. Paraoxonase-1 (PON-1) is an enzyme which is produced and secreted by the mammalian liver and is associated with High-density Lipoprotein (HDL) in the blood. It has a protective effect against oxidation of lipoproteins and its activity will decrease by increased size of HDL. The studies have shown that PON1 activity is reduced after parturition compared with non-pregnant cows at late stages of lactation
(Miyamoto et al. 2005; Turk et al. 2004).
Protein Kinase C (PKC) is a family of protein kinase enzymes which is found in hepatocytes and adipocytes and regulates Very Low-density Lipoprotein (VLDL) secretion, Low-density Lipoprotein (LDL) receptor and picking up free cholesterol (FC) by HDL (Considine et al. 1995; Katoh and Kimura, 1989). The conducted studies have shown that the serum activity of PKC enzyme in humans with NAFLD is increased and is often associated with insulin resistance (Considine et al. 1995). In a time-course experiment using ethionine for fatty liver induction in rat, it was found that PKC activity initially increased and then decreased (Katoh, 2002). PKC activity decreased in a few studies on inducing fatty liver using ethionine (an analogue of methionine) in cows (Katoh, 2002; Katoh and Kimura, 1989).
The aim of the present study was to compare the sensitivities and specificities of PON1 and PKC enzymes in dairy cows suffering from fatty liver with biopsy and find if addition of their activities measurement to the biochemical profile can improve the diagnosis of fatty liver in dairy cows and also to measure serum changes in the activities of above mentioned enzymes as well as NEFA and BHB concentrations in dairy cows with different grades of fatty liver to see if the studied parameters can be used to determine the probability of the occurrence of the disease in order to improve the health condition of the cows and to prevent the economic loss of the disease.
MATERIALS AND METHOD
Blood sampling was performed from the jugular vein of 90 Holstein dairy cows by simple sampling from the suspected cows. The suspected cows were within 4 weeks postpartum to early lactation referred to the slaughterhouse with signs such as loss of appetite, depression, reduced milk production, weak ruminal movement
and rapid deterioration of body conditions. 5 ml blood samples were taken using 18 gauge venojects with no
anticoagulant (Terumo, Germany) and were carried to the Biochemistry laboratory in the Faculty of Veterinary Medicine, Shahriar, Iran under cold condition where serum samples were harvested using centrifugation at 2000-3000 rpm for 20 minutes. Serum samples were kept at -20ºC. Also, 2×2 cm pieces of the livers (from 90 cows) were taken and placed in plastic containers containing formalin 10% and were carried to the Pathology Laboratory, Faculty of Veterinary Medicine, Shahriar, Iran, for preparation of the pathological sections.
Liver samples were cut to 3–5 μm in thickness on a motorized rotary microtome, mounted on glass slides, dried and
stained with Hematoxylin and Eosin (H&E) and were examined via light microscopy for lipid content. Liver fat content was classified according to a 5-point scale of severity of fatty infiltration named Grades of fatty liver which range from 0 (no fat droplet visible) to 4 (panlobular fatty infiltration). Liver tissue was evaluated in concentric regions in the area from the central vein to the portal triad of the hepatic lobule and scores were assigned according to the following guidelines:
Grade 0= no visible fatty degeneration (they were considered as healthy livers/cows).
Grade 1= focal fatty degeneration (cloudy swelling with small vacuoles representing lipids washed out by alcohol during staining) on less than 25% of the tissue.
Grade 2= focal fatty degeneration (many small vacuoles to medium-sized vacuoles) on 25–50% of the tissue.
Grade 3= extensive, but focal fatty degeneration (large vacuoles).
Grade 4= global fatty degeneration (appearance of stamp cells which are hepatic cells that contain a large volume of lipid to the extent that cell counter is altered and nuclei are displaced).
In the biochemistry section, serum NEFA and BHB concentrations and the serum activities of liver enzymes including ALT, AST, ALP and GGT were measured using commercially available kits (Randox, UK for NEFA and BHB and Bionik, Canada for liver enzymes, respectively) by BT1500 auto-analyzer (Germany). Serum activities of PON1 and PKC were also measured using bovine Paraoxonase-1 (PON1) and bovine protein kinase C (PKC) enzyme-linked immunosorbent assay (ELISA) kits (EAST BIOPHARM, US), respectively.
Statistical analysis
Level of significance was considered as P<0.05 and data were reported as mean ± standard deviation (SD). Pearson correlation was used to determine the correlation coefficients among the variables. Diagnostic accuracy of serum PON1, PKC and other biochemical tests was calculated using receiver operating characteristics (ROC) curve analysis with 95% confidence intervals (CI=95%). Kolmogorov-Smirnov was used to check the normal distribution of variables. All variables were normally distributed.
Bayesian logistic regression was used to find the best model for prediction of the occurrence of each grade of fatty liver using the studied parameters. It was also used to achieve the best model based on all data regardless of grading to calculate the probability of the occurrence of fatty liver syndrome.
RESULT
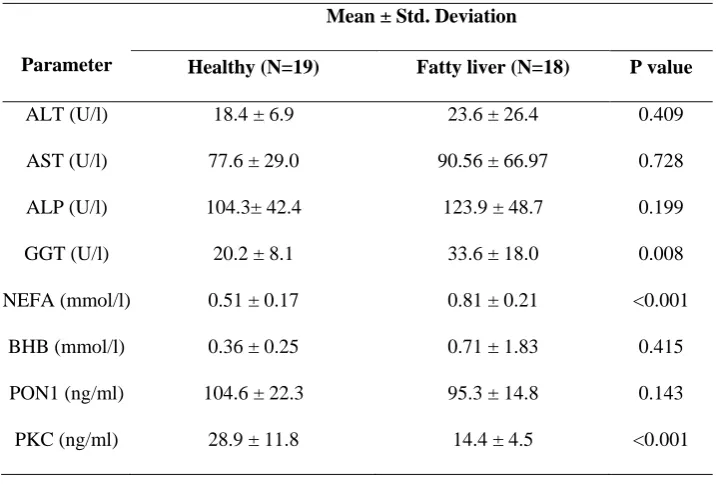
Table 1 shows the mean ± standard deviations of the studied parameters in both healthy cows and cows with fatty liver. The serum activities of AST, ALT, ALP and GGT increased in cows with fatty liver compared to the healthy cows and the increases were insignificant (P>0.05) expect for GGT which its increase was significant (P<0.05). Serum PON1 activity was reduced in cases with FLS compared to the controls, but the decrease was not significant (P=0.143) while serum PKC activities was significantly reduced in cows with FLS compared to the healthy ones (P<0.001). Also, a significant increase was seen in NEFA concentrations in cows with FLS (P<0.001) but the increase in BHB concentrations was not significant (P=0.415) (Table 1).
Diagnostic performance of each test was evaluated by the receiver operating characteristic curve (ROC) analysis and measuring the area under the curve (AUC) (Fig. 10-13)
The AUCs for PON1 and PKC activities were calculated as 0.617 and 0.865, respectively which was significant for PKC (P<0.001). The difference between the AUCs was significant (P<0.01) which means that PKC has more accurate than PON1 in the diagnosis of fatty liver syndrome (Fig.10)
According to Fig.11, the AUCs for NEFA and BHB concentrations were calculated as 0.877 and 0.602, respectively and the difference was significant (P<0.001). Also, no significant difference was seen between PKC and NEFA (P=0.88), while the difference between PKC and BHB was significant (P=0.04) which means that PKC is more accurate than BHB in diagnosis of fatty liver syndrome.
AUCs for serum ALT, AST, ALP and GGT activities were calculated as 0.586, 0.525, 0.642 and 0.750, respectively. No significant difference was observed between PON1 and the serum liver enzymes activities and also among the liver enzymes with each other (P>0.05) (Fig 12); the difference between PKC serum activity and measured serum activities of the other liver enzymes except GGT was significant (P<0.05) (Fig 13).
Pearson correlation test showed the correlation between variables in the control group and cows with FLS (Table 2).
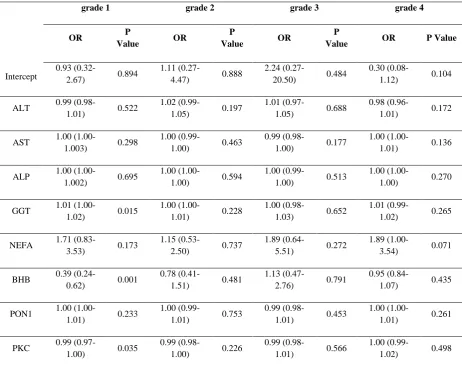
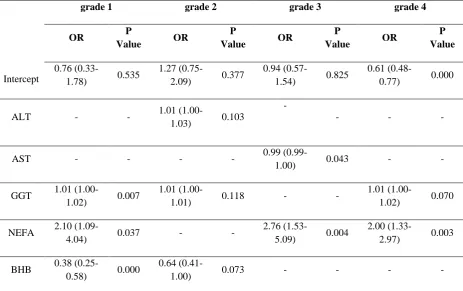
Bayesian logistic regression was used to estimate the odds of different grades of fatty liver compared to the healthy cows based on the most suitable variables (Table 3), and to construct the algorithm of selecting the best model (Table 4). It was also used to find the best model based on all data and regardless of grading (Table 5).
DISCUSSION
Since fatty liver has no specific clinical sign and liver biopsy is often difficult to be performed, laboratory analysis seems to be a practical way to diagnose the disease. A NEFA concentration up to 200 mEq/l indicates a normal condition and positive energy balance. It is reported that NEFA concentration is between 800 to 1200 mEq/l in the last days before parturition and decreases immediately after calving and concentrations more than 700 mEq/l one week after parturition can represent the negative energy balance and increases the risk of fatty liver development
(Drackley, 2000). A long-term exposure to concentrations more than 600 µEq/l will probably lead to fatty liver, so
that the concentration of NEFA in fatty liver syndrome is around 1000 µEq/l (1 mmol/l) or more (Gruenberg, 2015).
Farid et al. (2013) reported that NEFA concentration had been 1.19±0.60 mmol/l with a significant increase (P≤0.001) in cows with FLS which is in consistent with our results that showed the concentrations of NEFA in cows with FLS from 0.6 mmol/l to 1.36 mmol/l.
The up-taken NEFA by the liver can pass through the oxidation or esterification pathways in which NEFA oxidation leads either to the formation of ATP in the tricarboxylic acid cycle or to the formation of ketones through peroxisomal or beta-oxidation (Gruenberg, 2015).
Samanc et al. (2011) reported that BHB was measured in 5 to 7, 12, 30 and 60 days postpartum and it was shown that in cows with 20% fat in the liver at day 12, BHB concentration was significantly higher compared to the normal cows, while it was significantly lower than normal cows at day 30 which reflects dysfunction of hepatocytes. In the present study, there was no significant difference in BHB between the cows with fatty liver and the control group.
destruction and dysfunction of hepatocytes which results in enzymes leakage from the hepatocytes (Farid et al. 2013; Kalaitzakis et al. 2010).
Farid et al. (2013) indicated that the serum AST activity in cows with fatty liver was significantly higher than normal cases (P≤0.001), but ALP (P≤0.871) and GGT (P≤0.903) activities did not increase significantly while Sevinc et al. (2001) reported that the serum activities of AST, GGT and CPK were increased significantly in cows with fatty liver (P<0.001).
In the present study, the serum activities of AST, ALT, ALP and GGT increased in cows with fatty liver, but the increases were not significant (P>0.05) except for GGT (P<0.05). Due to the significant increase in GGT, it seems that fat infiltration during the development of fatty liver leads to bile duct damage and positive correlation between NEFA and ALP activities confirms this hypothesis. In fact, the simultaneous increase in ALP and GGT shows that infiltration of fat in the liver leads to increased intraluminal pressure and subsequent obstruction of the bile ducts within the liver.
Paraoxonase 1 (PON1) hydrolyzes the oxidized lipids that lead to a reduction in oxidation of the serum lipoproteins, macrophages and atherosclerotic lesions (Nouri et al. 2009; Shih et al. 1998).
Farid et al. (2013) reported that PON1 activity in cows with fatty liver decreased significantly compared to the controls (P<0.001). Also, it is indicated that paraoxonase activity and the protein PON1 are increased by reducing the HDL size and almost 60% of paraoxonase activity is distributed in the heavy component of HDL (Miyamoto et
al. 2005).
The values of PON in the cows at the end of pregnancy and in the early lactation was in a range of 20-150 U/ml
(Bionaz et al. 2007), while the activity of PON was lower than of Turk et al. (2004) which was 450 U/l for
postpartum and 750 U/l for late lactation dairy cows. In our study, PON1 activity in cows with fatty liver was reduced, but the decrease was not significant (P>0.05).
Some mechanisms can explain PON1 reduction including: 1) reduced synthesis of PON1 by the liver probably due to the increased pro-inflammatory cytokines (TNF-α) in liver and serum (Bobe et al. 2004; Kumon et al. 2003), 2) free radical concentrations increase in cows with fatty liver and PON1 is inactivated after hydrolysis of the lipid
peroxides (Aviram et al. 1999; Murdon et al. 1999), 3) changes in the structure and composition of HDL which is
confirmed by the reduced LCAT activity in cows with fatty liver. Both PON1 and LCAT are the associated proteins
with HDL (Nakagawa et al. 1997; Sabesin et al. 1977), so it seems that reduction of PON1 and LCAT in serum is
related to the changes of the structure and concentration and may be resulted from fatty liver (Farid et al. 2013).
PKC enzyme is normally located in the nuclei as well as in other intracellular organelles and phosphorylates and modulates the activity of 3-hydroxy-3-methylglutaryl CoA reductase, the rate limiting enzyme of cholesterol synthesis, and of phospholipid methyltransferase which catalyzes the conversion from phosphatidylethanolamine to phosphatidylcholine (PC) (Katoh, 2002). In ethionine-induced and naturally acquired fatty liver in cow, hepatic PKC activity is reduced and the reduction appears to correspond to the reduction observed after the initial increase of PKC activity in the rat (Katoh, 2002).
In the present study, PKC activity was significantly reduced in cows with fatty liver (P<0.001). The significant difference between PON1 and PKC AUCs (p=0.01) shows that PKC is significantly more accurate than PON1 in the diagnosis of fatty liver and based on the significant increase in NEFA concentration, it can be concluded that the relationship between PKC activity and liver damage is mediated by fatty liver.
According to the findings of the present study, NEFA concentration (AUC= 0.877) and PKC activity (AUC=0.865) had the highest diagnostic accuracy for fatty liver diagnosis and addition of PKC to the biochemical profile can improve the fatty liver diagnosis in dairy cows and therefore could have a considerable impact to prevent economical losses due to the disease.
value<0.05) which means that in fatty liver, PON1 was reduced when NEFA was increased and the difference was significant. Also, there was a significant positive relationship between PON1 and PKC (0.727, P value<0.01).
Bayesian logistic regression estimated the odds of different grades of fatty liver in comparison with healthy cows.
In tables 3 to 5, Bayesian logistic regression was used to evaluate data of different grades of fatty liver based on (1) all variables, (2) five important variables and (3) selecting the best model for each grade, respectively. Table 6 also presents the odds of fatty liver syndrome in comparison with healthy cows without considering its different grades by Bayesian logistic regression and (4) using all data regardless of the grading.
In table 3, each grade of fatty liver has been compared with the healthy group and Bayesian logistic regression has measured and determined the importance and relevance of all variables with each grade of fatty liver.
In Table 4, Bayesian logistic regression has also examined each grade of fatty liver based on the most appropriate five variables including GGT, NEFA, BHB, PON1 and PKC to compare the odds of cows with different grades of fatty liver with healthy cows while AST, ALT and ALP were deleted (lowering variables makes the test more powerful).
This table shows that NEFA had been the most affected variable in grade 1, so that one unit increase in NEFA had been associated with an increase in the odds of this grade up to 2.1 times. GGT has also been affected significantly in grade 1 and one unit increase in GGT had been associated with a 1.01 times increase in grade 1 while BHB and PKC had a significant protective effect against this grade of fatty liver which means that by one unit increases in BHB and PKC, the odds of grade 1 was reduced to 0.38 and 0.99 times, respectively.
In grade 2, only PKC had a similar reaction with grade 1 and the other variables were not considered as significant.
Also in grades 3 and 4, no parameters were considered as significant and it can be due to the sample size of these grades, although NEFA had a borderline effect on grade 4.
The final equation which may be calculated for each grade can be used to predict the probability of each grade by replacing the measured amounts of these factors to the related equation of each grade.
Bayesian logistic regression also evaluated each grade of fatty liver compared to the health condition in dairy cows based on the algorithm of selecting the best model in table 5. According to this model, GGT, NEFA, BHB, PON1 and PKC are the variables which can be used to make the best model for grade 1. ALT, GGT, BHB and PKC should be measured to predict the probability of the grade 2 of fatty liver based on this model and AST, NEFA and GGT, NEFA which have to be measured to predict grade 3 and 4, respectively.
According to table 6, Bayesian logistic regression was also used to find the best model for fatty liver syndrome based on all data and regardless of grading. GGT, NEFA, BHB and PKC can be measured to calculate the probability occurrence of fatty liver in dairy cows. The final equation can be used to predict the probability of fatty liver by replacing the measured amounts of these factors on this function.
ACKNOWLEDGMENT
We hereby appreciate Dr. Ahad Alizadeh for his kind assistance in the statistical analysis of this study.
REFERENCES
Acorda J, Yamada H, Ghamsari S (1995) Comparative evaluation of fatty infiltration of the liver in dairy cattle by using blood and serum analysis, ultrasonography and digital analysis. Vet Q 17:12-14.
Aviram M, Rosenblat M, Billecke S, Erogul J, Sorenson R, Bisgaier CL, Newton RS, La Du B (1999) Human serum paraoxonase (PON 1) is inactivated by oxidized low density lipoprotein and preserved by antioxidants. Free Radic Biol Med 26: 892–904.
Bionaz M, Trevisi E, Calamari L, Librandi F, Ferrari A, Bertoni G (2007) Plasma paraoxonase, health, inflammatory conditions and liver function in transition dairy cows. J Dairy Sci 90: 1740-1750.
Bobe G, Young JW, Beitz DC (2004) Invited review: pathology, etiology, prevention, and treatment of fatty liver in dairy cows. J Dairy Sci 87: 3105–3124.
Considine RV, Nyce MR, Allen LE, Morales LM, Triester S, Serrano J, Colberg J, Lanza-Jacoby S, Caro JF (1995) Protein Kinase C is increased in the liver of humans and rats with non-insulin-dependent diabetes mellitus: an alteration not due to hyperglycemia. J Clin Invest 95: 2938-44.
Drackley J (2000) Use of NEFA as a tool to monitor energy balance in transition dairy cows. Retrieved from: www.Livestocktrail.uiuc.edu.uploods/dairynet/pp: 1-3 [accessed 15 December 2015].
Farid AS, Honkawa K, Fath EM, Nonaka N, Horii Y (2013) Serum paraoxonase-1 as biomarker for improved diagnosis of fatty liver in dairy cows. BMC Vet Res 9:73.
Gruenberg, W (2015). Fatty Liver disease of cattle. In: Merck Veterinary Manual. Retrieved from: http://www.merckvetmanual.com/mvm/metabolic_disorders/hepatic_lipidosis/fatty_liver_disease_of_cattle.html [accessed 24 November 2015].
Kalaitzakis E, Panousis N, Roubies N, Giadinis N, Kaldrymidou E, Georgiadis M, Karatzias H (2010)
Clinicopathological evaluation of downer dairy cows with fatty liver. Can Vet J 51: 615-622.
Katoh N (2002) Relevance of apolipoproteins in the development of fatty liver and fatty liver-related peripartum diseases in dairy cows. J Vet Med Sci 64:293-307.
Katoh N and Kimura K (1989) Decreased protein kinase C activity in fatty liver from cattle. Am J Vet Res 50: 1489-92.
Kumon Y, Suehiro T, Ikeda Y, Hashimoto K (2003) Human paraoxonase-1 gene expression by HepG2 cells is downregulated by interleukin-1beta and tumor necrosis factor-alpha, but is upregulated by interleukin-6. Life Sci 73: 2807–2815.
Miyamoto T, Takahashi Y, Oohashi T, Sato K, Oikawa S (2005) Bovine paraoxonase-1 activities in serum and distribution in lipoproteins. J Vet Med Sci 67: 243-248.
Mudron P, Rehage J, Qualmann K, Sallmann HP, Scholz H (1999) A study of lipid peroxidation and vitamin E in dairy cows with hepatic insufficiency. Zentralbl Veterinarmed A 46: 219–224.
Nakagawa H, Oikawa S, Oohashi T, Katoh N (1997) Decreased serum lecithin: cholesterol acyltransferase activity in spontaneous cases of fatty liver in cows. Vet Res Commun 21:1–8.
Nouri M, Mahrooz A, Qujep D, Rashidi MR, Aslanabadi N (2009) Association between paraoxonase-1 activity and the extent of coronary stenosis. J Cardiovasc Thorac Res 1:1-8.
Rezaei Saber AP and Nazeri, M (2012) Fatty liver syndrome in dairy cattle: relationship between NEFA, Apo-A, Ammoniac, Tsh and total bilirubin serum values in this syndrome. J Anim Vet Adv 4: 58-62.
Samanc H, Kirovski D, Stojic V, Stojanovic D, Vujanac I, Prodanovic R, Bojkovic-Kovacevic S (2011) Application of the metabolic profile test in the prediction and diagnosis of fatty liver in Holstein cows. Acta Vet (Beograd) 61: 543-553.
Sevinc M, Basoglu A, Birdane F, Boydak M (2001) Liver function in dairy cows with fatty liver. Revue Med Vet 152: 297-300.
Shih DM, Gu L, Xia YR, Navab M, Li WF, Hama S, Castellani LW, Furlong CE, Costa LG, Fogelman AM, Lusis AJ (1998) Mice lacking serum paraoxonase are susceptible to organophosphate toxicity and atherosclerosis. Nature 394: 284-7.
Figures (1-9)
Fig 1. healthy liver Fig 2. Fatty liver, grade I (×10) Fig 3. Fatty liver, grade I (×40)
Fig 4. Fatty liver, grade II (×10) Fig 5. Fatty liver, grade II (×40) Fig 6. Fatty liver, grade III (×10)
Fig 7. Fatty liver, grade III (×40) Fig 8. Fatty liver, grade IV (×10) Fig 9. Fatty liver, grade IV (×40)
Figures (10-13)
Fig 10- The clinical accuracy of serum PON1 and PKC activities in dairy cows with fatty liver syndrome
Fig 11- The clinical accuracy comparisons between serum NEFA and BHB concentrations with PON1 and PKC
0 20 40 60 80 100
0 20 40 60 80 100
100-Specificity
S
e
n
s
it
iv
it
y PKC
Fig 12- Clinical accuracy comparisons between serum PON1 and the liver enzymes activities
Fig 13-. Clinical accuracy comparisons between serum PKC and the liver enzymes activities.
Table 1. Mean ± SD of the studied parameters in two groups of healthy cows and cows with fatty liver
Parameter
Mean ± Std. Deviation
Healthy (N=19) Fatty liver (N=18) P value
ALT (U/l) 18.4 ± 6.9 23.6 ± 26.4 0.409
AST (U/l) 77.6 ± 29.0 90.56 ± 66.97 0.728
ALP (U/l) 104.3± 42.4 123.9 ± 48.7 0.199
GGT (U/l) 20.2 ± 8.1 33.6 ± 18.0 0.008
NEFA (mmol/l) 0.51 ± 0.17 0.81 ± 0.21 <0.001
BHB (mmol/l) 0.36 ± 0.25 0.71 ± 1.83 0.415
PON1 (ng/ml) 104.6 ± 22.3 95.3 ± 14.8 0.143
Table 2. Correlation of the measured parameters in the control and test groups.
Correlations (Pearson Correlation)
Pathologic study
result ALT AST ALP GGT NEFA BHB PON1 PKC
Healthy (N=19)
PON1 0.326 -0.188 -0.324 -0.206 -0.108 0.111 1 0.090
PKC 0.189 -0.056 -0.320 -0.032 -0.578** -0.560* 0.090 1
Fatty liver (N=18)
PON1 0.337 0.167 -0.236 -0.347 -0.477* -0.332 1 0.727**
PKC 0.297 0.202 -0.287 0.026 -0.063 -0.137 0.727** 1
* Correlation is significant at the 0.05 level (2-tailed).
** Correlation is significant at the 0.01 level (2-tailed).
Table 3. Comparing different grades of fatty liver and healthy cows by Bayesian logistic regression based on all variables.
Intercept
grade 1 grade 2 grade 3 grade 4
OR P
Value OR
P
Value OR
P
Value OR P Value
0.93
(0.32-2.67) 0.894
1.11
(0.27-4.47) 0.888
2.24
(0.27-20.50) 0.484
0.30
(0.08-1.12) 0.104
ALT 0.99
(0.98-1.01) 0.522
1.02
(0.99-1.05) 0.197
1.01
(0.97-1.05) 0.688
0.98
(0.96-1.01) 0.172
AST 1.00
(1.00-1.003) 0.298
1.00
(0.99-1.00) 0.463
0.99
(0.98-1.00) 0.177
1.00
(1.00-1.01) 0.136
ALP 1.00
(1.00-1.002) 0.695
1.00
(1.00-1.00) 0.594
1.00
(0.99-1.00) 0.513
1.00
(1.00-1.00) 0.270
GGT 1.01
(1.00-1.02) 0.015
1.00
(1.00-1.01) 0.228
1.00
(0.98-1.03) 0.652
1.01
(0.99-1.02) 0.265
NEFA 1.71
(0.83-3.53) 0.173
1.15
(0.53-2.50) 0.737
1.89
(0.64-5.51) 0.272
1.89
(1.00-3.54) 0.071
BHB 0.39
(0.24-0.62) 0.001
0.78
(0.41-1.51) 0.481
1.13
(0.47-2.76) 0.791
0.95
(0.84-1.07) 0.435
PON1 1.00
(1.00-1.01) 0.233
1.00
(0.99-1.01) 0.753
0.99
(0.98-1.01) 0.453
1.00
(1.00-1.01) 0.261
PKC 0.99
(0.97-1.00) 0.035
0.99
(0.98-1.00) 0.226
0.99
(0.98-1.01) 0.566
1.00
(0.99-1.02) 0.498
Table 4. Comparing different grades of fatty liver and healthy cows by Bayesian logistic regression based on five important variables
Intercept
grade 1 grade 2 grade 3 grade 4
OR P
Value OR
P
Value OR
P
Value OR
P Value
0.7637
(0.34-1.77) 0.535
1.48 (0.61-
3.57) 0.402
0.89
(0.22-3.71) 0.878
0.61 (0.26-
1.45) 0.275
GGT 1.01
(1.00-1.02) 0.007
1.01
(1.00-1.01) 0.137
1.01 (0.99-
1.03) 0.487
1.01 (1.00-
1.02) 0.134
NEFA
2.10(1.09-4.05) 0.037
1.03
(0.48-2.19) 0.950
2.31 (0.88-
6.15) 0.114
1.92 (1.05-
3.56) 0.053
BHB
0.38(0.25-0.58) 0.000
0.58
(0.35-0.59) 0.052
0.77 (0.37-
1.62) 0.502
1.01 (0.93-
1.10) 0.728
PON1
1.00(1.00-1.01) 0.172
1.00
(0.99-1.01) 0.674
1.00 (0.99-
1.01) 0.929
1.00 (0.99-
1.00) 0.960
PKC
0.99(0.98-1.00) 0.031
0.99
(0.97-1.00) 0.032
0.99 (0.97-
1.01) 0.392
1.00 (0.99-
1.01) 0.977
The values in parenthesis are (2.5% - 97.5%) 95% credible interval.
Table 5. Comparing fatty liver different grades with healthy condition by Bayesian logistic regression based on selecting the best model
Intercept
grade 1 grade 2 grade 3 grade 4
OR P
Value OR
P
Value OR
P
Value OR
P Value
0.76 (0.33-
1.78) 0.535
1.27 (0.75-
2.09) 0.377
0.94 (0.57-
1.54) 0.825
0.61 (0.48-
0.77) 0.000
ALT - - 1.01 (1.00-
1.03) 0.103
-
- - -
AST - - - - 0.99 (0.99-
1.00) 0.043 - -
GGT 1.01 (1.00-
1.02) 0.007
1.01 (1.00-
1.01) 0.118 - -
1.01 (1.00-
1.02) 0.070
NEFA 2.10 (1.09-
4.04) 0.037 - -
2.76 (1.53-
5.09) 0.004
2.00 (1.33-
2.97) 0.003
BHB 0.38 (0.25-
0.58) 0.000
0.64 (0.41-
PON1 1.00 (1.00-
1.01) 0.172 - - - -
PKC 0.99 (0.98-
1.00) 0.031
0.99 (0.98-
1.00) 0.010 - - - -
The values in parenthesis are (2.5% - 97.5%) 95%credible interval.
Table 6. Comparing fatty liver and healthy condition by Bayesian logistic regression based on all data and regardless of grading
Intercept
OR P Value
1.15 (0.58- 2.23) 0.694
GGT 1.01 (0.10- 1.02) 0.122
NEFA 2.31 (1.10- 4.94) 0.036
BHB 0.92 (0.83- 1.03) 0.176
PKC 0.98 (0.97- 1.00) 0.024
The values in parenthesis are (2.5% - 97.5%) 95%credible interval.