Spectroscopic Diagnostics for Spatial Density Distribution of
Plasmoid by Pellet Injection in the Large Helical Device
Gen MOTOJIMA, Ryuichi SAKAMOTO, Motoshi GOTO, Hiroshi YAMADA and
LHD experiment group
National Institute for Fusion Science, 322-6 Oroshi-cho, Toki 509-5292, Japan
(Received 1 February 2009/Accepted 21 June 2009)
To investigate the behavior of a plasmoid consisting of pellet ablatant ionized by background plasma, two dimensional imaging measurements of high-speed spectroscopy have been developed using a fast camera in the Large Helical Device (LHD). The diagnostic system provides density distribution of the plasmoid. The density distribution is determined using the Stark broadening width of the Balmer-βline. Stark broadening profile can be evaluated from the intensity ratio measured using narrow-band optical filters having different full width at half maximum. Two dimensional images of the plasmoid are obtained by a fast camera connected to a bifurcated fiber scope with two objective lenses. An initial result shows that the plasmoid density is obtained within a factor of 2 by imaging measurements.
c
2010 The Japan Society of Plasma Science and Nuclear Fusion Research
Keywords: pellet injection, plasmoid, imaging measurement, spectroscopy, LHD, helical device DOI: 10.1585/pfr.5.S1033
1. Introduction
Solid hydrogen pellet injection is a primary technique used for efficient core plasma fueling in fusion devices. Pellet injection surely plays an important role in next-step devices such as ITER and it will also be a promising can-didate in a future fusion reactor for particle refueling. In particular, the importance of pellet injection is accentuated in the high central density operation required for a helical reactor [1].
When pellets are injected in a hot and magnetically confined background plasma, pellet particles are ablated with heat flux from the background plasma. The pellet is immediately surrounded by the neutral cloud generated by its ablation. The neutral cloud shields the pellet particles from the ambient background plasma. As a result, the neu-tral cloud is ionized and expanded in a direction parallel to the magnetic field lines. Here, the ionized pellet material is referred to as a plasmoid.
Pellet ablation and subsequent behavior of the plas-moid are key elements in determining the characteristics of pellet fueling. Extensive experiments have been per-formed with the objective of clarifying fueling characteris-tics of the pellet [2]. In particular, recent studies have fo-cused on the drift of the plasmoid [3]. The drift of the plas-moid could be attributed to anE×Bdrift that is caused by vertical polarization in the ablation cloud due to magnetic field gradient [4]. The behavior of the plasmoid follow-ing the ablation process has a primary effect on the pellet mass deposition. Therefore, understanding not only pellet ablation but also the subsequent behavior of the plasmoid
author’s e-mail: [email protected]
helps in optimizing pellet fueling. As for the understand-ing of pellet ablation, the identification of position of the pellet ablation is of great importance. In the LHD, a three dimensional observation system for stereoscopic analysis has been developed using a fast camera [5]. The posi-tion of pellet ablaposi-tion can be identified precisely by this method. Concerning the understanding of plasmoid behav-ior, the quantitative evaluation of the pellet particles trans-ferred by the plasmoid is of great importance. This ho-mogenization process has been demonstrated in numerical calculations. Moreover, the density and temperature of the plasmoid have been measured by spectroscopic diagnos-tics [6, 7]. However, a quantitative two dimensional eval-uation of plasmoid parameters has not yet been achieved. The objective of this study is to evaluate quantitatively the two dimensional density distribution in the plasmoid on the basis of imaging measurements with high-speed spectro-scopic diagnostics.
The rest of the paper is organized as follows. The principle of high-speed spectroscopic analysis is described in Section 2. In Section 3, the experimental setup is pre-sented. The initial experimental results are described in Section 4, and a summary is provided in Section 5.
2. Imaging Measurements of
High-speed Spectroscopy
The spectra of Balmer-lines and continuum are de-termined by the density and temperature of the plasmoid. Here, the emission from the background plasma can be ig-nored, because the density of the plasmoid is several hun-dred times greater than that of the background plasma.
The electron density can be determined from the Stark broadening profile of the Balmer-lines. In this study, it is noted that the spectra are estimated from the fitting with the theoretical data. In the theoretical data, the intensity of the spectra is calculated on the assumption of local ther-modynamic equilibrium [7]. The broadening profile of the spectra is calculated using Ref. [8].
Figure 1 shows examples of spectra around the Balmer-β line (center wavelength: 486.1 nm) in a wave-length range 470-500 nm for (a) low density (ne = 1.0× 10²²m−3) and (b) high density (n
e=1.0×10²³m−3). The same electron temperature of 1.0 eV is assumed for both cases (the value is based on the results from Ref. [7]). In the low density case, the line profile exhibits a peak, whereas in the high density case, the line profile is broader. It is found that the line profile depends on the electron den-sity. The characteristics enable an evaluation of the elec-tron density.
Stark broadening width can be estimated from the in-tensity ratio measured using narrow-band optical filters having different full width at half maximum (FWHM). The ratio of intensity with narrow bandwidth to that with wide
Fig. 1 Spectra of the Balmer-βwith a constant background for (a) low density (ne=1.0×10²²m−3) and (b) high density
(ne =1.0×10²³m−3). Intensity is expressed on a linear
scale.
bandwidth is expressed as
Inarrow
Iwide =
I(λ)×Tnarrow(λ) dλ
I(λ)×Twide(λ) dλ
, (1)
whereInarrowandIwide are the intensity with narrow band-width and that with wide bandband-width, respectively, and I
is the intensity of the spectrum. λis the wavelength, and
Tnarrow and Twide are the transmission rates with narrow bandwidth and with wide bandwidth, respectively. In the low density case, there is almost no difference in the in-tensity between wide and narrow bandwidths due to the peaked line profile, indicating that intensity ratio defined as intensity with narrow bandwidth to that with wide band-width approaches unity. In the high density case, the inten-sity difference becomes large due to a broader line profile, resulting that the ratio becomes smaller than unity.
In this study, we concentrate on the Balmer-βline to evaluate the density of the plasmoid, because the influence of the self-absorption effect on the Balmer-β line profile is negligible while the Balmer-αline profile is affected by it [7] and the Balmer-γline intensity is much small. The filter parameters suitable for various presumed densities (1022-1024m−3) and temperatures (0.9-1.2 eV) in a plas-moid are selected on the basis of the spectra estimated from the theoretical data. The density and temperature ranges are assumed based on results obtained from spectrometer measurements of plasmoids in LHD [7]. The filter com-bination of same central wavelength of 486.1 nm and dif-ferent FWHM of 5 nm and 20 nm prove the dependence on electron density very clearly independent of the electron temperature. Figure 2 shows dependence of the logarithm of electron density on the ratio of the intensity with FWHM of 5 nm to that with a wider FWHM of 20 nm. Using this filter combination, the ratio becomes approximately
portional to the logarithm of plasmoid density by a factor of about 2 under the assumption that the temperature is in the range from 0.9 to 1.2 eV. The ratio becomes smaller with increasing electron density. With this filter combi-nation, we can measure the plasmoid density in the range from 1022to 1024m−3.
3. Experimental Setup
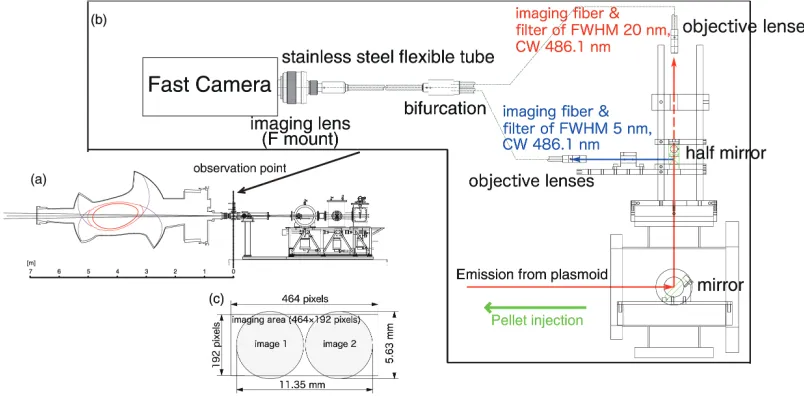
In this section, the spectroscopic diagnostics system for measuring the density distribution of a plasmoid is explained. Figure 3 (a) shows a horizontally elongated poloidal cross section of the LHD and an in-situ pipe gun type 10 barrel pellet injector. The nominal pellet size is 3.4 mmφ×3.4 mml. The typical pellet speed is 1000 m/s. Doppler shift can be neglected because the shift is only 10−3nm at 486.1 nm. The plasmoid can be observed just behind the pipe gun pellet injector and parallel to the injec-tion axis. In other words, the line of sight coincides with the pellet injection axis. The emission from the plasmoid is evenly divided with a half mirror, as shown in Fig. 3 (b). A bifurcated fiber scope with two objective lenses is used in this spectroscopic system [5]. The scope is com-posed of a pair of 50000 element quartz fiber scopes having a flexible protective tube made of stainless-steel. The over-all length is 15 m, and the bifurcated portions are about 5 m in length. Each objective lens, which has a field of view of 15 degrees, is used with the filters selected as described in Section 2. Wavelength characteristics of filters are not important in this study because the field of view in the ob-served area of plasmoid is about 2 degrees which lead to blue shift of about 0.4 nm at 486.1 nm. The optical filters are calibrated using a standard light source. Two images viewed from the same line of sight located just behind the pellet injector are obtained. The images are focused onto a
Fig. 3 (a) Cross-sectional drawing of the LHD vacuum vessel and fuelling pellet injector, which is equipped with 10 independent barrels, (b) enlarged view of observation point where the imaging measurements are performed, (c) imaging area of the sensor of the fast camera.
single fast camera (Vision Research Inc., Phantom V7) so that simultaneity is ensured. The observation of a identi-cal location is ensured by comparing the strength between the two images. The fast camera is equipped with a 12-bit self-resetting complementary metal oxide semiconductor (SR-CMOS) sensor. The selected frame rate and exposure time with a resolution of 464×192 pixels are 20000 fps and 2μs, respectively. One pixel corresponds to 4-5 mm, which is enough to reveal the density distribution in the plasmoid of several dozen cm in size. The pellet moves 2 mm during the exposure time. However, the movement is within 1 pixel, which does not affect the measurement. As shown in Fig. 3 (c), the bundled end is connected to an imaging lens that projects a pair of images onto the imag-ing sensor.
4. Results
Initial results of two dimensional imaging measure-ments conducted by high-speed spectroscopy were ob-tained. Figure 4 shows typical images of the plasmoid with the filters having (a) FWHM 5 nm and (b) FWHM 20 nm. Nonuniformity on the background is caused by the char-acteristics of the high speed camera. The pellet is injected into the NBI plasma with a central electron temperature of 1.5 keV. The intensity of the image obtained using a filter of FWHM 20 nm is stronger than that of the image ob-tained using a filter of FWHM 5 nm. It seems that the plas-moid expands in a direction parallel to the magnetic field line. Fig. 5 (a) shows the emission intensity distribution of two images in a direction perpendicular to the magnetic field line passing through the maximum intensity point. An intensity difference is observed in the pellet ablatant.
Fig. 4 Typical images of a plasmoid with the filters having (a) FWHM of 5 nm and (b) FWHM of 20 nm. Solid line shows the direction of the magnetic field line; dashed line shows the direction perpendicular to the magnetic field line.
Fig. 5 (a) Emission intensity distribution and (b) ratio of two images in a direction perpendicular to the magnetic field line passing through the maximum intensity point. Solid line represents the intensity with a FWHM of 20 nm, and dashed line represents the intensity with FWHM of 5 nm.
Fig. 6 (a) Density distribution in the plasmoid and (b) electron density distribution along the dashed line in a direction perpendicular to the magnetic field line passing through the maximum intensity point. Here, solid line shows the direction of the magnetic field line; dashed line shows the direction perpendicular to the magnetic field line.
passing through the maximum intensity point. In the re-gion around the center of the plasmoid, the minimum of the intensity ratio is about 0.5, which indicates a density of the order of 1023m−3. The ratio tends to unity with increas-ing distance from the center of the plasmoid, indicatincreas-ing a density of the order of 1022m−3. The center of plasmoid
is defined as the strongest intensity point of the emission. The emission observed at each pixel is assumed to have a representative density at each point. In future, the line-of-sight integration effect will be taken into account.
eval-uate the intensity ratio in the outer region of the plasmoid due to a temperature higher than that assumed due to the effect of the background plasma. However, it should be noted that the ratio in the unclear region seems to change monotonically. This might be due to the increment of in-tensity of the continuum caused by higher temperature. Therefore, further analysis is required.
Figure 6 (a) shows the density distribution in the plas-moid. The plasmoid has dimensions such that its width of roughly 10 cm is oriented perpendicular to the magnetic field line and its length of 20 cm is oriented parallel to the magnetic field line. The size of plasmoid is defined as the area with significant intensity of the emission. Plasmoid density is of the order of 1023m−3 except in the center region of the plasmoid. In the center region of the plas-moid, it seems that the density is lower. The reason might be attributed to the actual temperature range being lower than that assumed. However, further studies are necessary. Figure 6 (b) shows the electron density distribution in a direction perpendicular to the magnetic field line passing through the maximum intensity point. A maximum elec-tron density of 2.3±0.7×10²³m−3is observed.
5. Summary
To obtain the two dimensional plasmoid density dis-tribution quantitatively, imaging measurements of a high-speed spectroscopic system using a fast camera have been developed. The density of the plasmoid is evaluated us-ing the width of Stark broadenus-ing in the Balmer-β line. Stark broadening can be estimated comparing the diff er-ence in emission intensity from the plasmoid obtained us-ing narrow-band optical filters havus-ing different bandwidth. The most suitable pair of filters, which have the same cen-tral wavelength of 486.1 nm and different FWHM of 5 nm
and 20 nm, respectively, was selected on the basis of spec-tra estimated from the fitting with the theoretical data. As an initial result, the density distribution of the plasmoid was obtained within a factor of 2 by imaging measure-ments. Here, we show that the plasmoid density is of the order of 1023m−3. The plasmoid has a 10 cm width perpen-dicular to the magnetic field line and 20 cm length parallel to the magnetic field line. In future, the temperature dis-tribution of the plasmoid will be measured comparing the intensity of the Balmer-βline and the continuum. Further-more, the three dimensional distribution of the plasmoid density will be evaluated using tomography base on the assumption that the structure of the plasmoid is rotational axial-symmetry around the magnetic field line.
Acknowledgements
The authors would like to thank the LHD operation group. They are also grateful to Professor O. Motojima (General director of NIFS) for his continuous encourage-ment. This study was supported by NIFS08ULPP521.
[1] O. Mitarai et al., Proc. 22nd IAEA Fusion Energy Conference, Geneva, FT/P3-19 (2008); also available at http://www-pub.iaea.org/MTCD/Meetings/FEC2008/ft p3-19.pdf
[2] B. P´egouri´e, Plasma Phys. Control. Fusion49, R87 (2007). [3] P. T. Langet al., Phys. Rev. Lett.79, 1487 (1997). [4] V. Rozhanskyet al., Plasma Phys. Control. Fusion37, 399
(1995).
[5] R. Sakamotoet al., Rev. Scient. Inst.76, 103502 (2005). [6] D. H. McNeillet al., Phys. Fluids B3, 1994 (1991). [7] M. Goto et al., Plasma Phys. Control. Fusion49, 1163
(2007).
[8] C. Stehle and R. Hutcheon, Astron. Astrophys. Suppl. Ser.