Corresponding Author E-mail: [email protected]
650 | Page
Available online athttp://www.ijabbr.com
International journal of Advanced Biological and Biomedical Research
Volume 2, Issue 3, 2014: 650-658
Study of Placental Lactogen gene polymorphism and its association with milk
production traits in the Holstein cows
Mohammad Mahmoudzadeh1*, Mohammad Bagher Montazer Torbati 1, Homayoun Farhangfar 1, Arash Omidi 2
1
Department of Animal Science, Birjand University, PO. Box 331, Birjand, South Khorasan Province, I.R. Iran
2
Department of Animal Health Management, shiraz university, PO. Box 71345-1731 ,shiraz, Phars Province, I.R. Iran
Abstract
Placental Lactogen is a polypeptide hormone that is produced by the Placenta, also known as chorionic somatomammotropin hormone. It has both Growth Hormone and Prolactin activities on growth, lactation, and luteal steroid production. The objective of this study was to investigate the bovine Placental Lactogen (bPL) gene polymorphism of Holstein cows in Razavi Khorasan province. Blood samples were collected from 150 dairy cattle from six herds. DNA extraction was performed by salting out method. A fragment of 449 bp from intron 1 was amplified by the polymerase chain reaction and analyzed by single-strand conformation polymorphism to get the patterns of single-stranded DNA separated by native polyacrylamide gel electrophoresis and visualized by silver staining. Six genotypes were revealed with the frequencies of 0.283 (AA), 0.085 (AB), 0.292 (AC), 0.019 (CC), 0.292 (AD) and 0.029 (DD). The allele frequencies for A, B, C and D were 0.6179, 0.0425, 0.1651 and 0.1745, respectively.Chi-square test didn't confirm Hardy-Weinberg (H-W) equilibrium for this locus. Associations between polymorphisms and the traits studied were evaluated using the MIXED procedure of the SAS 9.1 software. Results showed that the polymorphism of the bPL gene is significantly is associated with fat percent (P=0.012).
Key words: polymorphism; bPL; SSCP; milk production traits; Holstein cow.
Introduction
651 | Page
placental lactogen (PL) being recorded simultaneously with the moment of maximum intensity of mammogenesis. The first ruminant PL to be described was that of the goat (Buttle et al., 1972). Shortly after the discovery of PL in the goat it was discovered in sheep placental tissue (forsyth, 1974; Kelly et al., 1974) and was soon purified to homogeneity (Chan et al., 1978; Hurley et al., 1977; Martal and Djiane, 1975). Placental lactogen or chorionic somatomammotropin hormone 1 (CSH1), is a polypeptide hormone found in the mammalian placenta (Anthony et al., 1995). In sheep, PL has more structural similarity to ovine prolactin than ovine GH and it has been shown to exhibit somatogenic actions both in vitro and in vivo. This is why the term chorionic somatomammotropic hormone is also used to describe PL, especially in gene databases (e.g. GenBank). Administration of recombinant oPL stimulates weight gain in GH-deficient dwarf rats with a similar or superior potency to bovine GH (bGH) (Singh et al., 1992). Recombinant bPL has been shown to have galactopoietics properties in dairy cattle (Byatt et al., 1992). These data suggest that PL also has actions similar those of GH. In other litter bearing species such as rats and mice the concentration of placental lactogen is directly related to litter size (Soares and Talamantes, 1983). Binding to the Prolactin (PRL) receptor is one of the principal biochemical characteristics of bPL. The lactogenic activity of bPL is almost equipotent to that of highly purified ovine PRL (Schellenberg and Friesen, 1982). Because bPL has structural and functional similarities to bPRL, it may have evolved from the ancestral gene of the PRL lineage (Soares et al., 1998). According to research to date, bPL is involved in the regulation of ovarian function, mammogenesis, fetal growth and pregnancy-associated maternal adaptation. Although there have been many studies on the physiological roles of PL in rodents, it is sometimes difficult to translate these findings to ruminants. In ruminants, research has been carried out mainly using sheep and goats. Bovine placenta and bPL have characteristics that are different from those of ovine and caprine species, whereas the histological architecture of the placenta, molecular structure of PL and plasma PL profiles are closely related in sheep and goats (Takahashi, 2006). Bovine Placental Lactogen is located on chromosome 23 and spans approximately 12.5 kb, contains five exons and encodes a predictive preprohormone of 236 amino acids with a signal peptide of 36 amino acids (Schuler et al., 1988; Kessler and Schuler, 1991). Until now very little work has been done on the polymorphism of bPL gene and also the association of its variants with milk production traits. It has been shown that the SNP within exon 2 of bPL (NT7409(T-C)) is associated with milk production traits in Holstein dairy cattle (Zhang et al., 2009). Based on the important roles in the growth and development of mammary gland (mammogenesis), synthesis of milk (lactogenesis), and maintenance of milk secretion (galactopoiesis), bPL is considered a strong candidate gene for milk production traits in dairy cattle. The objectives of the current study were to detect polymorphisms of bPL and determine association of such polymorphisms with milk production traits in Holstein cattle of Razavi Khorasan province.
MATERIAL AND METHODS
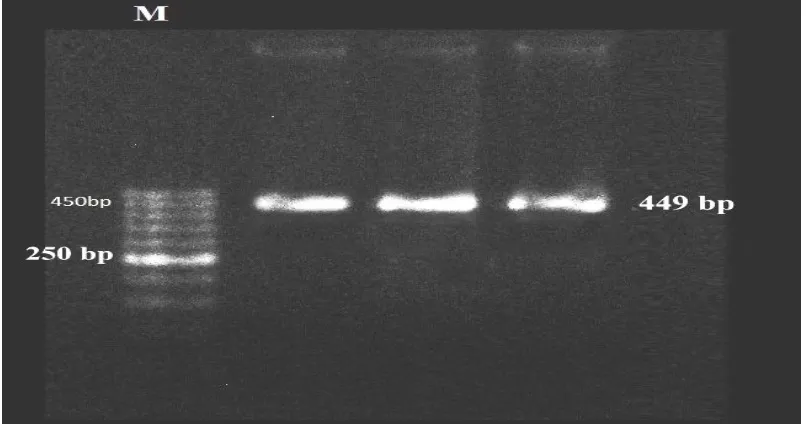
Blood samples collection and DNA processing: Blood samples of 150 Iranian Holstein cows were collected randomly from six Iranian Holstein cattle farms in Razavi Khorasan. The blood samples were kept to isolated in -20 °C. Genomic DNA was isolated from blood samples by the salting out method (Iranpur and esmailzadeh, 2010) and the quality and quantity of DNA was investigated by Nanodrop set and loaded on a 1% agarose gel. Polymerase chain reactions (PCR) were carried out in 25 µl volume including 250 ng of genomic DNA, 10 pmol each primer (Fig 1) and 12µl Master Mix (sinaclone company, Iran). The PCR protocol was 95 °C for 3 min, followed by 35 cycles of 95° C for 30 s, annealing for 40 s and 58°C for 30 s, 72 °C for 1min with a final extension at 72°C for10 min. 1% agarose gel and Marker (500bp, Fermentaz company) was used to investigation quality of the PCR products (Fig 2).
Genotyping: The PCR products were genotyped by single-strand conformation polymorphism (SSCP) to
652 | Page
glycerol) and then denatured at 95°C for 10 min, followed by a rapid chill on ice for 10min. The denatured PCR products were electrophoresed on 10% polyacrylamide gels for 18 h at 8 V/cm and stained by 0.2% AgNO3 for 20min. Genotypes were recorded according to band patterns.
Statistical analysis: the program POPGENE 32 (Francis et al., 1999) was used to test the number of alleles per locus (N), effected number of alleles (Ne), expected (He) and observed (Ho) heterozygosity, and departures from Hardy–Weinberg equilibrium (HWE). The relationship between different genotypes and selected milk traits, which include milk yield (kg), the protein and fat content (%) were analyzed using Mixed procedure of SAS9.1 package (Cary, 2003). Tukey Kramer test were used to compare the mean values of the attributes traits for the different genotypes. The statistical model is as follows:
Milkijkmno= µ+ Cowik+ Gj+ Hk+ Ym+ Sn+ DIM+ qDIM+ Po+ SCSij+ FPij+ PPij+ eijkmno
PPijkmno= µ+ Cowik+ Gj+ Hk+ Ym+ Sn+ DIM+ qDIM+ Po+ Milkij+ FPij+ SCSij+ eijkmno
FPijkmno= µ+ Cowik+ Gj+ Hk+ Ym+ Sn+ DIM+ qDIM+ Po+ Milkij+ ScSij+ PPij+ eijkmno
Where:
Milki- monthly milk yields for each of cow i,
PPi and FPi- protein and fat percentage respectively.
µ- means of population,
Cowi- The fixed effect of cow i,
Gj- the fixed effect of genotype j,
Hk- the fixed effect of herd k, (k=1,2,3,4,5,6).
Ym- the fixed effect of calving year m.
Sn- the fixed effect of calve season n, (n=1,2,3,4)
DIM- the number of lactation days.
qDIM- square of the number of lactation days. Po- parity O of cow, (O= 2,3,4,5,6,7)
SCSij- somatic cell score of cow i and genotype j.
Eijkmno- the random errore.
RESULTS
Six genotypes were revealed with the frequencies of 0.2830 (AA), 0.0849 (AB), 0.2924 (AC), 0.0190 (CC), 0.2924 (AD) and 0.0283 (DD). The allele frequencies for A, B, C and D were 0.6179, 0.0425, 0.1651 and 0.1745, respectively.The chi-square test confirmed that this population is not in H-W equilibrium for the studied locus (Fig 3 and Table1). Genetic diversity parameters such as observed and expected homozygosity and heterozygosity, Observed number of alleles (Na), Effective number of alleles (Ne), Shannon and Nei index, obtained from POPGENE are shown in table 2. Another criteria is used for loss of heterozygosity in the population is the fixation index that is referred to as the inbreeding coefficient (Wright, 1977). If the fixation index value is negative, indicating that the loci alleles have low correlation with each other and is high the heterozygosity in it locus, values of the fixation index was showed in table 3.
653 | Page
DISCUSSION
Polymorphism was observed in 449 bp fragment from intron 1 of bPL gene in Holstein cattle of Razavi Khorasan. Zhang and et al (2009), was found two SNPs, NT7409(T–C) and NT11246(G–A) and showed that the SNP within exon 2 of bPL (NT7409(T–C)) is associated with two milk production traits (milk and protein yields), and this provided further evidence that bPL could be a major gene-controlling milk production trait in Holstein dairy cattle. The fatty acids in milk arise from two sources, uptake from circulation and de novo synthesis within the mammary epithelial cells. Short-chain fatty acids (4 to 8 carbons) and medium-chain fatty acids (10 to 14 carbons) arise almost exclusively from de novo synthesis. Long-chain fatty acids (>16 carbons) are derived from the uptake of circulating lipids, and fatty acids of 16 carbons in length originate from both sources. In ruminants, about one-half of the milk fatty acids (molar percent) are derived from de novo synthesis. Whereas glucose is used for de novo synthesis by nonruminants, ruminants utilize acetate produced in rumen fermentation of carbohydrates as the major carbon source. In addition, β-hydroxybutyrate, produced by the rumen epithelium from absorbed butyrate, provides about one half of the first four carbons of de novo synthesized fatty acids in the ruminant. Preformed fatty acids taken up by the mammary gland and directly used for milk fat synthesis are derived from circulating lipoproteins and nonesterified fatty acids (NEFA) that originate from the absorption of lipids from the digestive tract and from the mobilization of body fat reserves, respectively. In ruminants, fatty acids in milk fat that are taken up from circulation are derived predominantly from the intestinal absorption of dietary and microbial fatty acids (Bauman and Grinari, 2003). bPL stimulated a small but significant increase in feed intake. This acute increase in feed intake seemed to be a specific effect of bPL because it takes several weeks of treatment with bST before DMI is elevated (Bauman et al., 1985).
Conclusion
According to discussion, probability, feed intake increases Leads to increased fermentation activity of bacterial fermentation in the rumen, As a result, Leads to increased volatile fatty acids in bovine blood circulation and therefore, leads to Increased de novo synthesis of fatty acids and Increased the amount of milk fat. Moreover, placental lactogen is Causes to dimerization of STAT5A gene and it's causes to Transcription of OPN and UTMP gene, That this genes affect to the milk production (Khatib et al., 2008).
Acknowledgements
The authors are indebted to Dairy herd corporation of khorasan for data related to cows. The authors declare that there is no conflict of interest that would prejudice the impartiality of this scientific work.
Reference
Anthony, R. V., Pratt, S. L., Liang, R and Holland, M. D. (1995). Placental–fetal hormonal interactions: impact on fetal growth. J Animal Sci, 73: 1861–1871.
Bauman, D. E and Grinari, J. M. (2003). Nutritional regulation of milk fat synthesis. Annu Rev Nutr, 23: 203–227.
Bauman, D. E., Eppard, P. J., De Geeter, M. J and Lanza, G. M. (1985). Responses of high-producing dairy cows to long-term treatment with pituitary somatotropin and recombinant somatotropin. J Dairy Sci, 68: 1352-1362.
654 | Page
Byatt, J. C., Warren, W. C., Eppard, P. J., Staten, N. R., Krivi, G. G and Collier, R. J. (1992). Ruminant placental lactogens: structure and biology. J Animal Sci, 70: 2911–2923.
Chan, J. S. D., Robertson, H. A and Friesen, H. G. (1976). The purification and characterization of ovine placental lactogen. Endocrinology, 98: 65-.76.
Forsyth, I. A. (1974). The comparative study of placental lactogenic hormones: A review in: Lactogenic Hormones, Fetal Nutrition and Lactation. Wiley and Sons, New York, USA.
Hartl, D. L and Clark, A. G. (1997). Principles of population genetics. Sinauer Associates, Inc. Publishers, Sunderland.
Hurley, T. W., Handwerger, S and Fellows, R. E. (1977). Isolation and structural characterization of ovine placental lactogen. Biochem, 16: 5598-5604.
Iranpur, M. V and Esmailizadeh, A. K. (2010). Rapid extraction of high quality DNA from whole blood
stored at 4ºC for long period. Verified 30 May 2012 from
http://www.natureleads.com/protocols/cache/2012_03_31_06_37_38_PM.htm.
Kelly, P. A., Robertson, H. A and Friesen, H. G. (1974). Temporal pattern of placental lactogen and progesterone secretion in sheep. Nature, 248: 435-437.
Kessler, M. A and Schuler, L. A. (1991). Structure of the bovine placental lactogen gene and alternative splicing of transcripts. DNA Cell Biol, 10: 93-104.
Khatib, H., Monson, R. L., Schutzkus, V., Kohl, D. M., Rosa, G. M and Rutledge, J. J. (2008). Mutations in the STAT5A gene are associated with embryonic survival and milk composition in cattle. J Dairy Sci, 91: 784-793.
Levene, H. (1949). On a matching problem in genetics. Ann Math Statis, 20: 91-94.
Martal, J and Djiane, J. (1975). Purification of a lactogenic hormone in sheep placenta. Bioch Biophys Res Comm, 65: 770-778.
Nei, M. (1973). Analysis of gene diversity in subdivided populations. Proc Natl Acad Sci USA, 70: 3321-3323.
Cary, N. C. (2003). SAS Institute Inc. version 9.1.3: Administrator Guide for SAS 9.1.3 Foundation for Microsoft Windows.
Schellenberg, C and Friesen, H. G. (1982). The bioassay of bovine placental lactogen. Endocrinology, 111: 2125-2128.
Schuler, L. A., Shimomura, K., Kessler, M. A., Zieler, C. G and Bremel, R. D. (1988). Bovine placental lactogen: Molecular cloning and protein structure. Biochem, 27: 8443-8448.
Shannon, C. E. (1948). The mathematical theory of communication. Bell Sys Tech, 27: 379–423.
655 | Page
Soares, M. J., Müller, H., Orwig, K. E., Peters, T. J and Dai, G. (1998). The uteroplacental prolactin family and pregnancy. Biol Reprod, 58: 273–284.
Soares, M. J and Talamantes, F. (1983). Genetic and litter size effects on serum placental lactogen in the mouse. Biol Reprod, 29: 165-171.
Takahashi, T. (2006). Biology of the prolactin family in bovine placenta. I. Bovine placental lactogen: Expression, structure and proposed roles. Anim Sci, 77: 10–17.
Warwick, E. J. (1979). Breeding and Improvement of farm animals,7th Edition. TATA McGraw-Hill publishing company.
Wright, S. (1977). Evolution and the Genetics of Populations. Experimental Results and Evolutionary Deductions, Vol 3, The University of Chicago Press Book, USA.
Francis, C. Yeh., Boyle, T., Rongcai Zhihong, Ye. Y and Mao Xiyan, J. (1999). Popgene 32. Version 1.31. Quick user guide. Available from: http://www.ualberta.ca/~fyeh.
656 | Page
Figure legends
Figure 1: The selection subregion of primers and their sequencing
Figure 2: Quality of PCR products for bPL gene, identified by Marker (500bp from
657 | Page
Figure3: genotypes derived from the electrophoresis of Polyacrylamide gel for bPL gene.
Table 1: the frequencies of Allele and genotypes for bPL gene
Genotype frequency (%)
Allele frequency(%) X2 DD CC AD AC AB AA D C B A 21.12 02.83 29.24 01.90 29.24 08.49 28.30 17.45 16.51 04.25 61.79
X2 =chi-square for HW equilibrium
Table 2: Genetic diversity values for bPL gene
bPL gene
Parameters of genetic diversity 4 Na 2.2658 Ne 0.6698 Obs_Het 0.3302 Obs_Hom 0.5613 Exp_Het 0.4387 Exp_Hom 0.5587 Nei 1.0336 I
658 | Page
Table 3: The fixation index for bPL gene
Value1 Allel 0.4185 A 0.0443 B 0.0609 C 0.0150 D 0.1990 Total 1
Values of negative, indicating that is heterozygosity in it locus
Table 4: Statistical values of the three milk production traits and it's association with bPL gene. bPL gene traits P value RMSE mean 0.1098 19.5248 36.6561 MY1 0.0120 0.5293 3.3860 FP2 0.6348 0.4025 3.2451 PP3
MY= milk yield (kg); FP= fat percentage; PP= protein percentage; RMSE= root mean square error 1
The milk yield not showed a significant association with genotypes P>0.05. 2 Fat percentage was showed a significant association with genotypes P<0.05. 3
The protein percentage not showed a significant association with genotypes P>0.05.
Table 5: Comparison between different genotypic values on the three milk production traits
Multiple comparison1 (µ ± s.e.) traits AB-DD AB-CC AB-AD AB-AC AA-AB
2.7936 ± 3.5739 (P=0.9693) -4.6257 ± 4.1237
(P=0.8700) -0.2788 ± 2.6393
(P=1.0000) 2.7874 ± 2.5900
(P=0.8884) -0.2139 ± 2.6021
(P=1.0000) MY
0.2180 ± 0.0893 (P=0.1631) 0.3561 ± 0.1028
(P=0.0136)*2 0.1945 ± 0.0659
(P= 0.0523) 0.1358 ± 0.0647
(P= 0.3062) -0.1532 ± 0.0650
(P=0.1929) FP
-0.0662 ± 0.0674 (P=0.9214) -0.0381 ± 0.0777
(P=0.9963) -0.0576 ± 0.0498
(P=0.8549) -0.0694 ± 0.0489
(P=0.7154) 0.0340 ± 0.0491
(P=0.9819) PP
MY= milk yield (kg); FP= fat percentage; PP= protein percentage 1
Comparison between different genotypic values of MY, FP and PP for bPL gene 2