S H O R T R E P O R T
Open Access
Negative and positive control ranges in the
bacterial reverse mutation test: JEMS/BMS
collaborative study
Masayuki Kato
1*, Kei-ichi Sugiyama
2, Toshiro Fukushima
3, Yasuyoshi Miura
3, Takumi Awogi
4, Shigetomo Hikosaka
5,
Kumiko Kawakami
6, Madoka Nakajima
7, Masato Nakamura
8, Hajime Sui
6, Kumiko Watanabe
9and Atsushi Hakura
10Abstract
A large-scale study was conducted by multiple laboratories affiliated with the Japanese Environmental Mutagen Society and the Bacterial Mutagenicity Study Group to investigate possible proficiency indicators for the bacterial reverse mutation test with a preincubation procedure. Approximately 30 laboratories generated negative and positive control count data and dose-response curves of the positive control articles for the bacterial reverse mutation test, with assays conducted annually from 2013 to 2016. Overall, the majority of the negative and positive control counts forSalmonellaTyphimurium strains TA100, TA1535, TA98, and TA1537, andEscherichia colistrain WP2uvrA, with and without S9 mix, were within the range of the means ±2× standard deviation. The negative counts were normally distributed (strains TA100, TA98, and WP2uvrA) or followed Poisson distribution (strains TA1535 and TA1537), and the positive control counts for all strains were approximately normally distributed. In addition, the distribution of the negative and positive control counts was relatively constant over the 4 years. The number of revertant colonies increased in a dose-dependent linear or exponential fashion up to the recommended doses for the respective positive control articles in Japan. These data are valuable for
determining the acceptance criteria and an estimation of the laboratory proficiency for the bacterial reverse mutation test.
Keywords:Bacterial reverse mutation test, Validation study, Negative control range, Positive control range
Background
The bacterial reverse mutation test, known as the Ames test, is often used to identify and characterize the mutagenicity of chemicals in basic research, and to examine the safety of industrial products prior to approval by regulatory agencies [1–6]. The structural alerts for mutagenicity derived from the results are also used by regulatory agencies to predict mutagenic impur-ities using in silico analysis according to the International Council for Harmonisation of Technical Requirements for Pharmaceuticals for Human Use M7 guideline [7]. The bacterial reverse mutation test is an integral component of genotoxicity tests performed as part of the regulatory
requirements in accordance with the principles of Good Laboratory Practice, and therefore, it is important to use appropriate indicators for evaluating and demonstrating laboratory proficiency in the test. For this purpose, the negative and positive control ranges, along with the dose-response relationships of the positive control articles, are considered to be promising candidates.
To refine and maintain the data quality and experi-mental techniques used for the reverse mutation test, the Japanese Environmental Mutagen Society (JEMS)/ Bacterial Mutagenicity Study Group (BMS) collabora-tively conducted validation studies over two 4-year periods (2006–2009 and 2013–2016). In this paper, we report the results obtained from the four JEMS/BMS validation studies conducted annually during the period 2013–2016. The number of participating laboratories per year was 36 in 2013, 30 in 2014, 27 in 2015, and 26
* Correspondence:[email protected]
1CMIC Bioresearch Center, CMIC Pharma Science Co., Ltd., Hokuto-shi,
Yamanashi 408-0044, Japan
Full list of author information is available at the end of the article
© The Author(s). 2018Open AccessThis article is distributed under the terms of the Creative Commons Attribution 4.0 International License (http://creativecommons.org/licenses/by/4.0/), which permits unrestricted use, distribution, and reproduction in any medium, provided you give appropriate credit to the original author(s) and the source, provide a link to the Creative Commons license, and indicate if changes were made. The Creative Commons Public Domain Dedication waiver (http://creativecommons.org/publicdomain/zero/1.0/) applies to the data made available in this article, unless otherwise stated.
in 2016. Data were obtained for the negative and positive control counts and the dose-response curves of the respective positive control articles using the five tester strains with and without S9 mix. The positive control articles (AF-2, 2-(2-furyl)-3-(5-nitro-2-furyl) acrylamide; SA, sodium azide; 9AA, 9-aminoacridine hydrochloride; and 2AA, 2-aminoanthracene) and bacterial strains (Salmonella enterica subsp. enterica serovar Typhimurium strains TA100, TA1535, TA98, and TA1537, and Escherichia coli strain WP2uvrA)
used were those recommended in the Organisation for Economic Co-operation and Development (OECD) guideline for the testing of chemicals 471 [6].
Materials and methods
Chemicals and materials
An Ames Test Positive Control AM Multi-set (Lot number M0048, Wako Pure Chemical Industries, Ltd., Osaka, Japan) was used to provide the positive con-trols. The set comprised 2-(2-furyl)-3-(5-nitro-2-furyl)
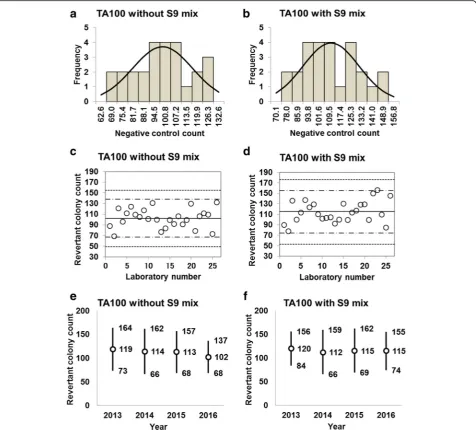
Fig. 1Negative control counts, and their subsequent analysis, forSalmonellaTyphimurium strain TA100 with and without S9 mix. Histograms show the negative control counts, and the curves indicate the expected values calculated based on the assumption that the negative control counts follow a normal distribution, without (a) and with (b) S9 mix. Scatter plots showing the negative control counts generated by each participating laboratory without (c) and with (d) S9 mix are also shown, where the inner horizontal lines (−˙-) indicate the mean ± 2× standard deviation (SD), and outer horizontal lines (−–) indicate the mean ± 3× SD. The data shown in panels (a) to (d) are taken from the study conducted in 2016. The mean ± 2× SD values for the negative control counts for each individual year without (e) and with (f) S9 mix are also presented
acrylamide (AF-2, purity of 99.7%), sodium azide (SA, purity of 100.0%), 9-aminoacridine hydrochloride (9AA, purity of 99.4%), and 2-aminoanthracene (2AA, purity of 96.7%). AF-2, 9AA, and 2AA were dissolved in dimethyl sulfoxide (DMSO, purity of 100%; Wako Pure Chemical Industries), while SA was dissolved in purified water.
S9 fraction, prepared from phenobarbital/5,6-benzofla-vone-pretreated male Sprague-Dawley rat liver, was purchased from Oriental Yeast Co., Ltd. (Tokyo, Japan) or Kikkoman Biochemifa Co. (Chiba, Japan). Different lots of
S9 fraction were used throughout the 4-year study. The S9 mix used in the assays consisted of 10% (v/v) S9 fraction (~ 1.0 mg protein/plate), 100 mM Na2HPO4/NaH2PO4,
8 mM MgCl2, 33 mM KCl, 4 mM NADP, 4 mM NAD,
and 5 mM glucose-6-phosphate.
The S. Typhimurium top agar consisted of Bacto agar (0.6% (w/v) final concentration) and NaCl (0.5% (w/v) final concentration) dissolved in purified water supplemented with 0.05 mM L-histidine and 0.05 mM D-biotin. The E. coli top agar was the same as that used forS. Typhimurium, minus the D-biotin. Minimum
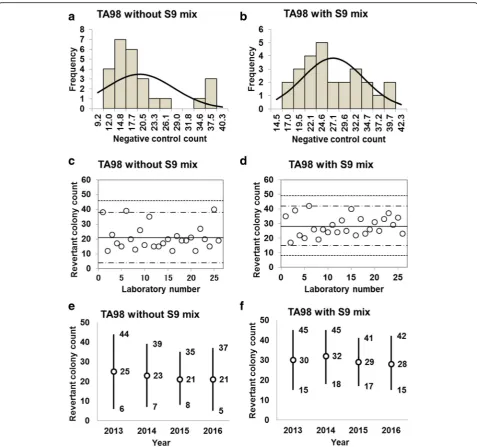
Fig. 2Negative control counts, and their subsequent analysis, forSalmonellaTyphimurium strain TA98 with and without S9 mix. Scatter plots showing the negative control counts generated by each participating laboratory without (c) and with (d) S9 mix are also shown, where the inner horizontal lines (−˙-) indicate the mean ± 2× standard deviation (SD), and outer horizontal lines (−–) indicate the mean ± 3× SD. The data shown in panels (a) to (d) are taken from the study conducted in 2016. The mean ± 2× SD values for the negative control counts for each individual year without (e) and with (f) S9 mix are also presented
glucose agar plates were obtained from Oriental Yeast Co. or Kyokuto Pharmaceutical Industrial Co. (Tokyo, Japan).
Bacterial strains
The tester strains used were S. Typhimurium TA98 (hisD3052/rfa/ΔuvrB/pKM101), TA100 (hisG46/rfa/ΔuvrB/ pKM101), TA1535 (hisG46/rfa/ΔuvrB), and TA1537 (hisC3076/rfa/ΔuvrB), and E. coli WP2uvrA (trpE/uvrA). These strains are recommended for use in the Ames test by Organisation for Economic Cooperation and Development (OECD) Guideline 471 [6], and this combination of strains
is used in the majority of Japanese laboratories. Phenotypic characteristics of each of the strains, such as amino acid deficiencies (hisfor theSalmonellastrains andtrp for the E. colistrain), sensitivity to crystal violet (rfa), ampicillin re-sistance (pKM101), and sensitivity to ultraviolet light (ΔuvrBfor theSalmonellastrains andΔuvrAfor theE. coli strain), were confirmed as described previously [4,5, 8,9] prior to use in each laboratory. In addition, the frozen stock culture of each strain was also confirmed to have responses within each laboratory’s historical ranges to the negative and positive controls in advance of testing.
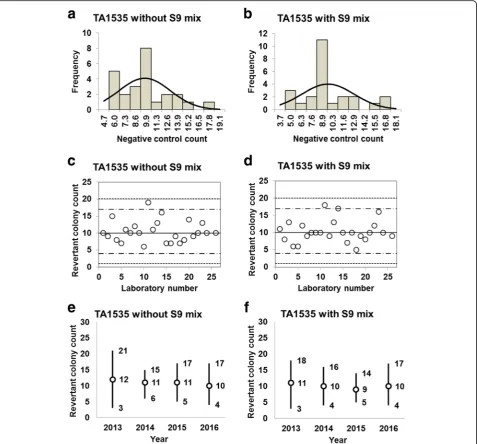
Fig. 3Negative control counts, and their subsequent analysis, forSalmonellaTyphimurium strain TA1535 with and without S9 mix. Scatter plots showing the negative control counts generated by each participating laboratory without (c) and with (d) S9 mix are also shown, where the inner horizontal lines (−˙-) indicate the mean ± 2× standard deviation (SD), and outer horizontal lines (−–) indicate the mean ± 3× SD. The data shown in panels (a) to (d) are taken from the study conducted in 2016. The mean ± 2× SD values for the negative control counts for each individual year without (e) and with (f) S9 mix are also presented
Assay conditions
The reverse mutation test was conducted using a preincu-bation procedure according to the members’ own assay conditions, which had been established or confirmed to be valid through JEMS/BMS validation studies or seminars.
To obtain bacterial cells in early stationary phase, fro-zen stock cultures of each strain were inoculated into a conical flask or L-tube containing nutrient broth medium (2.5% (w/v); Oxoid nutrient broth No. 2, Oxoid Ltd., Hampshire, United Kingdom), and then either stored for > 3 h at approximately 4 °C prior to culture, or cultured immediately in a shaking incubator for be-tween 7 and 10 h at 37 °C. Depending on the laboratory, the shaking incubators were set at various speeds (e.g. 140 rpm for a 100-mL conical flask, or 50 strokes/min for a 25-mL L-tube). The cell densities of each culture were confirmed to be > 1 × 10⁹ cells/mL by measuring
optical density at 660 nm. For the assays carried out with S9 mix, 0.1 mL of the negative (vehicle) or positive control solution was added to a test tube, to which 0.5 mL of S9 mix and 0.1 mL of bacterial culture were added. For assays carried out in the absence of S9 mix, 100 mM sodium phosphate buffer (pH 7.4) was used in place of S9 mix. After mixing, the test tubes were prein-cubated for 20 min at 37 °C in a shaking water bath (between 70 and 150 strokes/min). Following preincuba-tion, a 2-mL volume of pre-warmed (45 °C) top agar was added to each tube and mixed. Each mixture was then immediately poured onto the surface of minimal-glucose agar plates. After the top agar hardened, plates were in-cubated for 48 h at 37 °C. Each assay was conducted in duplicate (two plates per dose).
Water and DMSO were used as the negative (vehicle) controls for SA and for the other positive control
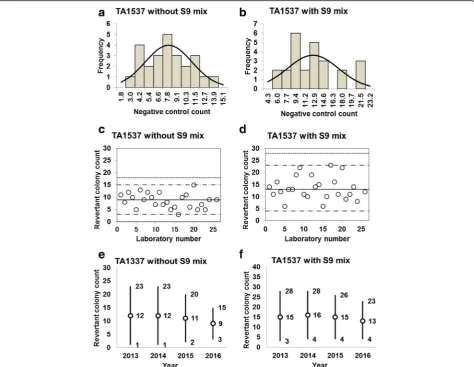
Fig. 4Negative control counts, and their subsequent analysis, forSalmonellaTyphimurium strain TA1537 with and without S9 mix. Scatter plots showing the negative control counts generated by each participating laboratory without (c) and with (d) S9 mix are also shown, where the inner horizontal lines (−˙-) indicate the mean ± 2× standard deviation (SD), and outer horizontal lines (−–) indicate the mean ± 3× SD. The data shown in panels (a) to (d) are taken from the study conducted in 2016. The mean ± 2× SD values for the negative control counts for each individual year without (e) and with (f) S9 mix are also presented
Fig. 5Negative control counts, and their subsequent analysis, forSalmonellaTyphimurium strain WP2uvrAwith and without S9 mix. Scatter plots showing the negative control counts generated by each participating laboratory without (c) and with (d) S9 mix are also shown, where the inner horizontal lines (−˙-) indicate the mean ± 2× standard deviation (SD), and outer horizontal lines (−–) indicate the mean ± 3× SD. The data shown in panels (a) to (d) are taken from the study conducted in 2016. The mean ± 2× SD values for the negative control counts for each individual year without (e) and with (f) S9 mix are also presented
Table 1Statistics for negative control data obtained in this study
Statistics TA100 TA98 TA1535 TA1537 WP2uvrA
-S9 +S9 -S9 +S9 -S9 +S9 -S9 +S9 -S9 +S9
No. of data 26 26 26 26 25 25 25 25 23 23
Mean 102 115 21 28 10 10 9 13 24 28
SD 17.34 20.06 8.23 6.66 3.10 3.17 2.95 4.60 4.87 7.33
Variance 312.57 418.66 70.36 46.06 10.01 10.48 9.08 22.01 24.75 56.23
Min 69 78 12 17 6 5 3 6 14 17
Max 132 156 40 42 19 18 15 23 33 47
Kurtosis −0.63 −0.64 0.58 −0.73 0.88 0.64 −0.63 −0.24 0.04 0.29
Skewness −0.09 0.30 1.22 0.40 0.98 0.80 0.15 0.54 −0.25 0.82
2SD- 68 74 5 15 4 4 3 4 14 13
2SD+ 137 156 37 42 17 17 15 23 33 43
3SD- 50 54 −4 8 1 1 0 0 9 6
3SD+ 154 175 46 48 20 20 17 27 38 50
Minminimum count,maxmaximum count,2SD−mean−2× standard deviation,2SD+mean + 2× standard deviation,3SD−mean−3× standard deviation,3SD+mean + 3× standard deviation
articles, respectively. The positive control articles and doses used for each strain are listed in Additional file1: Table S1. The maximum dose for each positive control was as recommended by the Japan Industrial Safety and Health Association [9]. The number of revertant col-onies induced at the highest doses were used as the posi-tive control counts for the assay.
Data analysis
Mean and standard deviation (SD) were calculated from the experimental data generated by each laboratory using Excel (Microsoft, Redmond, WA, USA). The D’Agostino-Pearson and Kolmogorov-Smirnov tests were performed to evaluate the normality of data distribution,
also using Excel [10]. Ap-value < 0.05 was considered to be statistically significant.
Results and discussion
Negative (solvent) control data
Histograms, along with their corresponding estimated frequency curves generated under the assumption that the counts were normally distributed, were generated from the negative control counts (the mean number of revertant colonies/plate) in the absence and presence of S9 mix for strains TA100 (Fig. 1a and b), TA98 (Fig. 2a
and b), TA1535 (Fig.3a and b), TA1537 (Fig. 4aandb), and WP2uvrA(Fig.5aand b). These data were provided by 23–26 participating laboratories in 2016.
Fig. 6Positive control counts, and their subsequent analysis, forSalmonellaTyphimurium strain TA100 with and without S9 mix. Histograms show the negative control counts, and the curves indicate the expected values calculated based on the assumption that the negative control counts follow a normal distribution, without (a) and with (b) S9 mix. Scatter plots showing the negative control counts generated by each participating laboratory without (c) and with (d) S9 mix are also shown, where the inner horizontal lines (−˙-) indicate the mean ± 2× standard deviation (SD), and outer horizontal lines (−–) indicate the mean ± 3× SD. The data shown in panels (a) to (d) are taken from the study conducted in 2016. The mean ± 2× SD values for the negative control counts for each individual year without (e) and with (f) S9 mix are also presented. The doses used were 0.01μg/plate for AF-2 in the absence of S9 mix, and 1.0μg/plate for 2AA in the presence of S9 mix
D’Agostino-Pearson and Kolmogorov-Smirnov tests failed to reject the null hypothesis that the negative con-trol counts were normally distributed for all five strains. In addition, the absolute values of the skewness and/or kurtosis for the five strains were less than 1.0, except for a value of 1.22 calculated for TA98 in the absence of S9 mix (Table1). Most researchers tend to categorize abso-lute values of skewness and kurtosis of less than 1.0 as an indication of slight non-normality, values between 1.0 and about 2.3 as moderate non-normality, and values greater than 2.3 as severe non-normality. Therefore, the negative control counts of the strains with a relatively high number of negative control counts were deemed to be normally distributed (strains TA100, TA98, and WP2uvrA, both with and without S9 mix), as seen in
Fig. 1aand b, Fig. 2aand b, and Fig. 5aand b. In con-trast, the negative control counts of the strains with a relatively low number of negative control counts can be deemed to approximately follow Poisson distribution, as the mean values were almost equal to the variance (strains TA1535 and TA1537, both with and without S9 mix), as seen in Table1.
The negative control counts generated by each partici-pating laboratory are shown in panels (c) and (d) of Figs. 1, 2,3,4, and 5. Almost all of the negative counts for each of the strains with and without S9 mix were within the range of the mean ± 2× SD, and counts from all laboratories were within the mean ± 3× SD, indicating that there were no outliers. As shown in panels (e) and (f ) of Figs. 1, 2, 3, 4, and 5, there was little variance in
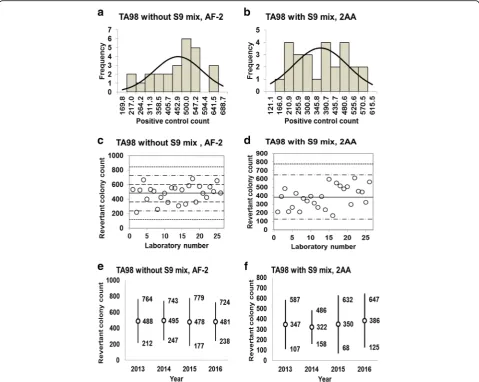
Fig. 7Positive control counts, and their subsequent analysis, forSalmonellaTyphimurium strain TA98 with and without S9 mix. Histograms show the negative control counts, and the curves indicate the expected values calculated based on the assumption that the negative control counts follow a normal distribution, without (a) and with (b) S9 mix. Scatter plots showing the negative control counts generated by each participating laboratory without (c) and with (d) S9 mix are also shown, where the inner horizontal lines (−˙-) indicate the mean ± 2× standard deviation (SD), and outer horizontal lines (−–) indicate the mean ± 3× SD. The data shown in panels (a) to (d) are taken from the study conducted in 2016. The doses used were 0.1μg/plate for AF-2 in the absence of S9 mix, and 0.5μg/plate for 2AA in the presence of S9 mix
the range of colony count values for each strain between each of the four years included in the study period. These findings indicate that laboratories using well-controlled assays carried out by proficient researchers can provide stable or consistent data. These negative control counts coincide with those reported previously [4,5,9,11].
Dose-response curves of positive control articles
The dose-response curves for the five strains at three different doses of each control article (D1, D2, and D3; Additional file1: Table S1) in the presence or absence of S9 mix are shown in Figs.6,7,8,9, and10. The data for the dose-response curves were generated by 24–27 JEMS/BMS laboratories who participated in the valid-ation study in 2016. All of the maximum doses
designated “D3” (Additional file 1: Table S1) are those recommended for each positive control article by the Japan Industrial Safety and Health Association [9], and are in-line with doses frequently used in many Japanese laboratories. Linear relationships between the dose and the number of revertant colonies were observed for strains TA100, TA98, and TA1535, both with and with-out S9 mix (Additional file2: Figure S1, Additional file3: Figure S2, and Additional file 4: Figure S3), while expo-nential relationships between the dose and number of revertant colonies were observed for strains TA1537 and WP2uvrA, with and without S9 mix (Additional file 5: Figure S4 and Additional file6: Figure S5).
Two laboratories showed a reduced number of revert-ant colonies at the maximum positive control article dose in the absence of S9 mix: strain TA98 treated with
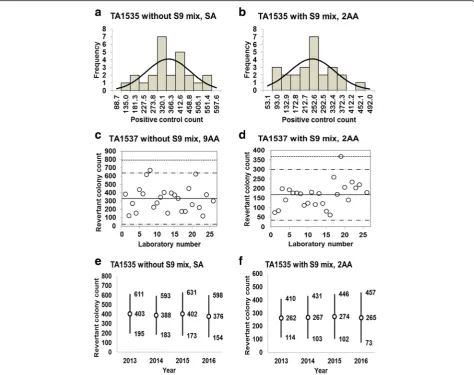
Fig. 8Positive control counts, and their subsequent analysis, forSalmonellaTyphimurium strain TA1535 with and without S9 mix. Histograms show the negative control counts, and the curves indicate the expected values calculated based on the assumption that the negative control counts follow a normal distribution, without (a) and with (b) S9 mix. Scatter plots showing the negative control counts generated by each participating laboratory without (c) and with (d) S9 mix are also shown, where the inner horizontal lines (−˙-) indicate the mean ± 2× standard deviation (SD), and outer horizontal lines (−–) indicate the mean ± 3× SD. The data shown in panels (a) to (d) are taken from the study conducted in 2016. The doses used were 0.5μg/plate for SA in the absence of S9 mix, and 2.0μg/plate for 2AA in the presence of S9 mix
AF-2 (Additional file 3: Figure S2), and strain TA1537 treated with 9AA (Additional file 5: Figure S4). The re-duced activity seen at the highest dose of AF-2 is an ex-ample of why it may be best to use positive control doses that are not at or near the top of the dose-response curves, but on the ascending portion of the curves. If the response falls within the flat portion at the top of the curve, then changes in the potency of the re-sponse may not be noticeable. Thus, this study provides corroborating evidence that the recommended positive doses outlined by the Japan Industrial Safety and Health Association [9] are appropriate. The mutagenic and cytotoxic potential of AF-2 is reported to vary depending on the pre-culture conditions. For example, this com-pound showed decreased mutagenicity but increased cytotoxicity towards bacteria cultured under anaerobic
conditions compared with those cultured under aerobic conditions [11]. Therefore, the aberrant results obtained in the current study possibly indicate inappropriate pre-culture conditions. In the case of 9AA, we suspect some sort of technical error may account for the reduced number of revertant colonies obtained at the maximum dose by one laboratory.
Positive control data
Histograms and their corresponding estimated frequency curves (generated under the assumption that the counts were normally distributed) were produced from the posi-tive control counts (the mean number of revertant col-onies/plate) in the absence and presence of S9 mix for strains TA100 (Fig. 6a and b), TA98 (Fig. 7a and b), TA1535 (Fig. 8a and b), TA1537 (Fig. 9a and b), and
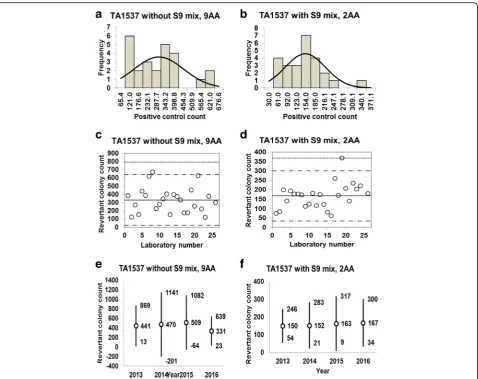
Fig. 9Positive control counts, and their subsequent analysis, forSalmonellaTyphimurium strain TA1537 with and without S9 mix. Histograms show the negative control counts, and the curves indicate the expected values calculated based on the assumption that the negative control counts follow a normal distribution, without (a) and with (b) S9 mix. Scatter plots showing the negative control counts generated by each participating laboratory without (c) and with (d) S9 mix are also shown, where the inner horizontal lines (−˙-) indicate the mean ± 2× standard deviation (SD), and outer horizontal lines (−–) indicate the mean ± 3× SD. The data shown in panels (a) to (d) are taken from the study conducted in 2016. The doses used were 80μg/plate for 9AA in the absence of S9 mix, and 2.0μg/plate for 2AA in the presence of S9 mix
WP2uvrA(Fig.10aand b). These data were provided by 24–27 participating laboratories in 2016.
D’Agostino-Pearson and Kolmogorov-Smirnov tests failed to reject the null hypothesis that the positive con-trol counts were normally distributed for all five strains under all test conditions, except for strain TA1537 treated with 2AA in the presence of S9 mix. The abso-lute values of the skewness and kurtosis were less than 1.0 in most cases, although the observed values were slightly greater than 1.0 for TA100 and TA98 treated with 2AA in the presence of S9 mix, and WP2uvrA treated with AF-2 in the absence of S9 mix (Table2). Al-though the kurtosis value was 2.17 for TA1537 treated with 2AA in the presence of S9 mix, it was less than the cut-off value of 2.3, values above which are indicative of severe non-normality (Table 2). None of the positive
control counts showed Poisson distribution because the variances were much larger than the mean values. Therefore, we concluded that all positive control counts for all strains were approximately normally distributed.
The positive control counts generated by each partici-pating laboratory are shown in panels (c) and (d) of Figs.
6, 7, 8, 9, and 10. Almost all of the positive control counts were within the range of the mean ± 2× SD, and all counts were within the mean ± 3× SD, indicating that there were no outliers. As shown in panels (e) and (f ) of Figs. 6, 7, 8, 9 and 10, there was little variance in the range of colony count values for each strain between each of the four years included in the study period. As with the negative control counts, these findings indicate that laboratories with well-controlled assays and highly proficient staff can provide stable or consistent data.
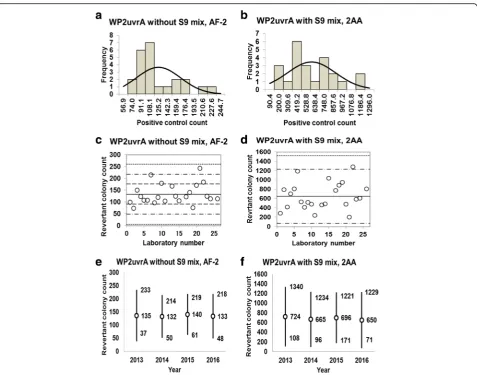
Fig. 10Positive control counts, and their subsequent analysis, forEscherichia colistrain WP2uvrAwith and without S9 mix. Histograms show the negative control counts, and the curves indicate the expected values calculated based on the assumption that the negative control counts follow a normal distribution, without (a) and with (b) S9 mix. Scatter plots showing the negative control counts generated by each participating laboratory without (c) and with (d) S9 mix are also shown, where the inner horizontal lines (−˙-) indicate the mean ± 2× standard deviation (SD), and outer horizontal lines (−–) indicate the mean ± 3× SD. The data shown in panels (a) to (d) are taken from the study conducted in 2016. The doses used were 0.01μg/plate for SA in the absence of S9 mix, and 10μg/plate for 2AA in the presence of S9 mix
Influence of different S9 manufactures/production lots on negative/positive control values and dose-response curves
S9 fraction prepared from the livers of male Sprague-Drawly rats pretreated with phenobarbital and 5,6-benzoflavon was used by all participating laboratories in 2016. The S9 fractions were purchased from two manufacturers. Ten laboratories used S9 fraction manufactured by Kikkoman, while 16 laboratories used S9 fraction manufactured by Oriental Yeast. However, as shown in Additional file 7: Figure S6, no large differences were observed in the negative/posi-tive control values or dose-response curves between the S9 manufactures or among production lots.
Relationships between negative and positive control counts
Scatter diagrams were generated to show the relation-ship between negative and positive control counts for each of the five strains with and without S9 mix (Additional file 8: Figure S7). The resulting low cor-relation coefficients suggested that there was no rela-tionship between the negative and positive control counts.
Conclusion
The data presented here, collected from a series of valid-ation studies conducted collaboratively by proficient JEMS/BMS members, will be of use in determining pos-sible acceptance criteria to confirm or demonstrate la-boratory proficiency in the reverse mutation test.
Additional files
Additional file 1:Table S1.Positive control articles and their doses used in this study (DOCX 18 kb)
Additional file 2:Figure S1.Dose-response curves of revertantSalmonella Typhimurium strain TA100 colonies following treatment with AF-2 in the absence of S9 mix (a), or with 2AA in the presence of S9 mix (b). Individual dose-response curves were generated using results produced by each participating laboratory in 2016 (different colors indicate different laboratories). The doses tested were 0.0025, 0.005, and 0.01μg/plate for AF-2, and 0.25, 0.5, and 1.0μg/plate for 2AA. (ODP 423 kb)
Additional file 3:Figure S2.Dose-response curves of revertant
SalmonellaTyphimurium strain TA98 colonies following treatment with AF-2 in the absence of S9 mix (a), or treatment with 2AA in the presence of S9 mix (b). Individual dose-response curves were generated using results produced by each participating laboratory in 2016 (different colors indicate different laboratories). The doses tested were 0.025, 0.05, and 0.1μg/plate for AF-2, and 0.125, 0.25, and 0.5μg/plate for 2AA. (ODP 434 kb)
Additional file 4:Figure S3.Dose-response curves of revertant
SalmonellaTyphimurium strain TA1535 colonies following treatment with SA in the absence of S9 mix (a), or with 2AA in the presence of S9 mix (b). Individual dose-response curves were generated using results produced by each participating laboratory in 2016 (different colors indicate different laboratories). The doses tested were 0.125, 0.25, and 0.5μg/plate for SA, and 0.5, 1.0, and 2.0μg/plate for 2AA. (ODP 411 kb)
Additional file 5:Figure S4.Dose-response curves of revertant
SalmonellaTyphimurium strain TA1537 colonies following treatment with 9AA in the absence of S9 mix (a), or with 2AA in the presence of S9 mix (b). Individual dose-response curves were generated using results produced by each participating laboratory in 2016 (different colors indicate different laboratories). The doses tested were 20, 40, and 80μg/ plate for 9AA, and 0.5, 1.0, and 2.0μg/plate for 2AA. (ODP 343 kb) Additional file 6:Figure S5.Dose-response curves of revertantEscherichia
colistrain WP2uvrAcolonies following treatment with AF-2 in the absence of S9 mix (a), or with 2AA in the presence of S9 mix (b). Individual dose-response curves were generated using results produced by each participating laboratory in 2016 (different colors indicate different laboratories). The doses tested were 0.0025, 0.005, and 0.01μg/plate for AF-2, and 2.5, 5.0, and 10μg/plate for 2AA. (ODP 342 kb)
Table 2Statistics for positive control data obtained in this study
Statistics TA100 TA98 TA1535 TA1537 WP2uvrA
-S9 +S9 -S9 +S9 -S9 +S9 -S9 +S9 -S9 +S9
Positive control article and dose (μg/plate)
AF-2 (0.01) 2AA (1.0) AF-2 (0.1) 2AA (0.5) SA (0.5) 2AA (2.0) 9AA (80) 2AA (2.0) AF-2 (0.01) 2AA (10)
No. of data 27 27 27 27 26 26 26 26 24 24
Mean 541 1028 481 386 376 265 331 167 133 650
SD 157.23 331.4 119.21 128.07 108.98 93.99 150.7 65.38 41.60 282.98
Min 336 521 217 166 135 93 121 61 74 200
Max 937 1656 684 611 593 488 671 368 243 1285
Kurtosis 0.13 −1.28 −0.30 −1.09 −0.03 −0.01 0.00 2.17 0.80 −0.23
Skewness 0.80 0.25 −0.45 0.05 −0.21 0.15 0.67 0.89 1.05 0.55
2SD- 226 365 243 130 158 77 29 36 50 84
2SD+ 855 1691 719 643 594 453 632 298 216 1216
3SD- 69 34 123 2 49 −17 −122 −29 8 −199
3SD+ 1013 2022 839 771 703 547 783 363 258 1499
Minminimum count,maxmaximum count,2SD−mean−2× standard deviation,2SD+mean + 2× standard deviation,3SD−mean−3× standard deviation,3SD+ mean + 3× standard deviation,AF-22-(2-furyl)-3-(5-nitro-2-furyl) acrylamide,2AA2-aminoanthracene,SAsodium azide,9AA9-aminoacridine hydrochloride
Additional file 7:Figure S6.Individual dose-response curves showing the positive control articles in the presence of S9 mix were generated from data obtained by each participating laboratory (each laboratory is indicated by a different color). The doses (inμg/plate) for each positive control article are the same as those shown in Figs.6,7,8,9, and10. S9 fraction was purchased from Kikkoman or Oriental Yeast, and while some laboratories used that same lots, other laboratories used different lots from the same manufacturers. Laboratory identification numbers are indicated on the right-hand side of each figure. (ODP 516 kb)
Additional file 8:Figure S7.Comparison of the negative and positive control counts for each strain with or without S9 mix. The doses shown in Figs.6,7,8,9, and10were used for comparison. The R2values indicate the
correlation coefficients of the linear regression lines. (ODP 62 kb)
Abbreviations
2AA:2-aminoanthracene; 9AA: 9-aminoacridine hydrochloride; AF-2: 2-(2-furyl)-3-(5-nitro-2-furyl) acrylamide; BMS: Bacterial Mutagenicity Study Group; DMSO: Dimethyl sulfoxide; GLP: Good Laboratory Practice; JEMS: Japanese Environmental Mutagen Society; OECD: Organisation for Economic Cooperation and Development; SA: Sodium azide; SD: Standard deviation
Acknowledgments
The authors are grateful to all JEMS/BMS members that participated in the validation studies. The authors also thank Dr. Dan Levy of Food and Drug Administration for his valuable comments, and Tamsin Sheen, PhD, from Edanz Group (www.edanzediting.com/ac) for editing a draft of this manuscript.
Funding None.
Availability of data and materials Not applicable.
Authors’contributions
MK is a chief organizer, and participated in study design and collection, analysis, and interpretation of the data. AH participated in study design and interpretation of data, and helped to draft and edit the manuscript. KS and TF drafted and edited the manuscript. TA, SH, KK, MN, MN, HS, and KW reviewed and critically discussed the manuscript. All authors read and approved the final manuscript.
Ethics approval and consent to participate Not applicable.
Consent for publication Not applicable.
Competing interests
The authors declare that they have no competing interests.
Publisher’s Note
Springer Nature remains neutral with regard to jurisdictional claims in published maps and institutional affiliations.
Author details 1
CMIC Bioresearch Center, CMIC Pharma Science Co., Ltd., Hokuto-shi, Yamanashi 408-0044, Japan.2Division of Genetics and Mutagenesis, National
Institute of Health Sciences, Setagaya-ku, Tokyo 158-8501, Japan.3Scientfic
Product Assessment Center, Japan Tobacco Inc., -shi, Yokohama, Kanagawa 227-8512, Japan.4Otsuka Pharmaceutical Co., Ltd., Tokushima 771-0192, Japan.5Global Quality Management Center, CANON INC., Kawasaki-shi,
Kanagawa 213-8512, Japan.6Hatano Research Institute, Food and Drug
Safety Center, -shi, Hadano, Kanagawa 257-8523, Japan.7Former University of
Shizuoka, 52-1, Yada, Suruga-ku, Shizuoka-city, Shizuoka 422-8526, Japan.
8General Testing Research Institute, Japan Oilstuff Inspectors’Corporation,
2-15, 1-chome, Mikagetsukamachi, Higashinada-ku, Kobe-shi, Hyogo 658-0044, Japan.9Drug Safety, Taisho Pharmaceutical co., Ltd., Saitama-shi,
Saitama 331-9530, Japan.10Tsukuba Drug Safety, Eisai Co., Ltd., Tsukuba-shi,
Ibaraki 300-2635, Japan.
Received: 1 November 2017 Accepted: 7 February 2018
References
1. Honda H, Minegawa K, Fujita Y, Yamaguchi N, Oguma Y, Glatt H, Nishiyama N, Kasamatsu T. Modified Ames test using a strain expressing human sulfotransferase 1C2 to assess the mutagenicity of methyleugenol. Genes Environ. 2016;38:1.
2. Fujii N, Yano S, Takeshita K. Selective enhancing effect of metal ions on mutagenicity. Genes Environ. 2016;38:21.
3. Hakura A, Hori Y, Uchida K, Sawada S, Suganuma A, Aoki T, Tsukidate K. Inhibitory effect of dimethyl sulfoxide on the mutagenicity of Promutagens in the Ames test. Genes Environ. 2010;32:53–60.
4. Maron DM, Ames BN. Revised methods for theSalmonellamutagenicity test. Mutat Res. 1983;113:173–215.
5. Mortelmans K, Zeiger E. The AmesSalmonella/microsome mutagenicity test. Mutat Res. 2000;455:29–60.
6. OECD. OECD Guidelines for the Testing of Chemicals / Section 4: Health Effects Test No. 471: Bacterial Reverse Mutation Test. OECD Publishing; 1997. 7. International Conference on Harmonisation (ICH) (2014). ICH M7 guideline,
Assessment and Control of DNA Reactive (Mutagenic) Impurities in Pharmaceuticals to Limit Potential Carcinogenic Risk, Step 4 Available at: http://www.fda.gov/downloads/drugs/guidancecomplianceregulatory information/guidances/ucm347725.pdf. Accessed 25 Oct 2015. 8. Sugiyama K, Yamada M, Awogi T, Hakura A. The strain recommended for
use in the bacteria reverse mutation test (OECD guideline 471) can be certified as non-genetically modified organisms. Genes Environ. 2016;38:1–3. 9. Ministry of Labor, Industrial Safety and Health Department. [Test Guidelines
and GLP for Mutagenicity Test using Microorganisms in the Safety and Health Law]. Tokyo; Japan Industrial Safety and Health Association; 1991. 10. Zar JH.“Biostatistical Analysis,”4th ed. Upper Saddle River: Prentice-Hall; 1999. 11. Hakura A. Improved Ames test for genotoxicity assessment of drugs:
preincubation assay using a low concentration of dimethyl sulfoxide. In: Yan Z, Caldwell GW, editors. Optimization in Drug Discovery: In Vitro Methods (second edition). Totowa: Humana Press; 2014. p. 325–36.
• We accept pre-submission inquiries
• Our selector tool helps you to find the most relevant journal
• We provide round the clock customer support • Convenient online submission
• Thorough peer review
• Inclusion in PubMed and all major indexing services
• Maximum visibility for your research
Submit your manuscript at www.biomedcentral.com/submit