www.atmos-meas-tech.net/4/547/2011/ doi:10.5194/amt-4-547-2011
© Author(s) 2011. CC Attribution 3.0 License.
Measurement
Techniques
SCIAMACHY stratospheric aerosol extinction profile retrieval
using the OMPS/LP algorithm
G. Taha1, D. F. Rault2, R. P. Loughman3, A. E. Bourassa4, and C. von Savigny5
1Science Systems and Applications Inc. Lanham, MD, USA 2NASA Langley Research Center, Hampton, VA, USA
3Center for Atmospheric Sciences, Hampton University, Hampton, VA, USA
4Department of Physics and Engineering Physics, University of Saskatchewan, Saskatoon, Canada 5Institute of Environmental Physics, University of Bremen, Bremen, Germany
Received: 28 October 2010 – Published in Atmos. Meas. Tech. Discuss.: 24 November 2010 Revised: 2 March 2011 – Accepted: 11 March 2011 – Published: 16 March 2011
Abstract. The Ozone Mapper and Profiler Suite, Limp Pro-filer (OMPS/LP) algorithm is used to retrieve ozone concen-tration and aerosol extinction profiles using a series of 120 SCIAMACHY limb measurements collocated with SAGE II solar occultation events. The primary goal of the study is to ascertain the capability of the OMPS/LP retrieval algo-rithm to accurately retrieve the vertical distribution of strato-spheric aerosol extinction coefficient so as to better account for aerosol effects in the ozone profiling retrieval process. Using simulated radiances, we show that the aerosol extinc-tion coefficient can be retrieved from limb scatter measure-ments within 5% and a standard deviation better than 15%, which is more than sufficient to improve the OMPS/LP ozone products to be used as Environmental Data Records. We also illustrate the ability of SCIAMACHY limb measurements to retrieve stratospheric aerosol extinction profiles with accu-racy comparable to other instruments. The retrieved aerosol extinction profiles agree with collocated SAGE II measure-ments on average to within 25%, with a standard deviation of 35%.
1 Introduction
The Ozone Mapper and Profiler Suite (OMPS) mission will be launched on board the National Polar Orbiting Environ-ment Satellite System (NPOESS) Preparatory Project (NPP) satellite in October 2011. The main goal of the mission is
Correspondence to: G. Taha ([email protected])
to produce Environmental Data Records (EDR) for total col-umn ozone and ozone concentration vertical distribution over the whole Earth atmosphere. The present paper is concerned with one of the OMPS suite of instruments, namely the Limb Profiler (LP), which will use the measurements of scattered solar radiation to infer information on the ozone concentra-tion vertical profile. More specifically, the paper is primarily focused on aerosol extinction profile retrieval and its effect on the quality of the retrieved ozone concentration profile. In order to test the OMPS retrieval algorithm, we use a simu-lated set of radiances and the limb scattering measurements of SCIAMACHY on board of Envisat. Another objective of this paper is to illustrate the capabilities of SCIAMACHY limb measurements to derive stratospheric aerosol extinction profiles, since this work presents the first results of such a retrieval.
System (OSIRIS) (Llewellyn et al., 2004), and the SCanning Imaging Absorption spectroMeter for Atmospheric Chartog-rapHY (SCIAMACHY) (Bovensmann et al., 1999) are still in operation, while the OMPS is expected to launch this year. The capability of LS sensors has already been demonstrated with SAGE III LS (Rault and Loughman, 2007) and OSIRIS (Bourassa et al., 2007) measurements. Aerosol extinction profiles are also measured by the stellar occultation Instru-ment Global Ozone Monitoring by Occultation of Stars (GO-MOS) (Vanhellemont, et al., 2010).
The paper reviews the main concepts of the OMPS/LP retrieval algorithm in Sect. 2. The performance of the OMPS/LP algorithm is illustrated in Sect. 3 where a set of synthetic LS radiance data are used to test the algorithm. It is shown that the OMPS/LP algorithm can accurately retrieve all the input parameters, namely surface reflectance, aerosol extinction, ozone density as well as tangent height regis-tration (TH). The OMPS/LP algorithm is applied to MACHY data as shown in Sect. 4. A series of 120 SCIA-MACHY LS events are selected which correspond to close coincidences with SAGE II solar occultation events in both space (less than 250 km) and time (less than one day) during 2004. The retrieved aerosol extinction profiles are presented, discussed and compared with SAGE II, first on a case by case basis and then on a global statistical level. The ozone con-centration retrieval results are presented and compared with both SAGE II and SCIAMACHY archived products. Finally, a summary and conclusions of this study are presented in Sect. 5.
2 Methodology
2.1 OMPS/LP retrieval algorithm
The retrieval of atmospheric constituents from limb radiance measurements involves comparing measured data with sim-ulated data generated by a multiple scattering radiative trans-fer (RT) model. The RT model used for the LP was ini-tially developed by Herman et al., (1994, 1995), and has been tuned and optimized for limb studies by Rault (2005). It is efficient in performing multi-wavelength computations, which allows one to perform convolution with the instrument slit function with sufficient accuracy and speed. The partial derivatives are computed semi-analytically for both ozone (single scattering) and aerosol (multiple scattering). The re-trieval algorithm is based on the Rodgers nonlinear optimal estimation technique (Rodgers, 2000).
For the ozone concentration retrieval, the measurement vector is made of wavelength pairs and triplets, following the technique described by Flittner et al. (2000). The a priori data vector is provided for a given latitude and calendar month from the SAGE II climatology. For the aerosol extinction re-trieval, the measurement vectors are normalized radiances at specific wavelengths corresponding to weak gaseous
absorp-tion. The a priori vector is a set of extinction vertical pro-files (8 wavelengths) corresponding to the present period of low stratospheric background aerosol extinction constructed from SAGE III measurements, and is fixed for all locations. The a priori aerosol size distribution is assumed to be a back-ground stratosphere aerosol of a single mode log normal dis-tribution, with 0.06 µm mode radius and varianceσ of 1.73, composed of spherical liquid sulphate particles with an in-dex of refraction m=1.448+0i (Yue and Deepak, 1983; Wang et al., 1996). In the forward model, the atmospheric temperature and pressure profiles are generated from the Na-tional Centers for Environmental Prediction (NCEP) dataset (Kalnay et al., 1996), and the NO2information is taken from
a climatology constructed using the PRATMO photochemi-cal box model (McLinden et al., 2000). The retrieval uncer-tainties or Residual Standard Deviation (RSD) are evaluated from the diagonal of the covariance matrix, which itself is computed using the Signal-to-Noise-Ratio (SNR) specific to the sensor.
The OMPS/LP profile retrieval algorithm is composed of a series of sequential steps; first cloud height is determined us-ing long wavelength channels with weak gaseous absorption, secondly, a tangent height registration check is performed, and adjusted, if necessary (not adjusted in this study), using a scene-base method, such as the Rayleigh Scatter Altime-ter Sensor (RSAS) technique (Janz et al., 1996). The third step consists of estimating the effective scene reflectivity (or albedo) by comparing the measured and modeled radiances in the TH range of 35–45 km. Fourth, the aerosol extinction and size distribution are then retrieved, as described below, using spectral channels with weak gaseous absorption. TH registration is repeated using the retrieved aerosol extinction profiles, since the TH registration is somewhat sensitive to aerosol loading. Finally, the ozone concentration retrieval is performed using radiance data from both the ultraviolet and visible wavelength channels respectively, for high altitudes (30–60 km) and low altitudes (Cloud top or 10–40 km). 2.2 Aerosol extinction algorithm
Fig. 1. Sensitivity of SCIAMACHY limb radiance to stratospheric
aerosol. Sensitivity is defined as the maximum change [%] of limb radiance due to 1% change in aerosol extinction.
not introduce non-physical high frequency fluctuations into the ozone concentration retrieval process. The aerosol ex-tinction profile is also updated at the RSAS channel, usually at∼350 nm, where the Rayleigh scattering is dominant and gaseous absorption is minimal, to improve the accuracy of the tangent height predictions. An alternative method to the Angstr¨om approach consists in using the retrieved multiple wavelength aerosol extinction to solve for a moment of the size distribution (Rault and Loughman, 2007). In this work, we are only presenting results obtained using the first ap-proach.
Figure 1 is a plot of the sensitivity of SCIAMACHY LS signal to aerosol [dlog(Iλ)/dlog(βλ)], which shows clear aerosol extinction sensitivity at wavelengths in the 500–1020 range. The optimal vertical altitude of the aerosol signal varies by wavelength, generally from 18–25 km at 520 nm to 12–30 km at 1020 nm. At shorter wavelengths, Rayleigh scattering dominates the scattering signal. Aerosol sensitiv-ity is used to determine upper and lower limits of the re-trieved aerosol extinction profile. The retrieval is not updated outside these limits.
3 Results of synthetic data retrieval
The retrieval algorithm was first tested with a relatively large synthetic dataset, where we have full control on the problem parameters. This step allows one to quantify retrieval un-certainties and perform a statistical analysis of the retrieved products.
This dataset was generated by a forward model and is com-posed of 450 limb scattering events. Each event corresponds to a co-location of a SAGE II occultation measurement with a SCIAMACHY limb scattering measurement. Co-locations
Fig. 2. Location of the simulated dataset (upper panel) and latitude
(degree) vs. time (lower panel).
were searched for within a one year period. These events encompass a wide range of geo-locations, seasons, and so-lar viewing angles. The input ozone concentration, NO2,
and aerosol extinction profiles for each event are those of SAGE II. The solar view angles are obtained from the SCIA-MACHY measurements. The surface albedo is assumed to have a constant value of 0.15, which represents clear sky con-ditions. The atmospheric temperature and pressure profiles are generated from NCEP reanalysis provided by the SAGE II data file. No noise or instrument errors are added to the radiances in this data set. The forward model is basically the same as the one used in the inversion retrieval; however, for the forward model run, we use a higher wavelength resolu-tion, as well as finer single and multiple scattering grids than those used in the inversion mode. Figure 2 shows the sim-ulated events location map. The lower panel is a plot of all events latitude vs. time.
The performance of the aerosol extinction retrieval is illus-trated in Fig. 3, which compares the retrieved aerosol extinc-tion profile to the assumed input profile or “truth”. The figure shows the mean relative difference in percent (retrieval-truth) and the standard deviation of the retrievals for the 525 and 994 nm wavelengths. For the longer wavelength at 994 nm, it can be seen that the aerosol extinction can be retrieved within
Fig. 3. Summary plot of the relative difference (percent) for all
retrieved aerosol extinction profiles for the 450 simulated radiances. Blue 994 nm, red 525 nm. The dashed lines represent the standard deviations.
Fig. 4. Example of aerosol weighting functions at wavelength 525 nm. The left panel is for the SSA = 133◦, right panel is for SSA = 43◦, colored from black to red in altitude ascending order.
the line of sight beam than they do into it, which causes the weighting functions to go negative, and reduces the sensitiv-ity of the limb radiance to aerosols. When the SSA is small, the weighting functions are always positive. Aerosol weight-ing functions are generally positive for large wavelengths, as demonstrated in Fig. 5 for the 994 nm. To ensure maximum sensitivity towards aerosol, we use an initial guess profile of very low aerosol loading (Bourassa et al., 2009).
Results of the ozone concentration retrieval exhibit a rel-ative difference of 2%, and standard deviation less than 3%, with respect to the true values at altitude range 20–58 km, as depicted in Fig. 6. Aerosol modeling error in the for-ward model contributed up to 2% of the retrieval precision at altitude range 23–30 km. In a separate test (not shown here) where the truth aerosol extinction profile spectral be-havior is constrained by an aerosol size model, this bias dis-appears. Below 20 km, the large standard deviation∼15% is mainly caused by very low ozone concentrations at cer-tain geographical regions. Although the absolute difference is generally small for all altitudes, the percent difference is further enhanced when the ozone concentration is very low.
Fig. 5. Same as Fig. 4 now for wavelength 994 nm.
Fig. 6. Summary plot of the relative difference (percent) for all
retrieved ozone profiles for the 450 simulated radiances, red is visi-ble, and blue is UV retrievals (left panel). The right panel shows the standard deviation with the same color code. Dashed lines represent the retrieval error or RSD.
The accuracy of the retrieved ozone concentration clearly demonstrates that the retrieved aerosol extinction is suffi-ciently ascertained and can accurately correct for the aerosol effect on the ozone concentration retrieval. Rault and Taha (2007) showed that ignoring the aerosol contribution would produce an ozone density bias of up to 7% in the region of maximum aerosol extinction, while the use of constant aerosol extinction climatology instead of retrieving it can introduce a systematic bias and a possible seasonal or ge-ographical signature in the ozone concentration retrieval around the aerosol extinction layer.
4 Results of SCIAMACHY retrievals 4.1 SCIAMACHY dataset
The SCIAMACHY instrument on board Envisat (Environ-mental Satellite) has been in orbit since 2002, performing limb scatter radiance measurements from the near UV to the infrared region (For instrumental details we refer to Bovens-mann et al., 1999). SCIAMACHY limb products include ver-tical profiles of ozone, NO2, BrO, H2O, and OClO, as well as
polar stratospheric and noctilucent clouds. A fairly good esti-mate of the aerosol extinction profile is critical to the retrieval accuracy of stratospheric minor constituent profiles, mainly in the Upper TropospheLower Stratosphere (UT/LS) re-gion, as shown by Loughman et al. (2005) and Rault and Taha (2007). For this study SCIAMACHY Level 1 version 6.03 data are used, that includes an improved tangent height registration compared to the lower Level 1 versions used by von Savigny et al. (2005). The accuracy of the tangent height registration is assumed to be better than 300–400 m.
In this paper, a subset of 120 SCIAMACHY events recorded in 2004 was selected. Each event corresponds to a geo-location in close proximity to a SAGE II solar occul-tation, within 250 km and within 24 h. SAGE II is widely recognized as a benchmark for satellite ozone and aerosol extinction measurements in the stratosphere (Wang, et al., 2002; Borchi, et al., 2004; Thomason and Peter, 2006). An OMPS proxy dataset was constructed from SCIAMACHY data by selecting radiance measurements at OMPS wave-lengths, and convolving each radiance with the OMPS spec-tral instrument point spread function. The radiance data was then interpolated to a 1 km grid. A spatial Gaussian convolution with a Full Width Half Maximum (FWHM) of 2.7 km was also applied to the forward model to match the SCIAMACHY Field of View (FOV) function. As shown in Fig. 7, the proxy dataset is evenly distributed around 50◦N and 70◦S, and with time, allowing us to study the effect of seasonal/geographical variations on the ozone concentration and aerosol extinction retrieval. When comparing retrieval products, SAGE II aerosol extinction and ozone concentra-tion profiles are convolved with a 2.5 km Gaussian filter to match the SCIAMACHY FOV function.
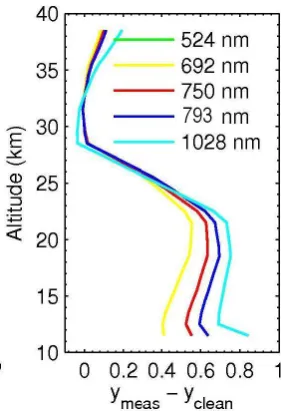
Figure 8 is a plot of the difference between SCIAMACHY normalized measured (ymeas)and modeled radiance (yclean)
for an aerosol free atmosphere, at 524, 692, 750, 793, and 1028 nm. Initial normalization altitude is 35.5 km. The sig-nature of stratospheric aerosols is clearly evident from 12 to 30 km, with aerosol sensitivity increasing with wavelength. SCIAMACHY LS measurements show evidence of stray-light at high altitudes, with the strongest contamination oc-curring at longer wavelengths (Gottwald et al., 2006). The straylight can be observed above 32 km for all wavelengths except for the 1028 nm, where it was above 29 km. At high altitudes, the difference between the measurements and the clean atmosphere should be negligible. To avoid straylight
Fig. 7. Location of the SCIAMACHY measurement subset, (upper
panel) and latitude (degree) vs. time (day number) (lower panel).
Fig. 8. Plot of the difference between SCIAMACHY normalized
measured (ymeas)and modeled radiance (yclean) with no aerosol, at
524, 692, 750, 793, and 1028 nm.
contamination effects, the high-altitude normalization is ad-justed to the height level where this difference is at its mini-mum. Normalization altitudes are constantly calculated and updated for each wavelength. The high-altitude normaliza-tion is needed to reduce the effects of parameters such as sur-face/cloud reflectance, sensor absolute calibration and sensor residual polarization.
4.2 Aerosol extinction retrieval results
Fig. 9. Multiple iterations of retrieved aerosol extinction profiles at
793 (left) and 1028 nm (right) and the a priori profile.
The circles are positioned at the upper and lower limits of the retrieval for each iteration. The averaging kernel matrix for each selected wavelength is close to the identity matrix, which ensures that the retrieved aerosol extinction profile is mostly independent of the a priori profile within the retrieval limits, as can be seen in Fig. 9.
Two separate retrievals of aerosol extinction profiles from SCIAMACHY were performed using the following wave-lengths: 750, 793, and 1028 nm, and 524, 692, 750, 793, and 1028 nm. For the second set of retrievals, the algorithm was modified to carry out an initial ozone concentration retrieval using aerosol extinction climatology. The aerosol extinction retrieval is then performed using the initial ozone estimate, in order to accurately account for the ozone interference at the shorter wavelengths. Finally, the ozone retrieval is per-formed using the retrieved aerosol extinction profiles This change, alongside the use of a very small aerosol extinc-tion initial guess, was critical to successful retrievals of the shorter wavelengths, mainly 524 and 692 nm. Unless stated otherwise, all presented results herein are using the first set of retrievals.
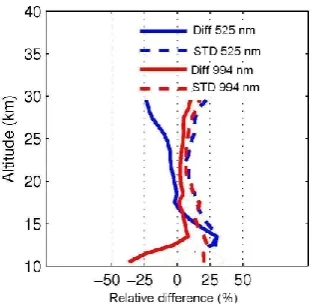
4.3 Aerosol extinction retrieval comparison with SAGE II
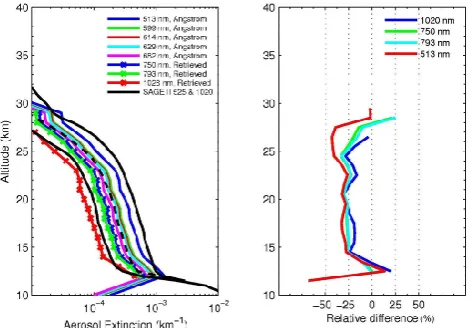
Figure 10 is an example of retrieved and calculated aerosol extinction profiles for the same event depicted in Figs. 8 and 9. It reveals a typical stratospheric aerosol extinction load-ing close to background levels on 24 January 2004, latitude 43.6◦N, and longitude 74.5◦E. The left panel shows the re-trieved aerosol extinction profiles for 750, 793, and 1028 nm (color asterisk). The solid lines correspond to the 513– 682 nm calculated using the Angstr¨om coefficient. The black lines refer to SAGE II measurements at 525 and 1020 nm, whereas the dashed line refers to the interpolated SAGE II aerosol extinction at 750 nm. The right panel is the
rela-Fig. 10. The left panel shows the retrieved aerosol extinction
pro-files for 750, 793, and 1028 nm (color asterisk). Colored lines: 513-682 nm calculated aerosol extinction. Black lines: SAGE II pro-file at 525 and 1020 nm. Dashed black line: interpolated SAGE II aerosol extinction profile at 750 nm. The right panel shows the rel-ative difference (percent) between the retrieved aerosol extinction profiles and the ones from SAGE II.
Fig. 11. Same as Fig.10 but for 27 September 2004, latitude 13.2◦N and longitude 32.6◦E.
tive difference (percent) between the retrieved aerosol ex-tinction and SAGE II profiles. For the purpose of compar-ison, SAGE II was linearly interpolated at wavelengths 513, 750, and 793 nm. Differences are shown at 513 nm (which is calculated), in order to illustrate the quality of the calcu-lated aerosol extinction at the wavelength used in the ozone concentration retrieval.
Fig. 12. Plot of the retrieved SCIAMACHY vs. SAGE II aerosol
profiles, similar to Fig. 10 left panel, but for 13 September 2004, latitude 60.9◦S and longitude 81.2◦W, and 9 September 2004, lat-itude 61.2◦S and longitude 23.9◦W respectively.
Figure 11 is similar to Fig. 10 but for 27 September 2004, latitude 13.2◦N and longitude 32.6◦E. The aerosol extinc-tion profile has a fairly unusual shape with multiple layers of aerosol extinction particles at 12, 17, and 20–30 km. The ori-gin of these multiple layers is not known, but it can be seen that SAGE II and SCIAMACHY are in reasonable agreement in detecting the aerosol extinction profile shape, but not nec-essarily the absolute magnitude. Reasons for this may be the basic assumptions made in the forward model regard-ing the aerosol size distribution uni-modal structure, shape, and composition (spherical sulphate particles) for the aerosol model in the retrieval algorithm. A different aerosol model is required to account for the tropospheric aerosol extinction seen at lower altitudes.
Figure 12 is another plot showing the retrieved SCIA-MACHY and SAGE II aerosol extinction profiles, similar to Fig. 10 left panel, now for 13 September 2004, latitude 60.9◦S and longitude 81.2◦W, and 9 September 2004, lati-tude 61.2◦S and longitude 23.9◦W respectively. This exam-ple demonstrates the ability of the retrieval to detect mul-tiple layers of enhanced aerosol extinction, including thin Polar Stratospheric Clouds (PSCs). The NCEP temperature was 192–194 K around the observed aerosol extinction lay-ers at 18–20 km. The time, location, temperature, and mag-nitude of the extinction coefficient indicate that this layer is most likely a PSC. For the second case on the right panel, the retrieval manages to see through the cloud to detect a secondary aerosol extinction layer at 24–16 km that matches the SAGE II aerosol extinction profile shapes. The origin of this aerosol layer is the sedimentation of PSC particles carrying with them the background aerosol (Thomason and Peter, 2006). Although the agreement in profile shape be-tween SCIAMACHY and SAGE II is notable, the absolute agreement is not so.
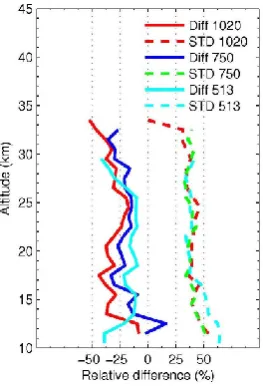
Fig. 13. Summary plot of the relative difference (percent) for all
retrieved aerosol extinction profiles used in this study with SAGE II, which includes 1028 nm (red), 750 nm (blue) and 513 nm (cyan). The dashed lines are the standard deviations.
Sources of the observed difference with SAGE II can be partly explained by the use of the aerosol size distribution model for the phase function calculation. Straylight contam-ination can add to the bias, mainly at 1028 nm. Lowering the normalization height to avoid the straylight can lead to nor-malization at levels that might contain some aerosol, albeit very small values. SCIAMACHY tangent height registration uncertainties can also add to the retrieval uncertainty. The effect of line-of-sight inhomogeneity, mainly at the UT/LS, is more complex and difficult to account for. Some of the observed differences were caused by instrument differences and atmospheric variability or mismatches, which requires further work to address adequately.
Generally, aerosol extinction measurements comparison is difficult in the stratosphere during a period of historically low background aerosol loading, more so in the UT/LS be-cause of the highly variable atmospheric conditions in that region. Thomason and Peter (2006) carried out a compari-son of various instruments that measure stratospheric aerosol extinction, and found that the agreement between these in-struments is within 20–60%. The accuracy and precision of the retrieved SCIAMACHY aerosol extinction profiles is well within these limits and demonstrate the capabilities of the SCIAMACHY limb measurements, as well as the OMPS LP algorithm to deliver good stratospheric aerosol extinction profiles. These aerosol products are suitable for scientific studies of various atmospheric events such as volcanic erup-tions or high altitude clouds generated by biomass burning. Further tuning of the retrieval algorithm and the aerosol size distribution model, and a more extensive validation analysis using more instruments and a larger statistical sample would be beneficial for the retrieval by further understanding and quantifying the retrieval uncertainties. The SCIAMACHY and future OMPS aerosol extinction measurements would extend the existing stratospheric aerosol records in a signifi-cant way.
4.5 Ozone concentration retrieval
Figure 14 is a summary plot of the SCIAMACHY retrieved ozone concentration profile relative differences (percent) with SAGE II. The left panel shows the relative difference for Visible (red), Ultraviolet (blue), and University of Bremen (IUP) retrievals (yellow) for all events used in this study. The IUP ozone profile used here is Stratozone 2.0, which is based on simultaneous retrieval in the UV (Hartley-Huggins) and visible Chappuis bands (Sonkaew et al., 2009). The IUP re-trieval corrects for aerosol extinction using constant aerosol climatology. The right panel shows the standard deviation (line) and the retrieval error or RSD (dash). The left panel shows that the retrieved ozone concentration profile (vis.) agrees well with the one from SAGE II, with∼3% improve-ment over the IUP retrieval, which could be attributed to an improved aerosol extinction profile solution. IUP retrieval uses constant aerosol extinction climatology to correct for
Fig. 14. Summary plot of the relative difference (percent) for all
retrieved ozone profiles used in this study with SAGE II (left panel). The right panel shows the standard deviations, and the RSD.
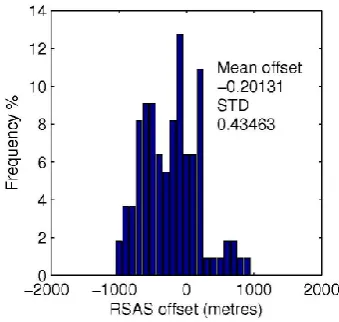
Fig. 15. Histogram of all detected tangent height offsets.
the stratospheric aerosol contribution, which can introduce a systematic bias in the ozone profile depending on the time and location of the measured profile. The standard devia-tion for both visible and IUP retrievals is∼10%. The RSD is very small compared to the standard deviation, mainly be-cause SCIAMACHY reported errors were small. The natural atmospheric variability can also explain some of the observed differences between the standard deviation and the retrieval error.
4.6 Tangent height registration
5 Summary and conclusions
The OMPS/LP retrieval algorithm is currently being tested with a large set of synthetic and proxy radiance data in or-der to gauge its performance and identify sources of bias and systematic errors. The results of this performance analysis are being used to fine-tune the algorithm. Using the syn-thetic radiances, we showed that the aerosol extinction co-efficient can be retrieved from limb scatter measurements within 5% and a standard deviation better than 15% for the altitude range of 15–30 km, which is more than sufficient to improve the OMPS/LP ozone products to be used as Envi-ronmental Data Records. Using SCIAMACHY limb mea-surements as a proxy, the study presented in this paper has al-lowed a direct comparison of the OMPS/LP algorithm prod-ucts with SAGE II retrievals, under a wide range of atmo-spheric conditions, geo-locations, scattering solar angles and seasons. Such comparison is obviously difficult since it does involve instrument artifacts and effects (which are different for each sensor) and atmospheric variability. The retrieved aerosol extinction profiles agree with collocated SAGE II measurements on average to within 25%, with a standard de-viation of 35%. A secondary outcome of this study shows that it is indeed possible to retrieve aerosol extinction pro-files from SCIAMACHY LS data, which in turn, could lead to an improvement of the SCIAMACHY gaseous products in the UT/LS region.
Acknowledgements. The authors wish to acknowledge valuable discussions and comments with B. Wenny, K.-U. Eichmann, T. Sonkaew, and J. Burrows. We would also like to acknowledge valuable remarks given by two anonymous reviewers. Thanks to ESA for providing SCIAMACHY level 1 data used in this study, Institute of Environmental Physics (IUP), University of Bremen for providing the IUP ozone profiles, and for the SAGE II team at NASA LaRC for processing SAGE II version 6.2 measurements. The initial work took place during a visit by G. Taha at the University of Bremen. One of the Authors, G. Taha, is supported by NASA grant NNL07AA00C.
Edited by: E. Kyr¨ol¨a
References
Borchi, F., Pommereau, J.-P., Garnier, A., and Pinharanda, M.: Evaluation of SHADOZ sondes, HALOE and SAGE II ozone profiles at the tropics from SAOZ UV-Vis remote measurements onboard long duration balloons, Atmos. Chem. Phys., 5, 1381– 1397, doi:10.5194/acp-5-1381-2005, 2005.
Bourassa, A. E., Degenstein, D. A., Gattinger, R. L., and Llewellyn, E. J.: Stratospheric aerosol retrieval with optical spectrograph and infrared imaging system limb scatter measurements, J. Geo-phys. Res., 112, D10217, doi:10.1029/2006JD008079, 2007. Bourassa, A. E., Elash, B., Degenstein, D., and Llewellyn, E.
J.: Evolution of the stratospheric aerosol enhancement fol-lowing the Kasatochi eruption: Odin-OSIRIS measurements, 5th Atmospheric Limb Conference, Finland, available online
at: http://fmilimb.fmi.fi/5thlimbmeeting/presentations/Bourassa. pdf, 2009.
Bovensmann, H., Burrows, J. P., Buchwitz, M., Frerick, J., Noel, S., Rozanov, V. V., Chance, K. V., and Goede, A. P. H.: SCIA-MACHY: Mission objectives and measurement modes, J. Atmos. Sci., 56(2), 127–150, 1999.
Flittner, D. E., Bhartia, P. K., and Herman, B. M.: O3 profiles re-trieved from limb scatter measurements: Theory, Geophys. Res. Lett., 27, 2601–2604, 2000.
Gottwald, M., Bovensmann, H., Lichtenberg, G., No¨el, S., von Bar-gen, A., Slijkhuis, S., Piters, A., Hoogeveen, R., von Savigny, C., Buchwitz, M., Kokhanovsky, A., Richter, A., Rozanov, A., Holzer-Popp, T., Bramstedt, K., Lambert, J.-C., Skupin, J., Wit-trock, F., Schrijver, H., and Burrows, J. P.: SCIAMACHY, Mon-itoring the Changing Earth’s Atmosphere, Published by DLR, 2006.
Herman, B. M., Ben-David, A., and Thome, K. J.: Numerical tech-nique for solving the radiative transfer equation for a spherical shell atmosphere, Appl. Optics, 33, 1760–1770, 1994.
Herman, B. M., Caudill, T. R., Flittner, D. E., Thome, K. J., and Ben-David, A.: Comparison of the Gauss-Seidel spherical polar-ized radiative transfer code with other radiative transfer codes, Appl. Optics, 34, 4563–4572, 1995.
Hofmann, D. J. and Deshler, T.: Stratospheric cloud observations during formation of the Antarctic ozone hole in 1989, J. Geo-phys. Res., 96, 2897–2912, 1991.
Janz, S. J., Hilsenrath, E., Flittner, D., and Heath, D.: Rayleigh scattering attitude sensor, Proc. SPIE Int. Soc. Opt. Eng., 2831, 146–153, 1996.
Kaiser, J., von Savigny, C., Eichmann, K.-U., No¨el, S., Bovens-mann, H., Frerick, J., and Burrows, J. P.: Satellite Pointing Re-trieval from Solar UV-B Radiation Scattered in the Atmosphere by the Earth’s limb, Can. J. Phys., 82, 1041–1052, 2004. Kalnay, E., Kanamitsu, M., Kistler, R., Collins, W., Deaven, D.,
Gandin, L., Iredell, M., Saha, S., White, G., Woollen, J., Zhu, Y., Chelliah, M., Ebisuzaki, W., Higgins, W., Janowiak, J., Mo, K. C., Ropelewski, C., Wang, J., Leetmaa, A., Reynolds, R., Jenne, R., and Joseph, D.: The NCEP/NCAR 40-year reanalysis project, B. Am. Meteorol. Soc., 77, 437–471, 1996.
Llewellyn, E. J., Lloyd, N. D., Degenstein, D. A., Gattinger, R. L., Petelina, S. V., Bourassa, A. E., Wiensz, J. T., Ivanov, E. V., McDade, I. C., Solheim, B. H., McConnell, J. C., Haley, C. S., von Savigny, C., Sioris, C. E., McLinden, C. A., Griffioen, E., Kaminski, J., Evans, W. F., Puckrin, E., Strong, K., Wehrle, V., Hum, R. H., Kendall, D. J.W., Matsushita, J., Murtagh, D. P., Brohede, S., Stegman, J., Witt, G., Barnes, G., Payne, W. F., Pich´e , L., Smith, K., Warshaw, G., Deslauniers, D. L., Marc-hand, P., Richardson, E. H., King, R. A., Wevers, I., McCreath, W., Kyr¨ol¨a, E., Oikarinen, L., Leppelmeier, G. W., Auvinen, H., M´egie, G., Hauchecorne, A., Lef´evre, F., de La N¨oe, J., Ricaud, P., Frisk, U., Sjoberg, F., von Sch´eele, F., and Nordh, L.: The OSIRIS instrument on the Odin spacecraft, Can. J. Phys., 82, 411–422, 2004.
Loughman, R. P., Flittner, D. E., Herman, B. M., Bhartia, P. K., Hilsenrath, E., and McPeters, R. D.: Description and sensitivity analysis of a limb scattering ozone retrieval algorithm, J. Geo-phys. Res., 110, D19301, doi:10.1029/2004JD005429, 2005. McLinden, C. A., Olsen, S., Hannegan, B., Wild, O., Prather, M.
sim-ple chemistry and the cross-tropopause flux, J. Geophys. Res., 105(D11), 14653–14665, 2000.
Poole, L. R. and McCormick, M. P.: Airborne lidar observations of Arctic polar stratospheric cloud: Indications of two distinct growth stages, Geophys. Res. Lett., 15, 21–23, 1988.
Rault, D. F.: Ozone profile retrieval from Stratospheric Aerosol and Gas Experiment (SAGE III) limb scatter measurements, J. Geo-phys. Res., 110, D09309, doi:10.1029/2004JD004970, 2005. Rault, D. F. and Loughman, R.: Stratospheric and upper
tropo-spheric aerosol retrieval from limb scatter signals, Proceedings of the SPIE, 6745, 674509, doi:10.1117/12.737325, 2007. Rault, D. F. and Taha, G.: Validation of ozone profiles retrieved
from SAGE III limb scatter measurements, J. Geophys. Res., 112, D13309, doi:10.1029/2006JD007679, 2007.
Rodgers, C. D.: Inverse methods for atmosphere sounding: Theory and practice, World Scientific Publishing Co, Singapore, 238 pp., 2000.
Sonkaew, T., Rozanov, V. V., von Savigny, C., Rozanov, A., Bovens-mann, H., and Burrows, J. P.: Cloud sensitivity studies for strato-spheric and lower mesostrato-spheric ozone profile retrievals from mea-surements of limb-scattered solar radiation, Atmos. Meas. Tech., 2, 653–678, doi:10.5194/amt-2-653-2009, 2009.
Thomason, L. W.: A diagnostic stratospheric aerosol size distribu-tion inferred from SAGE II measurements, J. Geophys. Res., 96, 22501–22508, 1991.
Thomason, L. W. and Peter, T.: Assessment of Stratospheric Aerosol Properties (ASAP), SPARC Report No. 4, WCRP-124, WMO/TD-No. 1295, available online at: http://www.atmosp. physics.ca/SPARC/, 2006.
Thomason, L. W. and Taha, G.: SAGE III Aerosol Extinction Mea-surements: Initial Results, Geophys. Res. Lett., 30(12), 1631, doi:10.1029/2003GL017317, 2003.
Vanhellemont, F., Fussen, D., Mateshvili, N., T´etard, C., Bingen, C., Dekemper, E., Loodts, N., Kyr¨ol¨a, E., Sofieva, V., Tamminen, J., Hauchecorne, A., Bertaux, J.-L., Dalaudier, F., Blanot, L., Fanton d’Andon, O., Barrot, G., Guirlet, M., Fehr, T., and Saave-dra, L.: Optical extinction by upper tropospheric/stratospheric aerosols and clouds: GOMOS observations for the period 2002– 2008, Atmos. Chem. Phys., 10, 7997–8009, doi:10.5194/acp-10-7997-2010, 2010
von Savigny, C., Kaiser, J. W., Bovensmann, H., Burrows, J. P., McDermid, I. S., and Leblanc, T.: Spatial and temporal charac-terization of SCIAMACHY limb pointing errors during the first three years of the mission, Atmos. Chem. Phys., 5, 2593–2602, doi:10.5194/acp-5-2593-2005, 2005.
von Savigny, C., Sonkaew, T., Dikty, S., Eichmann, K.-U., Rozanov, A., Weber, M., Bovensmann, H., and Burrows, J. P.: New strato-spheric ozone results from SCIAMACHY/Envisat, 5th Atmo-spheric Limb Conference, Finland, available online at: http:// fmilimb.fmi.fi/5thlimbmeeting/presentations/Savigny.pdf, 2009. Wang, H. J., Cunnold, D. M., Thomason, L. W., Zawodny, J. M., and Bodeker, G. E.: Assessment of SAGE version 6.1 ozone data quality, J. Geophys. Res., 107(D23), 4691, doi:10.1029/2002JD002418, 2002.
Wang, P. H., Kent, G. S., McCormick, M. P., Thomason, L. W., and Yue: G. K.: Retrieval analysis of aerosol size distribution with simulated extinction measurements at SAGE III wavelengths, Appl. Optics, 35, 433–440, 1996.
![Fig. 1. Sensitivity of SCIAMACHY limb radiance to stratosphericaerosol. Sensitivity is defined as the maximum change [%] of limbradiance due to 1% change in aerosol extinction.](https://thumb-us.123doks.com/thumbv2/123dok_us/224460.1515821/3.595.72.258.65.248/sensitivity-sciamachy-radiance-stratosphericaerosol-sensitivity-dened-limbradiance-extinction.webp)