COLOR FEATURE EXTRACTION FOR
CBIR
Dr. H.B.KEKRE
Senior Professor, Computer Engineering Department, Mukesh Patel School of Technology Management and Engineering,
SVKM’s NMIMS UniversityMumbai-56, INDIA [email protected]
MR.DHIRENDRA MISHRA
Ph.D. Research Scholar and Associate Professor, Computer Engineering Department, Mukesh Patel School of Technology Management and Engineering,
SVKM’s NMIMS UniversityMumbai-56, INDIA [email protected]
MS. STUTI NARULA
B-Tech Students, Information Technology Department, Mukesh Patel School of Technology Management and Engineering,
SVKM’s NMIMS UniversityMumbai-56, INDIA. [email protected]
MS. VIDHI SHAH
B-Tech Students, Information Technology Department, Mukesh Patel School of Technology Management and Engineering,
SVKM’s NMIMS UniversityMumbai-56, INDIA. [email protected]
ABSTRACT:
Content Based Image Retrieval is the application of computer vision techniques to the image retrieval problem of searching for digital images in large databases. The method of CBIR discussed in this paper can filter images based their content and would provide a better indexing and return more accurate results. In this paper we would be discussing: Feature vector generation using color averaging technique, Similarity measures and Performance evaluation using randomly selected 5 query images per class out of which result of one class is discussed. Precision –Recall cross over plot is used as the performance evaluation measure to check the algorithm. As the system developed is generic, database consists of images from different classes. The effect due to the size of database and number of different classes is seen on the number of relevancy of the retrievals.
KEYWORDS: CBIR, Precision, Recall, Euclidean distance, Precision-Recall cross over.
1. INTRODUCTION:
Content-based image retrieval (CBIR) systems experience the challenge of semantic gap between the low-level visual features and the high-level semantic concepts. It would be advantageous to build CBIR systems which support high-level semantic query [1]. The main idea is to integrate the strengths of content- and keyword-based image indexing and retrieval algorithms while alleviating their respective difficulties.
Content based Image retrieval is an efficient way to search through an image database by means of image features such as colour, texture, shape, pattern or any combinations of them. Colour is an important cue for image retrieval. The image retrieval based on colour features has proved effective for a large image database, however it is neglected that colour is not a stable parameter, as it depends not only on surface characteristics but also capturing conditions such as illumination, the device characteristics, angle of the device.
To retrieve desired images, user has to provide a query image. The system then performs certain feature extraction procedures on it and represents it in the form of feature vectors. The similarities distances between the feature vectors of the query image and those of the images in the database are then calculated and retrieval is performed with the help of indexing schemes. The indexing scheme provides an efficient way to search for the image database. Recent retrieval systems have incorporated users' relevance feedback to modify the retrieval process in order to generate perceptually and semantically more meaningful retrieval results. Fig.1 shows the architecture of a typical CBIR system.
Fig 1:- The image retrieval process. [3]
For each image in the image database, its features are extracted and the obtained feature space (or vector) is stored in the feature database. When a query image comes in, its feature space will be compared with those in the feature database one by one and the similar images with the smallest feature distance will be retrieved as shown in Fig 1.
2. METHODS AND PROCESS:
The method of image searching and retrieval proposed here mainly focuses on the generation of the feature vector by calculating the average means.
Steps of the algorithm are given below.
Step1: Three color planes namely Red , Green and Blue are separated. Step2: For each plane row mean and column mean of colours are calculated.
Pictorially the average row and column mean is calculated as follows
Fig: 2 Pixel values of an plane of a 5x5 image.
Step3: The average of all row means and all columns means is calculated for each plane.
Step4: The features of all 3 planes are combined to form a feature vector. Once the feature vectors are generated for all images in the database, they are stored in a feature database [5].
Step5: The Euclidian distances [4] between the feature vector of query image and the feature database are calculated using Eq (1) given below.
. (1)
The value of d is calculated by summation of the squares of difference of the features of database image and query image as mentioned in Eq. (1). Lower the value of E ie. [d(yq,xi)] in Eq. (1) indicates higher relevance to the query image.
Step6: The algorithm performance is measured based on the Precision – Recall cross over point. Taking 5 randomly selected images per class, average precision-recall cross over point is plotted and compared for both database.
After finding out the Euclidean Distance for the query image the precision and recall values are also generated as shown in Eq. (2) and Eq. (3) respectively.
. (2)
(3)
Precision [5][7]: Precision is the fraction of the relevant images which has been retrieved (from all retrieved). Precision checks the completeness of the algorithm. The precision values can be plotted between 0-1. This value can be represented in the percentage.
Recall [5][6][8]: Recall is the fraction of the relevant images which has been retrieved (from all relevant). Recall checks the accuracy of the algorithm. The recall values can be plotted between 0-1. This value can be represented in the percentage.
In this paper we have used the precision-recall cross over point to evaluate the performance of the algorithm. The cross over point obtained is the point of intersection of precision and recall as shown in the Fig.5.
3. RESULTS AND DISCUSSIONS:-
Table 1: Classification for database of 300 images.
Class
Beaches
Monuments Buses
Dinosaurs
Elelphants
No. of
images
67
66
66
67
34
Table 2: Classification for database of 1000 images.
Class
Beaches Monuments Buses
Dinosaurs Elephants Flowers Horses
No. of
images
67
66
66
67
66
66
66
Class
Sky
Food dishes Sunsets Galaxies
Textures
Nature
Butterflies
No. of
images
66
66
66
66
66
139
67
Images in each class are of a similar type with respect to its pattern, background, foreground etc. Feature vector for a query image and all images in database is generated. Euclidian distance of all images in database with respect to query image is calculated. The query image with minimum value of Euclidian distance is considered as better match. The precision [5][9-13] and recall to measure the retrieval performance of the algorithm is calculated using Eq. (2) and Eq. (3).
To discuss the performance of the algorithm we have considered the beach class as an example. The query image for the same is shown in the Fig 3 given below. This query image is used for both the databases.
Fig.3 Query Image
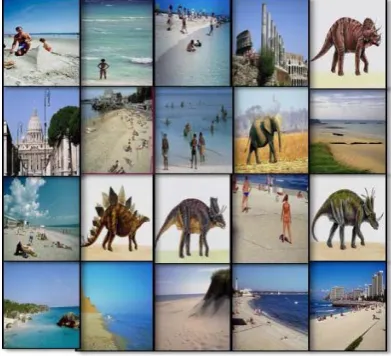
The algorithm is applied on the first database of 300 images to generate feature vector for each image in the database and the query image and hence calculate the Euclidian distance to find the better match. The algorithm has produced very good results as it can be seen in the fig. 4 below where the first 20 retrieved images found are shown.
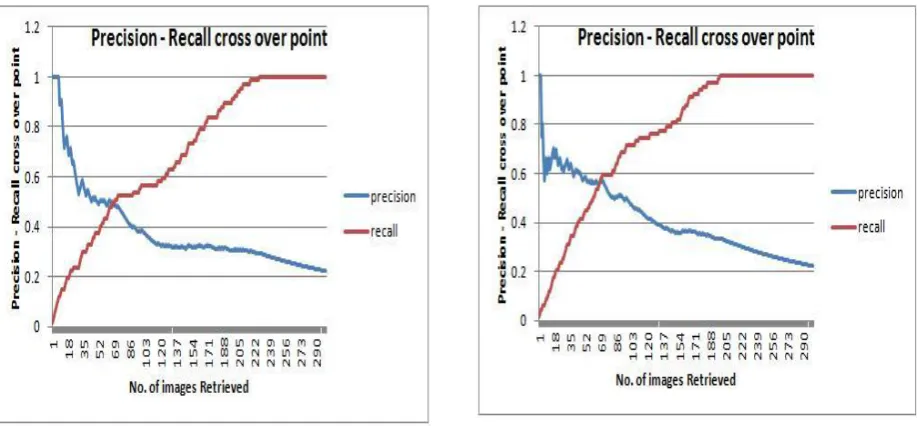
Fig 4 is result when the query image is compared with 300 different images of only 5 different classes. It is observed that in first 20 retrievals, the number of relevant images from same class are 9. The rest of the images belong to different classes like dinosaur’s, monuments, sky and elephants. The images from these classes are observed because the comparisons are made on the bases of the color scheme. Hence a few images from different classes where the basic color shade, blue is prominent are also retrieved. First three images are of same class. The precision-recall cross over plot for the same is shown in the Fig. 5 below.
Fig 5: Graph of precision and recall for query image 1 with database of 300 images.
The point of cross section of precision and recall over the maximum number of relevant retrieval for database of 300 images is seen in fig 5. Here X axis represents the images retrieved and Y axis denotes the precision –recall value. Crossover point in precision and recall is the point on the graph where both the precision and recall curves meet. Crossover point can be used in a way to measure how correct our algorithm is, higher the crossover point, better is the performance of the method. [5]
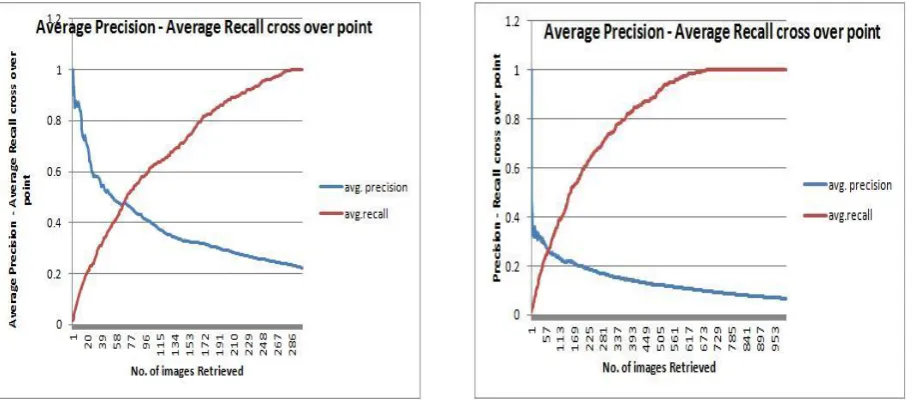
Whereas when the same query image (refer Fig 3) is compared with the database of 1000 images the result differs as the comparison is made with all 14 classes, where the no. of similar images decreases substantially (refer Fig 6). The number of relevant images to the query image is 4 in the first 20 relevant images. Thus the result of retrieved relevant images changes drastically.
The effect in change of precision and recall values can be seen also in the graph plotted (fig. 7) for given query image. Also the value of precision-recall cross over point changes compared to that of database of 300 images(refer Fig 5).
Fig. 7: Graph of precision and recall for database of 1000 images. [5]
As the comparison is done on the bases of the colors, the relevancy of image decreases. This helps us to infer that that size of database thus effect the result. This is further justified using recorded results of different query images on different database size. When the graphs are plotted by randomly selecting 5 sample images from same class of database, results found are as shown in Fig 8 – Fig 15.
Fig 8: Query image2 compared with database of 300 images.
Fig 10: Query image4 compared with database of 300 images.
Fig 11: Query image5 compared with database of 300 images.
The different images of the same class give results ranging from 30% (Fig.5) to 60% (Fig 10) for a database of size 300. Results can be further improved by dividing the database vividly over different classes. The change in percentage of relevant retrievals due to change in size of database from 300 to 1000 can be seen in Fig 12- Fig.15.
Fig 12: Query image2 compared with database of
Fig 14 : Query image4 compared with database of
1000 images. Fig 15 : Query image5 compared with database of 1000 images.
The consolidated view of the comparison of the final retrieval output is done by calculating the average precision-recall cross over points for both database sizes. The average precision-recall cross over is the average of all five precision-recall cross over plots shown in the Fig 8-Fig.11 and Fig.12-Fig.15. These average performances have been plotted in the Fig.16 and Fig.17 below.
Fig 16 : Average precision and average recall cross
over point for database of 300 images. Fig 17 : Average precision and average recall cross over point for database of 1000 images.
4. CONCLUSION:-
We have presented a algorithm for searching and retrieving images in this paper. We have used the average means of each Red, Green and Blue component of images separately. We have used two databases of different sizes. The database one consists of 300 images whereas other database has 1000 images in it. The paper shows the first 20 retrievals of the particular class, the precision-recall cross over plots of five randomly selected images for the same and finally the average precision-recall cross over of that class. These all three results have been shown for both databases. The average precision and recall of each class fig.16 and fig.17, which has cross over point at 50% for a database of 300 images which is a good performance and at 30% for a database of 1000 images. The results also conclude that size of database and number of different classes affects the relevancy of retrieved image. The final retrieval results of the any CBIR system is based on the how better the intra class similarity it has and the size of the image database.
5. REFRENCES:-
[1]. John Eakins ,Margaret Graham, University of Northumbria at Newcastle “Content-based Image Retrieval”,JISC technology applications, October 1999.
[2]. Mathieu Lamard, Guy Cazuguel, Gw´enol´e Quellec, Lynda Bekri, Christian Roux, B´eatrice Cochener, “Content Based Image Retrieval based on Wavelet Transform coefficients distribution” HAL author manuscript inserm-00189859, version 1.
[3]. N.Krishnan, M.Sheerin Banu, C.Callins Christiyana, “Content Based Image Retrieval using Dominant Color Identification Based on Foreground Objects”, International Conference on Computational Intelligence and Multimedia Applications 2007.
[4]. H.B. Kekre, Sudeep D. Thepade, Akshay Maloo, “Performance Comparison of Image Retrieval using Row Mean of Transformed Column Image”, (IJCSE) International Journal on Computer Science and Engineering Vol. 02, No. 05, 2010, 1908-1912.
[5]. H.B.Kekre, Dhirendra Mishra “CBIR using Upper Six FFT Sectors of Color Images for Feature Vector Generation”,InternationalJournalofEngineeringandTechnology,vol2(2),2010,49-5
[6]H.B.Kekre, Dhirendra Mishra, “Image retrieval using image hashing”, Techno-Path: Journal of Science, Engineering & Technology Management, SVKM’s NMIMS Vol. 2 No.1 Jan 2010
[7] H.B.Kekre, Kavita sonavane, “Feature extraction in bins using global and local thresholding of images for CBIR”,International journal of computer applications in Engineering,Technology and sciences (IJ-CA-ETS) Vol. 2,Issue1,pp. 34-41,Oct 09-March 10.
[8] H.B.Kekre, Sudeep D. Thepade, “Boosting Block Truncation Coding using Kekre’s LUV Color Space for Image Retrieval”, WASET International Journal of Electrical, Computer and System Engineering (IJECSE), Volume 2, No.3, Summer 2008. Available online at www.waset.org/ijecse/v2/v2-3-23.pdf.
[9]Minutiae and texture features,” Int’l conference on Image Processing (ICIP), pp. 282-285, Oct. 2001.
[10] John Berry and David A. Stoney “ The history and development of finger printing,” in Advances Fingerprint Technology, Henry C. Lee and R. E. Gaensslen, Eds., pp. 1-40. CRC Press Florida, 2nd edition, 2001.
[11] Emma Newham, “The biometric report,” SJB Services, 1995.
[12] H.B.Kekre, Sudeep D. Thepade, “Using YUV Color Space to Hoist the Performance of Block Truncation Coding for Image Retrieval”, IEEE International Advanced Computing Conference 2009 (IACC’09), Thapar University, Patiala, INDIA, 6-7 March 2009.
[13] H.B.Kekre, Sudeep D. Thepade, “Image Retrieval using Augmented Block Truncation Coding
![Fig 1:- The image retrieval process. [3]](https://thumb-us.123doks.com/thumbv2/123dok_us/9665329.1494389/2.595.200.392.245.462/fig-the-image-retrieval-process.webp)
![Fig. 7: Graph of precision and recall for database of 1000 images. [5]](https://thumb-us.123doks.com/thumbv2/123dok_us/9665329.1494389/6.595.200.519.402.612/fig-graph-precision-recall-database-images.webp)