e-ISSN: 2278-7461, p-ISSN: 2319-6491
Volume 6, Issue 6 [June. 2017] PP: 40-48
Level of Service Needs of Waveguide At The Port of Soekarno
Hatta Makassar
*
Albertha Lolo Tandung
1, Shirly Wunas
2, Ganding Sitepu
31 Master Degree of Transportation Planning, Faculty of Postgraduate, Hasanuddin University, 2
Professor, Urban and Regional Planning, Hasanuddin University, Makassar-Indonesia ³Lecturer, Transportation Engineering, Hasanuddin University, Makassar-Indonesia
Corresponding Author: Albertha
Abstract
: The port is a very important node in the smooth flow of trade by sea, it is expected that the good service from the port authority. This research aims to determine (1) the factors that become obstacles in operational guidance at the port of Soekarno Hatta Makassar (2) the need of scouting personnel at the port of Makassar to the number of ship movements (3) the prediction of the number of scouting personnel required port Soekarno Hatta Makassar to year 2025. This research is a qualitative research by using simple regression model analysis technique to predict the variable Y to independent variable X, or determine the relationship between Y and X. The results show that (1) the supporting factors in the operational guidance at the port Soekarno-Hatta Makassar: Availability of guidance personnel in service, availability of scouting facilities, and ability of guiding personnel and condition of ship, (2) scouting personnel needs at port of Makassar is still sufficient (8) and supporting facilities are still in good category, 3) The forecasting will the number of scouting personnel to be in need at the port of Soekarno-Hatta Makassar until the year 2025 is still sufficient.Keywords
: Availability, Scouting, Port of Soekarno Hatta--- --- Date of Submission: 26-07-2017 Date of acceptance: 08-08-2017
---
---I.
INTRODUCTION
Transportation is one of the most important sectors of activity in the interrelated needs of everyone. Transportation is also a system consisting of facilities and infrastructure, where transport services with safety assurance will provide certainty and calm for the traveler or the owner of goods, so that social economic activities of society can be protected (Jinca, 2011)
A port should have adequate facilities and infrastructure in loading and unloading activities at the port. As a transportation subsystem, the port is the node of the smoothness of sea and land transportation. Thus, the port is a watershed protected against storms, waves, and currents, so the vessel can hold movement, lean, throw anchor in such a way that loading and unloading on goods and passengers and freight movements can be carried out safely.
The port is an important node in the flow of trade and distribution of logistics in Indonesia as well as in the world. The data show eighty-five percent (85%) of world trade by sea, while trade in Indonesia is 90% by sea (Arianto Patunru et.al, 2007). The existence of such condition is expected to be a good service from the port authority (harbour-mastership) as the regulatory controller and PT Pelabuhan Indonesia (a company of Indonesian Port) as the controller of the ship's guidance services which will be anchored, leaned and departed from and to the port.
Scout personnels are expected to have the expertise and uphold the professionalism in doing the service to the ship visitors. Skill expertise in running or processing the motion of the ship is determined by the number of work experience, education and professional training waveguide. Guided professionalism should be maintained, even enhanced in the sense of being adapted to shipbuilding technology advances and procedural requirements that are constantly aligned with applicable regulations. Skilled personnel as well as adept at navigating or being called as a voyage. Expert predictors with specific expertise are given to those who know the importance of relative signals in their environment.
Management Branch Port IV of Makassar has the power of guiding personnel (human resource) as many as 8 people working concurrently top management and support staff. So that in certain conditions in maximizing the guidance services still carry out their duties and responsibilities.
From 2011-2016 data processing results show that in 2011 the flow of ship visits visiting the port of Soekarno Hatta Makassar recorded 5625 ship movement consisting of domestic and foreign ships. In 2012 as many as 5493 ship movements, in 2013 there was a significant decrease of 4255 ships movement, in 2014 as many as 4368 ship movement, in 2015 as much as 5487 ship movement and in 2016 as much as 5460 movement of ships.
This condition requires the service of scouting the ship become the spearhead of PT Pelabuhan Indonesia IV Makassar which is the beginning and end of the whole series of scouting services activities. In improving the ship's guidance service at this port, the supporter of human resources guiding the ship needs to get attention in its guidance. So that its role in guidance services at the port will provide maximum results and satisfy the users of guidance services.
The port provides facilities and services for the visitor's boat. In terms of service is divided into two groups, namely services for ships and services for logistics. One of the services for ships is the pilotage service which includes pilotage activities in assisting the shipmaster to navigate to carry out safety activities, providing information on the state of the waters (currents, winds, waves) of the most important for the safety of ships, passengers and cargo when entering the cruise line to the pier. Ship service operations include the activities of planning and execution of ship moorings directed to the utilization of mooring sites to be adapted to the type and type of vessel, the type of cargo to be dismantled or loaded, the use of optimal loading and unloading equipment and the selection of warehouses and conglomerates of logistics in accordance with Needs and smooth distribution of logistics in order to produce ship dispatch.
The scout is worthy of bearing the title as a professional in carrying out his main function by remembering that when as the officer or skipper of the ship concerned is the service user of the scouting, then becomes the intended service provider. As a scouting service provider, scout serves on the company's mandate, vision and mission. Bound with fellow employees and honor the symbol as a symbol of the company's personality.
II.
METHODOLOGY
Location and Time of Research
The location of this research is PT Pelabuhan Indonesia IV (shareholder) Makassar branch of South Sulawesi, with a research period of 6 months from January-June 2016 covering the preparation phase, data collection, data analysis and preparation of research results.
Data analysis methods
In qualitative research the process of analysis and interpretation of data requires a way of thinking creatively, crisis and very carefully. Both processes are interrelated and very closely related.
According to Manurung Haymans (1990). Forecasting techniques can be grouped into two categories: quantitative and qualitative methods. Forms of quantitative forecasting can be used if it fulfills the following conditions ie the existence of information about the past such as: Such information can be quantified in the form of data. A simple regression model is used to predict the variable Y to the independent variable X, or determine the relationship between Y and X, namely:
Y = a + bX + Information :
Y = The variable is not free X = Independent variable
a =The intercept coefficient can be determined by the formula;
𝒂 =( 𝒀𝒊) 𝒙 ( 𝑿𝒊𝟐)−( 𝑿𝒊) 𝒙 ( 𝑿𝒊.𝒀𝒊) 𝒏𝒙 ( 𝑿𝒊𝟐)−( 𝑿𝒊)𝟐
b = The value of the coefficient of independent variables, with the following equation
𝒃 =𝒏𝒙 𝑿𝒊𝒙𝒀𝒊− 𝑿𝒊𝒙𝒀𝒊 𝒏𝒙𝑿𝒊𝟐−( 𝑿𝒊)𝟐
III. RESULTS AND DISCUSSION
Level of Service Guiding Ship at the Port of Soekarno-Hatta Makassar
Table 1. The personnel of the scout ship
No. Name of Personil Call Name/Nomor
1 2 3 4 5 6 7 8 Abd. Afif A. Mustafa Handi Amir Heri Suparyo Adi Hoseo Sulhaji Sitangga
Pa Pa 1 Pa Pa 2 Pa Pa 3 Pa Pa 4 Pa Pa 5 Pa Pa 6 Pa Pa 7 Pa Pa 8
Source: PT. Pelindo IV Makassar, 2017
The movement of ships in the Port of Soekarno-Hatta Makassar from 2002 up to 2016 can be seen in Table 2.
Table 2. Number of Ship Movements at Soekarno-Hatta Port of Makassar
No. Year Number of Ship Movements/Ship Visits
1 2 3 4 5 6 7 8 9 10 11 12 13 14 15 2002 2003 2004 2005 2006 2007 2008 2009 2010 2011 2012 2013 2014 2015 2016 4620 4547 4693 4839 4985 5396 5216 5320 5553 5504 5493 4255 4368 4371 4369
Source: PT Pelabuhan Indonesia Makassar, 2017
The table 2 shows the movement of ships at the Port of Soekarno Hatta Makassar in a fluctuating state. In 2007 to 2012 the movement of ships per year averaged 5,396 movements up to 54493, but increased although not significant by reaching the movement of 5553 movements in 2010. In 2013 it decreased to the lowest point of 4255. But in the year 2014 up to 2016 again increased even though only reached the number of 4371 ship movement per year. When compared with the year 2005 to the year 2006 which is in the movement of 4,839 to 4,985 movement of ship per year, decreased significantly. Then forecasting the movement of ships from 2017 to 2025 can be seen in Table 3.
Table 3. The forecasting Number of Ship Movements Year 2017 up to 2025
No. Year Number of Ship Movements/Ship Visits 1 2 3 4 5 6 7 8 9 2017 2018 2019 2020 2021 2022 2023 2024 2025 4767 4750 4734 4717 4700 4683 4667 4650 4633
Source: Results of the analysis, 2017
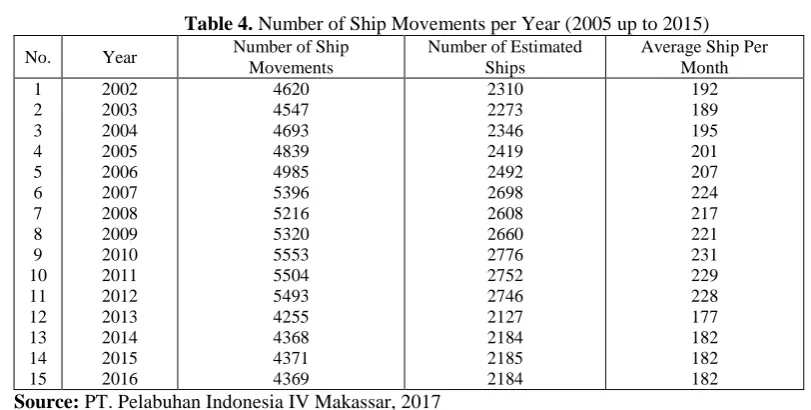
Table 4. Number of Ship Movements per Year (2005 up to 2015)
No. Year Number of Ship Movements
Number of Estimated Ships
Average Ship Per Month 1 2 3 4 5 6 7 8 9 10 11 12 13 14 15 2002 2003 2004 2005 2006 2007 2008 2009 2010 2011 2012 2013 2014 2015 2016 4620 4547 4693 4839 4985 5396 5216 5320 5553 5504 5493 4255 4368 4371 4369 2310 2273 2346 2419 2492 2698 2608 2660 2776 2752 2746 2127 2184 2185 2184 192 189 195 201 207 224 217 221 231 229 228 177 182 182 182
Source: PT. Pelabuhan Indonesia IV Makassar, 2017
The table 4 shows that there is a decrease in the movement of ships, the estimated number of ships that enter each year will decrease as well as the number of ships leaned at the Port of Soekarno-Hatta on average per month, in 2002 with the movement of the ship reached 4,620 movements, the average of the estimated ship that is leaned is 2,310 assuming the ship is guided 2 times (in and out). While the average number of ships per month is 192 ships. The movement of the highest ship occurred in 2010 with the movement of 5,553 movements, then the estimated number of ships that leaned at the Port of Soekarno Hatta Makassar as many as 2676 ships. The average number of ships per month is 231 ships. The smallest ship movements occur in 2013 with a total movement of 4,255. The estimated number of ships that leaned at the port of Soekarno-Hatta Makassar as many as 2.127 ships and the number of ships per month averaged as many as 177 ships. Furthermore, in Table 5 will be described forecasting the movement of ships per year (2017 up to 2025).
Table 5. Forecasting Number of Ship Movements per Year (2017 up to 2025)
No. Year Number of Ship Movements
Number of Estimated Ships
Average Ship Per Month 1 2 3 4 5 6 7 8 9 2017 2018 2019 2020 2021 2022 2023 2024 2025 4767 4750 4734 4717 4700 4683 4667 4650 4633 2383 2375 2367 2358 2350 2341 2333 2325 2316 198 197 197 196 195 195 194 193 193
Source: Results of the analysi, 2017
Table 5 shows the forecast of the estimated number of ships to be leaned in Makassar Port, the highest occurring in 2017 reaching 2383 ships with an average number of ships per month as many as 198 ships. The existence of the number of ship movements that are not significant increase, enough to affect the average ship per month that leaned at the Port of Soekarno-Hatta Makassar. Ship movements are lacking, especially in this research because of the limitation of factors affecting the time factor of the ship's delay. In the following table will explain the average number of ships per day with the ratio of the number of ships/waveguides.
Table 6. Average Number of Ships per day (2005 up to 2015)
Year Number of ship movements
The estimated number of ships
Number of ships Average monthly
Average Number of ships per day
Ratio The number of ships/waveguides
2002 4620 2310 192 6 6 : 8
2003 4547 2273 189 6 6 : 8
2004 4693 2346 195 6 6 : 8
2005 4839 2419 201 6 6 : 8
2006 4985 2492 207 6 6 : 8
2007 5396 2698 224 7 6 : 8
2008 5216 2608 217 7 7 : 8
2009 5320 2660 221 7 7 : 8
2010 5553 2776 231 7 7 : 8
2012 5493 2746 228 7 7 : 8
2013 4255 2127 177 5 5 : 8
2014 4368 2184 182 5 5 : 8
2015 4371 2185 182 5 5 : 8
2016 4369 2184 182 5 5 : 8
Source: Results of the analysi, 2017
The table 6 shows that the number of ships that lean at the Port of Soekarno Hatta Makassar is also in a fluctuating condition even in the year 2013 up to 2016 decreased the average number of ships per day ie as many as 5 ships so that the ratio of the number of ships/wavers (personnel) also decreased Ie only needed 5 ships per day with the number of wagers or personnel as many as 8 people. This indicates that there are still enough warships to provide guidance to the ship to be leaned and also the availability of waveguides sufficient to provide services to the ship that will be anchored in the Port of Soekarno-Hatta Makassar. Furthermore, in Table 7, it will be explained the average forecasting of the number of ships per day (2017 up to 2025) to be leaned at Makassar's Soekarno-Hatta Port.
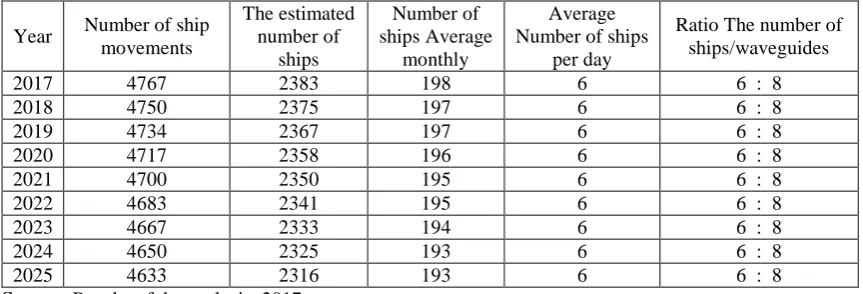
Table 7. Average Forecasting Number of Ships Per day (2017 up to 2025) which will be leaned at the Port of Soekarno-Hatta Makassar
Year Number of ship movements
The estimated number of
ships
Number of ships Average
monthly
Average Number of ships
per day
Ratio The number of ships/waveguides
2017 4767 2383 198 6 6 : 8
2018 4750 2375 197 6 6 : 8
2019 4734 2367 197 6 6 : 8
2020 4717 2358 196 6 6 : 8
2021 4700 2350 195 6 6 : 8
2022 4683 2341 195 6 6 : 8
2023 4667 2333 194 6 6 : 8
2024 4650 2325 193 6 6 : 8
2025 4633 2316 193 6 6 : 8
Source: Results of the analysis, 2017
The data in the table 7 shows that from 2017 up to 2025 the average number of ships per day is 6 ships, while the number of waveguides is not affected. This happens because in 2017 up to 2025 the number of ship movements decreased so that the forecasting estimation of the number of ships that are leaned included the forecasting of the average number of ships per month that decreased, so that the port of Soekarno-Hatta Makassar does not require the addition of pandu ships and pandunya. Further in Table 8, it will be explained the number of hours of guide service (from outside to the pier) with an average of 30 minutes per ship.
Table 8. Number of Service Hours (from Outside to pier) per month
Year Number of ships Average monthly Number of hours of guidance service per month (minutes)
2002 192 5760
2003 189 5670
2004 195 5850
2005 201 6030
2006 207 6210
2007 224 6720
2008 217 6510
2009 221 6630
2010 231 6930
2011 229 6870
2012 228 6840
2013 177 5310
2014 182 5460
2015 182 5460
2016 182 5460
The table 8 shows that the number of hours of guidance service per month depends on the number of ships averaged per month in the Port of Soekarno-Hatta Makassar, the largest number of hours per month as in 2010 with the number of ships 231 units and the number of service hours of 6,030 minutes per month. The table 9 provides an overview of the number of hours of wizard service (from outside to pier) per month.
Table 9. The forecasting Clock Service Scout (from Outside to pier) per month
Years
Number of ships Average monthly
Number of hours of guidance service
per month (minutes)
2017
198
5940
2018
197
5910
2019
197
5910
2020
196
5880
2021
195
5850
2022
195
5850
2023
194
5820
2024
193
5790
2025
193
5790
Source: Results of the analysi, 2017
Table 9 shows that the number of hours of guidance service per month (minutes) the highest achievement occurred in 2017 with the number of ships 198 fruit with the number of hours of guidance service of 5.940 minutes per month. Furthermore Table 10 is the number of hours of waveguide service (from outside to pier) averaging 30 minutes per day.
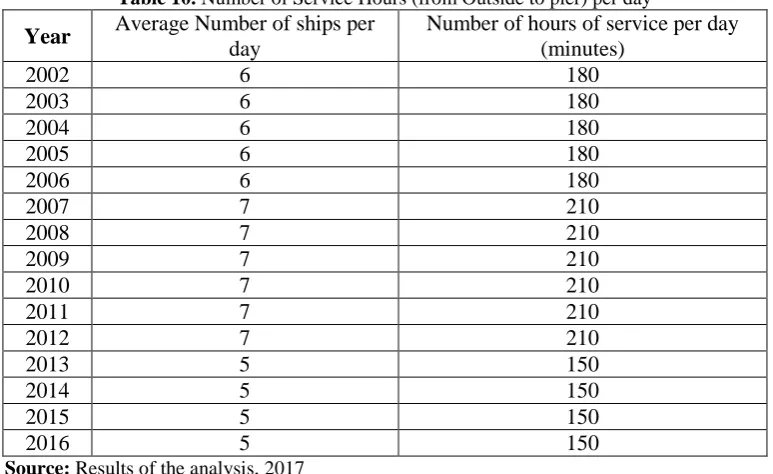
Table 10. Number of Service Hours (from Outside to pier) per day
Year
Average Number of ships per
day
Number of hours of service per day
(minutes)
2002
6
180
2003
6
180
2004
6
180
2005
6
180
2006
6
180
2007
7
210
2008
7
210
2009
7
210
2010
7
210
2011
7
210
2012
7
210
2013
5
150
2014
5
150
2015
5
150
2016
5
150
Source: Results of the analysis, 2017
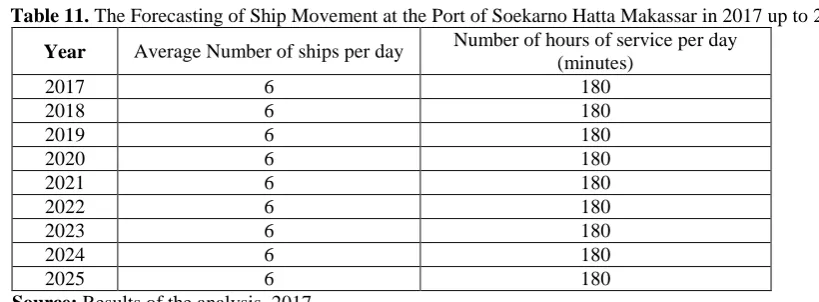
Table 11. The Forecasting of Ship Movement at the Port of Soekarno Hatta Makassar in 2017 up to 202
Year Average Number of ships per day Number of hours of service per day (minutes)
2017 6 180
2018 6 180
2019 6 180
2020 6 180
2021 6 180
2022 6 180
2023 6 180
2024 6 180
2025 6 180
Source: Results of the analysis, 2017
The table 11 shows that from 2017 up to 2025 the number of ships with an average of 6 ships, the time or number of guiding services per day (minutes) takes 180 minutes with service time of each ship for 30 minutes. The forecast (for casting) for the year 2017 up to 2025 can be seen in Table 12.
Table 12. TheForecasting of Ship Movement in 2017 at the Port of Soekarno-Hatta Makassar
Year Code year Number of ship movements
X Y
2017 2018 2019 2020 2021 2022 2023 2024 2025
8 9 10 11 12 13 14 15 16
4767 4750 4734 4717 4700 4683 4667 4650 4633
Source: Results of the analysis, 2017
The forecasting is done by using a linear trend that produces a linear function form as follows: Y = a + bX
a = 4901,93333 b = -16.775
Factors Cause Delay in Ships Guidance
There are several factors that cause the delay in guiding the ship, such as:
a) Natural factors. Natural factors that occur at the port, including at the Port of Soekarno Hatta Makassar is a factor of sudden high waves with high waves can affect the speed of the ship in a change of motion. Similarly, the heavy current that occurs when the ship has been at the point of waveguide with an average distance of 10 to 30 nautical miles from the destination pier. Meanwhile, the next weather factor is the wind speed that is enough to give the effect of the speed of the ship to reach the pier. Good command from the skipper to waveguide is needed.
b) The condition of the ship. The age of the ship is also a contributing factor to the delay in guiding the ship. The ship with old age affects the speed of the ship's grack as well as the weight and load of the ship. The better the condition of the ship increasingly affect the speed as well as facilitate the waveguide to guide him to the pier.
IV. CONCLUSION AND RECOMMENDATION
Conclusion
The various factors that support the operational guidance in the port of Soekarno-Hatta Makassar as follows: (1) Availability of guiding personnel in the service of the number of movement of ships processing motion at the Port of Makassar. (2) The availability of scouting facilities and vessel (pilot motor, tugboat to assist in berthing and unberthing) of 6 ships become the strength in every task service implementation at the port of Makassar, (3) ability of guiding person or professional personality source Human power working in ship-hunting services that will process ship berthing, unberthing, anchored and other motion movements will minimize the use of more maximal working time, (4) Ship condition, the age of the ship will make the activity in the guiding process easier and does not take much time.
The results of the analysis of scouting personnel needs on the port of Makassar to the number of ship movements, by looking at the movement of ships in the Port of Soekarno-Hatta Makassar from 2002 up to 2016 and the results of forecasting using the formula Least Square (Linear Trend) then the number of guiding personnel as much as 8) people and supporting facilities of 6 pieces are still sufficient, so the guiding service is still quite good.
The forecasting of the number of scouting personnel to be needed at the Soekarno-Hatta port of Makassar until 2025, is still sufficient with the number of personnel 8 people. Assuming that based on the calculation result through linear trend, it is found that the average movement of ships is 6 ships per day with the time spent 30 minutes in the process of ships movement on the port of Soekarno-Hatta Makassar.
The average movement of ships in every day from the results of data analysis, providing forcasting until the year 2025 is still sufficient, but if the expansion of the pier or mooring port there will be the addition of guiding personnel to serve the movement of the ship.
Recommendation
The suggestion in this research is: to PT Pelabuhan Indonesia IV (shareholder) Makassar in order to make the result of this research as a consideration in making policy of human resource improvement (scout personnel) in carrying out its duty and responsibility in guiding ships at the port of Soekarno-Hatta Makassar, as well as the adequacy of suggestions and guidance infrastructure so that guide services can be improved. For seafarers in general who will be the guiding force and who has become a guide on the scope of Indonesian Port (Pelindo), especially the region of Makassar, to make reference resources in improving its competence professionally in carrying out its duties and responsibilities in guiding on board. Then the policy in decision making in the government involved at the port of Soekarno-Hatta can make reference/reference data if there is addition or expansion of port especially in Makassar area.
REFERENCES
[1] JICA., (2001). Study of Transportation in Eastern Indonesia and Ferry Ro-Ro Standardization. Thesis Department of Naval Faculty of Engineering Hasanuddin University.
[2] Jinca, M. Yamin. 2011. Sea Transport Indonesia, Surabaya: Brilliant International [3] Agus Dharma, 2008, Training Planning, Jakarta: Pusdiklat Employees Depdikbud.
[4] Bernardin, H. John & Joyce E. A. Russell, 2003, Human Resource Management. Singapore : McGraw Hill Inc.
[5] Buchari Zainun, 2010. Management and Motivation. Jakarta: Balai Aksara
[6] Danim, Sudarwan, 2002. Become a qualitative researcher. Bandung: Loyal Library, 2002
[7] Donnelly, Gibson, and Ivancevich, 2004. Management Edition Nine Volume 1, Interpretation: Zuhad Ichyaudin. Jakarta: Erland
[8] Fattah, Nanang, 2009. Platform Management. Bandung: Rosda Karya
[9] Gomes, Faustino Cardoso, 2003. Human Resource Management. Yogyakarta: Andi Offset
[10] Gordon, Thomas, 2004. Become an Effective Leader: Basis for Participatory Management and Employee Involvement. Alex Tri Kantjono Widodo's Translation. Jakarta: Gramedia Pustaka Utama
[11] Hasibuan, SP., 2001. Human Resource Management. Jakarta: Earth Literacy
[12] Hessel Nogi, 2005. Company Performance Evaluation. Jakarta: PT Gramedia Pustaka Utama
[13] Jones, Pam. 2002. Smart Book of Performance Management. Anthony R. Indra Translation. Jakarta: Metalexia Publishing & PT Qreator Tata Qarakter
[14] Koontz, Harold & Cyril O'Donnel & Heinz Weihrich, 2006. Management. Volume 2. Translation: Gunawan Hutauruk. Jakarta: Erlangga Publisher.
[15] Nana Syaodih Sukmadinata, 2005. The Foundation of Psychology of Education Process. Bandung: PT. Youth Rosdakarya.
[17] O'Leary, Elizabeth., 2001. Leadership: Master the Skills You Need in 10 minutes. Treasure of Deddy Jacobus. Yogyakarta: Andi Copyright.
[18] Prawirosentono, Suyadi, 2008, Employee Performance Policy. Yogyakarta: BPFE [19] Rivai, Veithzal. 2010. Performance Appraisal. Jakarta: PT Raja Grafindo Persada [20] Rusli Syarif, 2001. Engineering Management Training and coaching, Bandung: Space [21] Sadili Samsudin. 2005. Human Resource Management. Bandung Pustaka Setia [22] Saefullah, 2009. Fundamentals of Management. Medan: Monara
[23] Sampara Lukman, 2010. Quality Management Services, Jakarta: STIA LAN. Press [24] Sedarmayanti. 2010. Human Resources and Work Productivity. Bandung: Mandar Maju [25] Simamora, Henry, 2004 Human Resource Management. Yogyakarta: YKPN
[26] Sir, Jacob, 1998. Management of Shipping Company II. Medan: Department of Management of AMI Medan Commercial Shipping
[27] S. Ruky. A., 2001, Performance Management System: Performance Management System, Practical Guide for Designing and Achieving Excellent Performance. Jakarta: PT. Gramedia Pustaka Utam
[28] Stolovitch, Harold D., and Keeps, Erica J., 2002, Handbook of Huma Performance Technology A Comprehensive Guide for Analysis and Solving Performance Problems in Organizations. San Francisco: Jersey-Bass Publisher.
[29] Sugiyono, 2006. Administrative Research Methods, 8th Print, Alfabeta Publisher
[30] Supranto John, 2007. Measuring the Level of Customer Satisfaction to Increase Market Share. Jakarta: Rineka Cipta
[31] Wood, Jack & Joseph Wallace & Rachid M. Zeffane, 2001. Organizational Behavior a Global Perspectives. Australia: John Willey & Sons.
[32] Yeremias T. Keban, 2004. Management: Concepts, Principles and Applications. Bandung: Publisher Agnini