https://dx.doi.org/10.24001/ijaems.3.5.17 ISSN: 2454-1311
Image Mining for Flower Classification by
Genetic Association Rule Mining Using GLCM
features
Aswini Kumar Mohanty, Amalendu Bag
Kmbb College of Engg, Bhubaneswar, Odisha, India
Abstract— Image mining is concerned with knowledge discovery in image databases. It is the extension of data mining algorithms to image processing domain. Image mining plays a vital role in extracting useful information from images. In computer aided plant identification and classification system the image mining will take a crucial role for the flower classification. The content image based on the low-level features such as color and textures are used to flower image classification. A flower image is segmented using a histogram threshold based method. The data set has different flower species with similar appearance (small inter class variations) across different classes and varying appearance (large intra class variations) within a class. Also the images of flowers are of different pose with cluttered background under varying lighting conditions and climatic conditions. The flower images were collected from World Wide Web in addition to the photographs taken up in a natural scene. The proposed method is based on textural features such as Gray level co-occurrence matrix (GLCM). This paper introduces multi dimensional genetic association rule mining for classification of flowers effectively. The image Data mining approach has four major steps: Preprocessing, Feature Extraction, Preparation of Transactional database and multi dimensional genetic association rule mining and classification. The purpose of our experiments is to explore the feasibility of data mining approach. Results will show that there is promise in image mining based on multi dimensional genetic association rule mining. It is well known that data mining techniques are more suitable to larger databases than the one used for these preliminary tests. Computer-aided method using association rule could assist people and improve the accuracy of flower identification. In particular, a Computer aided method based on association rules becomes more accurate with a larger dataset .Experimental results show that this new method can quickly and effectively mine potential association rules.
Keywords— Gray Level Co-occurrence Matrix features, Histogram Intensity, Classification, Genetic Algorithm; Association rule mining, Confusion matrix, Segmentation. Texture features; Color features.
I. INTRODUCTION
Developing a system for classification of flowers is a difficult task because of considerable similarities among different classes [1]. In a real environment, images of
flowers are often taken in natural outdoor scenes where the lighting condition varies with the weather and time. Also, there is lot more variation in viewpoint of flower images. All these problems lead to a confusion across classes and make the task of flower classification more challenging. In addition, the background also makes the problem difficult as a flower has to be segmented automatically.
There is a huge number of flower species in the world. It is impossible for someone to remember the names of all flowers. Most of the people who can identify the flowers are not specialists. Also because, there is similarity between the flowers it is hard for someone to not get confused when identifying flowers. A digital flower classification and identification system can be used for automatic recognition of flowers without requiring the expertise of floriculturist Flower identification research has been growing nowadays and it is mainly used to recognize the flower by extracting its features. Without having proper resources like books, notes etc., many researchers, scientists of agriculture, medical and other fields find difficulties to identify and define various flower images. Applications of classification of flowers are also found to be useful in floriculture; flower searching for patent analysis, etc. [3].
Developing a system for classification of flowers is a difficult task because of considerable similarities among different classes and also due to a large intra-class variation [2]. In a real environment, images of flowers are often taken in natural outdoor scenes where the lighting condition varies with the weather and time [5]. Also, there is lot more variation in viewpoint, occlusions, scale of flower images [4]. In addition, a flower has to be segmented from its background. All these problems lead to find an effective solution for classification and identification of flower images
Applications of classification of flowers can be found useful in floriculture, flower searching for patent analysis, etc. The floriculture industry comprises flower trade, nursery and potted plants, seed and bulb production, micro propagation, and extraction of essential oil from flowers. In such cases, automation of flower classification is essential. Since these activities are done manually and are very labor intensive, automation of the classification of flower images is a necessary task.
II. PROPOSED MODEL
https://dx.doi.org/10.24001/ijaems.3.5.17 ISSN: 2454-1311
2.1 Image Pre-Processing
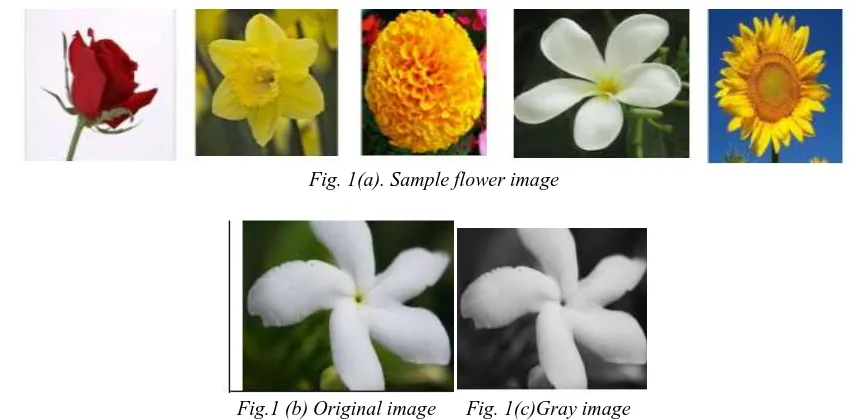
The work starts by performing some pre-processing operations on the images, such as image resizing and gray scaling. Performing image processing on high resolution images makes the algorithm slower because of the large image size. Also, to avoid underutilization of high resolution images resizing is done. All the images are scaled to 512 × 512 size. This is done in order to increase efficiency. Because, texture and color features extracted
from the image depend on probability distribution, image size should not change the result of comparison. It is also important at the same time to make sure that image is not resized to an extent such that important features in the image are missed out making it not suitable for segmentation. The flower image is first converted to gray scale image and after that a median filter is applied to remove any noise.
Fig. 1(a). Sample flower image
Fig.1 (b) Original image Fig. 1(c)Gray image
2.2 SEGMENTATION
Segmentation is often considered to be the first step in image analysis. The purpose is to subdivide an image into meaningful non-overlapping regions, which would be used for further analysis. It is hoped that the regions obtained correspond to the physical parts or objects of a scene (3-D) represented by the image (2-D). In general, autonomous segmentation is one of the most difficult tasks in digital image processing.
2.2.1 Balanced Histogram Threshold
In image processing, the balanced histogram thresholding method (BHT [5] )is a very simple method used for automatic image thresholding. Like Otsu's Method [6] and the Iterative Selection Thresholding Method[7] this is
a histogram based thresholding method. This approach assumes that the image is divided in two main classes[8]: The background and the foreground. The BHT method tries to find the optimum threshold level that divides the histogram in two classes.
Thresholded image.
This method weighs the histogram, checks which of the two sides is heavier, and removes weight from the heavier side until it becomes the lighter. It repeats the same operation until the edges of the weighing scale meet.
Given its simplicity, this method is a good choice as a first approach when presenting the subject of automatic image thresholding.
https://dx.doi.org/10.24001/ijaems.3.5.17 ISSN: 2454-1311
An automated procedure for bimodal histograms 1. Select an initial estimate of T
2. Compute the means of the two regions determined by T 3. Set the new T as the average of the two means
4. Repeat steps 2,3 until the difference in T in successive iterations is smaller than a predefined
Parameter
Fig 2. (a) Segmented image
III. FEATURE EXTRACTIONS
Features are extracted from segmented image. The quality of the segmented image determines the quality of features extracted. In this work texture (GLCM) features are extracted so that they give better information about the image.
Features, characteristics of the objects of interest, if selected carefully are representative of the maximum relevant information that the image has to offer for a complete characterization a lesion [9, 10]. Feature extraction methodologies analyse objects and images to extract the most prominent features that are representative of the various classes of objects. Features are used as inputs to classifiers that assign them to the class that they represent. In this Work intensity histogram features and Gray Level Co-Occurrence Matrix (GLCM) features are extracted. 3.1 Intensity Histogram Features
Intensity Histogram analysis has been extensively researched in the initial stages of development of this algorithm [11]. Prior studies have yielded the intensity histogram features like mean, variance, entropy etc. These are summarized in Table 1.
Table.1: Intensity histogram features Feature Number
assigned
Feature
1. Mean
2. Variance
3. Skewness
4. Kurtosis
5. Entropy
6. Energy
3.2 GLCM Features
It is a statistical method that considers the spatial relationship of pixels is the gray-level co-occurrence matrix (GLCM), also known as the gray-level spatial dependence matrix [12, 13, 14, 15]. By default, the spatial relationship is defined as the pixel of interest and the pixel to its immediate right (horizontally adjacent), but you can specify other spatial relationships between the two pixels. Each element (I, J) in the resultant GLCM is simply the sum of the number of times that the pixel with value I occurred in the specified spatial relationship to a pixel with value J in the input image.
The Following GLCM features were extracted in our research work:
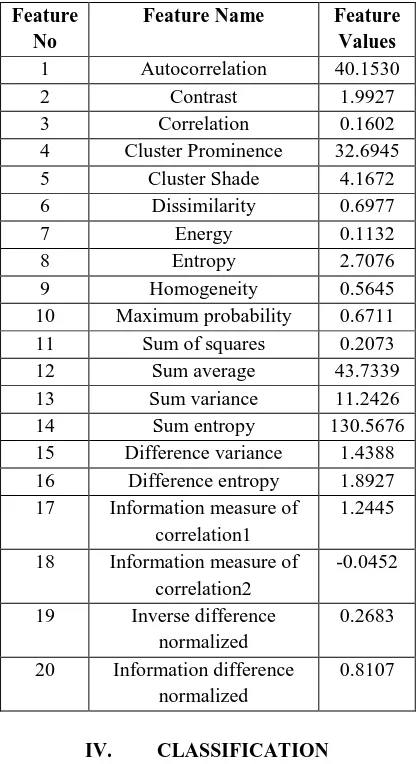
Autocorrelation, Contrast, Correlation, Cluster Prominence, Cluster Shade, Dissimilarity Energy, Entropy, Homogeneity, Maximum probability, Sum of squares, Sum average, Sum variance, Sum entropy, Difference variance, Difference entropy, information measure of correlation1, information measure of correlation2, Inverse difference normalized. Information difference normalized. The value obtained for the above features from our work for a typical image is given in the following Table 2.
Table.2: GLCM Features and values Extracted from sample flower Image
Feature No
Feature Name Feature Values 1 Autocorrelation 40.1530
2 Contrast 1.9927
3 Correlation 0.1602
4 Cluster Prominence 32.6945
5 Cluster Shade 4.1672
6 Dissimilarity 0.6977
7 Energy 0.1132
8 Entropy 2.7076
9 Homogeneity 0.5645
10 Maximum probability 0.6711
11 Sum of squares 0.2073
12 Sum average 43.7339
13 Sum variance 11.2426
14 Sum entropy 130.5676
15 Difference variance 1.4388 16 Difference entropy 1.8927 17 Information measure of
correlation1
1.2445
18 Information measure of correlation2
-0.0452
19 Inverse difference normalized
0.2683
20 Information difference normalized
0.8107
IV. CLASSIFICATION
Association rule mining: Association rule mining is one of the important tasks of data mining intended towards decision support. Basically it is the process of finding some relations among the attributes of a huge database. Such relationships will help in taking some decisions. The process of extracting these relationships is termed as association rule mining. A number of algorithms have been developed for searching these rules [16, 17]. In this work, we have used the measures like information gain and interestingness [18, 19], used for constructing and evaluating a rule.
https://dx.doi.org/10.24001/ijaems.3.5.17 ISSN: 2454-1311
column represents the class attribute and tuples are used to represent images. A novel genetic algorithmic approach named Multidimensional Genetic Association Rule Miner (MGARM) is proposed for constructing rules for classification of flowers. Here, the multi-dimensional means, for each class in the database, a separate thread of GA is applied to construct the rule. Finally the best rule in each thread is combined to form the rule set. A total of 250 images were used in the training set and 70 images were used in the test set. Few of the images used in training and test set are shown below.
The detail of the proposed algorithm is explained in the following sequence.
The genes are the basic elements of GA. Here the attributes are considered as genes. The sequence of genes is known as chromosome, represents one rule. A collection of 20 chromosomes generated for each population. The flowers are going to be classified into five types. So, in this work, the GA has 5 dimensions, means 5 set of populations. The chromosomes are encoded with numbers, every 2 digits are reserved for one attribute and the final attribute is mean for the class attribute. In this way the rule can be easily decoded. Each attribute can have set of possible values. The encoding represents one of the possible values with its index. If that gene 00 means that the corresponding attribute is not included in the rule. Consider the following chromosome:
00 11 05 00 01
Which represents a rule, in that, the first and fourth attributes are not considered, the second and third attributes are included with their 11th and 5th index values. For rule construction, the items are selected at random, and the information gain is calculated for the attribute, if it is greater than the threshold (0.5) then the item will be added to the rule, ignored otherwise. For each rule the interestingness measure is calculated as fitness value. And the rule having highest interestingness is stored as global best rule for each population. Then the genetic operators are applied to generate a new set of population as given: Reproduction (selection)
The selection process selects chromosomes from the mating pool directed by the survival of the fittest concept of natural genetic systems. In the proportional selection strategy adopted in this article, a chromosome is assigned a number of copies, which is proportional to its fitness in the population that goes into the mating pool for further genetic operations. Roulette wheel selection is one common technique implements the selection strategy.
Crossover
Crossover is a probabilistic process that exchanges information between two parent chromosomes for generating two child chromosomes. In this paper, single point crossover with a fixed crossover probability of pc=0.6 is used. For chromosomes of length l, a random integer,
called the crossover point, is generated in the range [1, l-1]. The portions of the chromosomes lying to the right of the crossover point are exchanged to produce two offspring. Mutation
Each chromosome undergoes mutation with a fixed probability pm=0.03. For binary representation of chromosomes, a bit position is mutated by simply flipping its value. Since we are considering real numbers, a random position is chosen in the chromosome and replace by a random number between 0-9.
From the new set of populations, the best rules are extracted known as locally best. The global and local best rules are compared. If local rules are better than the next iteration is continued with the new populations and the local rules are saved as global best. Otherwise, the next iteration is performed with the old populations. The global best rules are pruned to check whether the quality is improving or not. In rule pruning, the attributes are temporarily removed one by one at random, if the interestingness measure improves than the attributes are removed permanently. The following algorithm describes our proposed method.
MGARM Algorithm
1. Load the training samples of GLCM features.
2. Construct 20 chromosomes (rules) based on information gain for M populations, one population for each dimension (class).
3. Calculate the interestingness of each chromosome; assign them as fitness value.
4. For each population, Store the chromosomes having better interestingness as global best rule.
5. Apply the Genetic operators such as reproduction, crossover and mutation to construct the new population. 6. For the new populations at each dimension, calculate the interestingness of each chromosome.
7. Choose the locally best rule.
8. Compare the global and local best rules.
9. If local rules are better than the global continue the next iteration with the new population and hold the local best rule as global best. Otherwise, continue with the old population.
And perform rule pruning.
Repeat from Step 5 for n number of iterations.
Decode the global best chromosomes to form the association rules for each class.
https://dx.doi.org/10.24001/ijaems.3.5.17 ISSN: 2454-1311
Fig.4 (a): Images used for Classifications in the training set.
Fig.4 (b): Corresponding Segmented image after noise removal
(i) (ii) (iii) (iv) (v) (vi)
Fig.4 ©: Images used in the test set for identification before and after segmentation and noise removal .Figure 4 © (i), (ii), (iii) shows the few of the images used in the test set for identification, Figure 4 © (iv),(v),(vi) shows the corresponding segmented
images in the test after noise removal.
V. EXPERIMENTAL RESULTS
The digital flower image used in our experiments was taken from flower images downloaded from World Wide Web and also captured from webcam and used for testing. The database consists of 250 images. A total of 180images were used in the training set and 70 images were used in the test set. They belong to five categories. The proposed method is evaluated based on ten-fold cross validation method. The following table presents the rule accuracy of the proposed classification system compared with other association rule based system proposed in [19, 20]. The results for the ten splits of the flower image database are given in Table 4.
Table.4: Classification accuracy for the ten splits with MGARM
Splits Classification Accuracy
1 98.65
2 95.89
3 97.76
4 93.12
5 92.23
6 98.66
7 94.41
8 98.54
9 98.05
10 95.89
Avg. 96.32
In this paper we used multi dimensional genetic association rule mining using image contents for the classification of
flowers. The average accuracy is 96.32 %. We have employed the freely available Machine Learning package, WEKA [21].
VI. CONCLUSION
Image processing technique plays an important role in the classification. A flower classification and recognition system based on genetic association rule mining algorithm has been presented. Only gray level features have been used. The algorithm is tested on real flower images downloaded from World Wide Web. Images were also captured from webcam and used for testing. The algorithm has proven to be very effective in multidimensional data mining. The experimental results show that genetic association rule mining gives better classification accuracy. Using image size of 512 × 512 may pose memory constraints for a large database. Hence image size can be reduced to 256 × 256 or 128 × 128 which increases the speed of execution along with saving memory. The size of features can be further reduced which might increase the speed of computation and also accuracy.
REFERRENCES
[1] Sari, Yuita Arum, and Nanik Suciati. "Flower Classification using Combined a* b* Color and Fractal-based Texture Feature." International Journal of Hybrid Information Technology 7.2 (2014): 357-368.
https://dx.doi.org/10.24001/ijaems.3.5.17 ISSN: 2454-1311
[3] Mukane, S. M., and Ms JA Kendule. "Flower Classification Using Neural Network Based Image Processing."
[4] [Tanakorn Tiay, Pipimphorn Benyaphaichit, and Panomkhawn Riyamongkol “Flower Recognition System Based on ImageProcessing” 2014 Third ICT International Student Project Conference (ICT-ISPC2014).
[5] Rodrigo Nava, Boris Escalante-Ramírez, Gabriel
Cristóbal “Texture Image Retrieval based on Log
-Gabor Features.” CIARP, 2012, pp.414-421.
[6] A. Anjos and H. Shahbazkia. Bi-Level Image Thresholding - A Fast Method. BIOSIGNALS 2008. Vol:2. P:70-76.
[7] Nobuyuki Otsu (1979). "A threshold selection method from gray-level histograms". IEEE Trans. Sys., Man., Cyber. 9: 62–66.
[8] Ridler TW, Calvard S. (1978) Picture thresholding using an iterative selection method, IEEE Trans. System, Man and Cybernetics, SMC-8: 630-632. [9] A. Anjos, R. Leite, M. L. Cancela, H. Shahbazkia.
MAQ – A Bioinformatics Tool for Automatic Macroarray Analysis. International Journal of Computer Applications. 2010. Number 7 - Article 1. [10] D.Brazokovic and M.Nescovic, “Mammogram
screening using multisolution based image segmentation”, International journal of pattern recognition and Artificial Intelligence, 7(6): pp.1437-1460, 1993
[11] Dougherty J, Kohavi R, Sahami M. “Supervised and unsupervised discretization of continuous features”. In: Proceedings of the 12th international conference on machine learning.San Francisco:Morgan Kaufmann; pp 194–202, 1995.
[12] Yvan Saeys, Thomas Abeel, Yves Van de Peer “Towards robust feature selection techniques”, www.bioinformatics.psb.ugent
[13] Gianluca Bontempi, Benjamin Haibe-Kains “Feature selection methods for mining bioinformatics data”, http://www.ulb.ac.be/di/mlg
[14] Li Liu, Jian Wang and Kai He “Breast density classification using histogram moments of multiple resolution mammograms” Biomedical Engineering and Informatics (BMEI), 3rd International Conference, IEEE explore pp.146–149, DOI: November 2010, 10.1109/ BMEI.2010 .5639662,
[15] Li Ke,Nannan Mu,Yan Kang Mass computer-aided diagnosis method in mammogram based on texture features, Biomedical Engineering and Informatics (BMEI), 3rd International Conference, IEEE Explore, pp.146 – 149, November 2010, DOI: 10.1109/ BMEI.2010.5639662,
[16] Azlindawaty Mohd Khuzi, R. Besar and W. M. D. Wan Zaki “Texture Features Selection for Masses Detection In Digital Mammogram” 4th Kuala Lumpur International Conference on Biomedical Engineering 2008 IFMBE Proceedings, 2008, Volume 21, Part 3, Part 8, 629-632, DOI: 10.1007/978-3-540-69139-6_157
[17] J Hipp, U Güntzer, and G Nakhaeizadeh, “Algorithms for association rule mining––a general survey and
comparison”, vol. 2, no. 1, 2000.
[18] Jiawei Han and Micheline Kamber, “Data Mining, Concepts and Techniques”. Morgan Kaufmann, 2001. [19] ML Antonie, OR. Zaiane, and A Coman, “Application
of data mining techniques for medical image classification”. In Proc. Of Second Intl. Workshop on Multimedia Data Mining (MDM/KDD’2001) in conjunction with Seventh ACM SIGKDD, pp 94–101, San Francisco, USA, 2001.
[20] Deepa S. Deshpande “association rule mining based on image content” International Journal of Information Technology and Knowledge Management January-June 2011, Volume 4, No. 1, pp. 143-146