Influence of the rhizosphere soils on essential elements
of Ephedra sinica herbaceous stems
Zhe CAO1,Yujie YIN1, Fuying MAO1,2,3, Yanqun Peng1, Xinhui ZHANG1,2, Junyu LIANG4, Hongling TIAN5, Yunsheng ZHAO1,2,3*
1Pharmacy College, Ningxia Medical University, Yinchuan, Ningxia, China, 2Ningxia Research Center of Modern Hui Medicine Engineering and Technology, Yinchuan, Ningxia, China, 3Key Laboratory of Hui Ethnic Medicine Modernization, Ministry of Education, Yinchuan, Ningxia, China 4College of Life Sciences of Northwest Normal University, Lanzhou, Ganshu, China, 5Institute of Industrial Crop Research, Shanxi Academy of Agricultural Sciences, Fenyang, Shanxi, China
INTRODUCTION
Ephedra herb (also known as Ma Huang), is one of the well-known traditional Chinese medicines, and it has been widely used in crude form for over 3000 years. This herb is used as a diaphoretic, antiasthmatic, or diuretic to relieve colds, bronchial asthma, and edema (Abourashed et al., 2003). Ma Huang contributes to weight loss in obesity and enhances performance in endurance training, and is used as dietary supplement and weight loss product in the Western world (Khasbagan and Soyolt, 2007; Xin et al., 2015). Chinese Pharmacopoeia defines Ephedra sinica Stapf, Ephedra intermedia Schrenk C.A Mey., or Ephedra equisetina Bge as the official source of Ma Huang and indicates that the sum contents of ephedrine and pseudoephedrine measure not less than 0.8% (Pharmacopoeia., 2015). E. sinica, as the the primary medicinal species, is widely distributed in China, except in the lower reaches of Yangtze River and Pearl River Basin, and is especially common in northwest Chinese
territories, such as Ningxia, Inner Mongolia, Xinjiang, and Gansu regions (Shen, 1995). E. sinica is an important component of desert grassland ecological systems, and its market demand is strong. Wild E. sinica resources have been severely reduced by excessive harvesting, and the Chinese government has enacted related legislations to strictly control the collection of wild E. sinica (Hong et al., 2011).
Plants require various elements, which are generally referred to as mineral elements, for their survival. Deficiency in these elements affects both plant quality and quantity. Carbon (C), hydrogen (H), oxygen (O), nitrogen (N), phosphorous (P), sulfur (S), boron (B), chlorine (Cl), potassium (K), calcium (Ca), magnesium (Mg), manganese (Mn), copper (Cu), iron (Fe), zinc (Zn), molybdenum (Mo), and nickel (Ni) are plant essential elements and have a hand in many plant metabolic processes (Ohkama-Ohtsu and Wasaki, 2010). Many important functions of plant physiology are performed by these elements (Wang, 2012).
http://www.ejfa.me/
R E G U L A R A R T I C L E
Mineral elements serve as important components of medicinal herbs not only owing to their healing properties but also their nutritional supplement functions. In this study, 15 essential element contents of wild Ephedra sinica and its rhizosphere soil were measured by
inductively coupled plasma mass spectroscopy. Influences of rhizosphere soil on these elements in plants were evaluated. Results showed
that N, K, Cl, Sr, Na, Mn, B, Cu, and Mo contents in plants were all directly affected by one or more factors, including pH value, sand, silt, and organic matter contents. Herbaceous stems of E. sinica contained high contents of N, K, S, and Ca and could accumulate N, S, P,
Cl, Sr, and Mg from soil with mean enrichment coefficients of 42.88, 34.37, 7.81, 4.38, 2.16, and 1.56, respectively. N, K, Ca, Sr, Mn,
Zn, and Cu contents in the herbs were positively correlated with those in soil. Additionally, element prediction models were established to infer essential element contents of the herbaceous stems of E. sinica. This study provides scientific basis for mineral element regulation
of E. sinica by adjusting soil fertility levels.
Keywords:Ephedra sinica; Essential elements; Herbaceous stems; Rhizosphere soil
A B S T R A C T
*Corresponding author:
Yunsheng ZHAO, Ningxia Research Center of Modern Hui Medicine Engineering and Technology, Ningxia Medical University, Pharmacy College, No.692 Shengli South Street, Yinchuan 750004, Ningxia, China. Tel: +86-13619501878, Fax: +86-09516980193. E-mail: [email protected], [email protected].
Mineral elements may not only influence the production of active ingredients by involving plant secondary metabolism (Nasim and Dhir, 2010; Singh and Garg, 1997; Suchacz and Wesolowski, 2013). but also play important parts as the curative materials (Han et al., 2006; Tuo et al., 2010). Soil provides the main mineral elements for plants. Some studies have measured the correlations between mineral elements in soils and the herbs grown on them. Chen et al. (2009) observed that the growth of Paeonia lactiflora improved at the moderate levels of Fe, Mn, Cu, and Zn in soil, and the paeoniflorin content increased at the same mineral levels, but the opposite effect appeared at the higher levels of such elements.
Mineral elements are important for medicinal plant growth, they exert a direct influence on yields and organic compounds of herbs and also act as important curative materials. However, few studies had been conducted on essential element levels in E. sinica and its rhizosphere soil. Influences of soil elements and element composition on those of E. sinica remain unclear. Therefore, the present study (1) investigated the essential element characteristics of E. sinica and soil samples; (2) explored the relationship between soil and herb elements; and (3) revealed major controlling factors and established prediction models for essential element transfer from soil to E. sinica.
MATERIALS AND METHODS
Materials
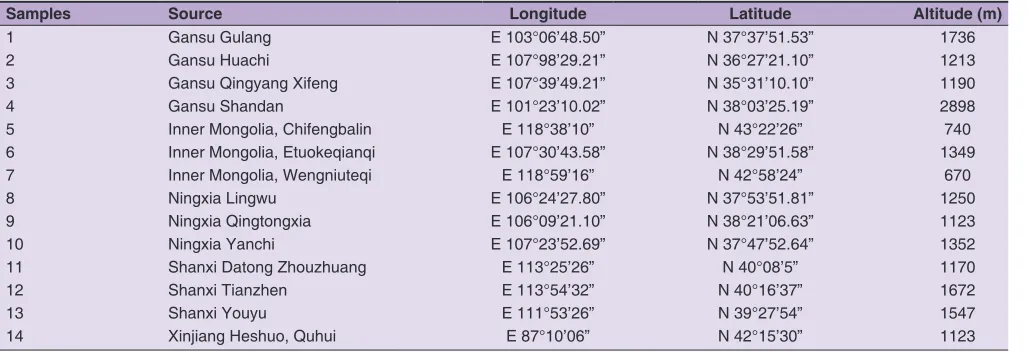
Stems of wild E. sinica and their rhizosphere soils were collected in September and October 2012 from Ningxia, Inner Mongolia, Xinjiang, and Shanxi (Table 1). Plants were identified as authentic stems of E. sinica by associate Professor Minsheng Yan (Northwest Normal University, China).
Inductively coupled plasma mass spectroscopy (ICP-MS) multi-element standard stock solutions were provided by Beijing General Research Institute for Nonferrous Metals in China. Standard stock solution I (100 mg/ L B, Cu, Fe, Mg, Mn, Sr, and Zn; GSB04-1767-2004) was diluted with nitric acid and hydrochloric acid solutions. Standard stock solution II (100 mg/L P, K, S; 20 mg/L Mo; GSB04-1764-2004) and solution III (1000 mg/ L Ca, 200 mg/L Na; GSB04-2822-2011) were diluted with nitric acid solution. Standard stock solution V (1000 mg/L N; GSB 04-2837-2011(b)) and solution VI (1000 mg/L Cl; GSB 04-1770-2004) were diluted with deionized water solution. The internal standard solution (100 mg/L 209Bi, 72Ge, 65Zn, 175Lu, 103Rh, 45Sc, 159Tb, 89Y; GSB04-2828-2011) was
diluted with nitric acid solution. Nitric acid (ρ1.42 g/mL), hydrofluoric acid (ρ1.15 g/mL), and hydrogen peroxide
(ρ1.1 g/mL) were guaranteed reagents. The deionized water was prepared by Milli-Q Integral ultrapure water equipment (18.2 MΩ.cm, Millipore Co., Ltd. USA). All glass and plastic wares were cleaned with nitric acid and rinsed with deionized water before use.
Sample preparation
All plant samples were gently washed with deionized water, dried at 105°C, and ground into fine powders (100 mesh). Afterward, fine powders of each plant sample were homogenized in a metal-free mortar and stored in paper bags at room temperature before analysis. Soil samples were treated identically to plant samples, except for washing, and stored in polyethylene bags before use.
For microwave-assisted digestion of plant samples (in triplicate) a Mars-6 Microwave System (CEM Co., Ltd, USA) was used to implement the following procedure: 1.0000 g of homogenized sample was weighed into a Teflon reaction vessel. The samples were digested with 5.0 mL HNO3 + 3.0 mL H2O2 in a three-step program (1–120°C/20 min, 2 –160 °C/20 min, and 3 –180°C/45 min). Microwave-assisted digestion of soil samples (in triplicate) followed the procedure: 0.5000 g of homogenized sample was weighed into a Teflon reaction vessel. The samples were digested with 5.0 mL HNO3 +1.0 mL HF + 2.0 mL H2O2 in a three-step program (1 –150°C/25 min, 2 –170°C/30 min, and 3 –200 °C/80 min). After digestion, each plant or soil solution was evaporated to 0.5–1.0 mL on an electric hot plate at 140°C–160 °C. After cooling (25 min), the digests were diluted and transferred into a volumetric flask with 1 mL internal standard solution and up to 10 mL with deionized water.
ICP-MS measurements
Contents of essential elements in plants and soils digestion solutions were determined by ICP-MS (NexION 300D, PerkinElmer Instrument Co., USA). Instrument parameters were optimized as follows: radio frequency power of 1600 W, plasma gas flow rate of 18.0 L/min, carrier gas flow rate of 1 L/min, sweeps/reading of 20, scan mode of peak hopping, dwell time of 50 ms, integral time of 1 s, sampling depth of 8 mm, and replicates of 5.
Soil characterization
chemistry in soil (MOC, 2004; MOA, 1988; MOA, 2006a; MOA, 2006b; MOA, 2007).
Prediction models establishment for element transfer
To predict essential element transfer from soil to E. sinica, a regression function was used:
Log [Cplant] = a + b log [Csoil]
where Cplant was one specific element content in E. sinica
stems, Csoil referred to the total content of soil elements
which are significantly associated with this element in E. sinica (P < 0.05), and a and b were regression coefficient. This regression function also applied to soil characterizations, such as sand, silt, OM content, and pH value (Cheng et al., 2015).
Statistical analysis
Data were analyzed by SPSS 21.0 software (International Business Machines Corporation, USA), and all values were expressed as mean values. P values less than 0.05 and 0.01 were considered statistically significant and statistically highly significant, respectively.
RESULTS AND DISCUSSION
Method validation for elemental analysis
Measurements were accomplished by external calibration using aqueous mixed standard substances. Slopes of calibration curves of all analytes exhibited good sensitivity, with their correlation coefficients all reaching beyond 0.9995. Precision, which was expressed as relative standard deviation (RSD), ranged from 0.02% to 1.1%. Within-day repeatability was <3.4%. Tables 3 and 4 summarize the limits of detection (LOD) determined in digestion solutions of soils and plants samples for ICP-MS. The recoveries determined with plant or soil sample 1 ranged from 94% to 115% for ICP-MS.
Soil characteristics
Soil SMC (sand, silt, and clay), pH value, OM, and CEC were measured, and the detailed results per soil were listed in Table 2. pH values varied in a narrow range (7.36 to 8.50, i.e., neutral to moderately alkaline). pH value influenced soil protons, which were usually present in H2O solutions ligated to ionic exchange structures of soil components. Soil CEC ranged from 8.85 mmol/kg to 54.99 mmol/kg. CEC provided information on potential of soils to bind or to release cations (as nutrients or pollutants). Average OM content of all soil samples reached 7.39 g/kg and ranged from 0.78 g/kg to 22.11 g/kg with generally high coefficients of variation. Soil SMC (sand 2–0.05 mm, silt 0.05–0.002 mm, clay <0.002 mm) exhibited significant variability in SMC distribution (37.0–211.0 g/kg clay, 2.0–66.8 g/kg silt, 760.2–961 g/kg sand).
All these variables were important parameters influencing elemental contents in plant samples. In this study, parameters of rhizosphere soils differed according to the collected locations. These influencing factors created a chemical environment conducive for plant growth.
Element contents of soil samples
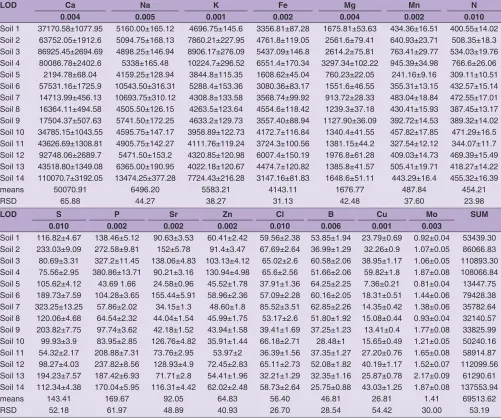
Table 3 showed the element contents with LOD in 14 rhizosphere soil samples. The order of average contents was Ca > Na > K > Fe > Mg > Mn > N > P > S > Sr > Zn > Cl > B > Cu > Mo. Contents of total elements varied considerably from 13447.75 mg/kg to 137553.94 mg/kg, with an average of 69513.62 mg/kg. The highest contents were observed for Ca with an average of 50070.91 mg/kg and accounted for 72.03% of total elements. RSD of element contents approximated 42%, which is within the acceptable range for inhomogeneous soil specimens. For each sampling site (soil samples 1–14), RSD values ranged from 2.2% to 4.9%. High variations were observed for Ca and P, and these elements were strongly related to local bedrock composition. RSD measuring less than 10%
Table 1: Samples of E. sinica or their rhizosphere soils in the present work
Samples Source Longitude Latitude Altitude (m)
1 Gansu Gulang E 103°06’48.50” N 37°37’51.53” 1736
2 Gansu Huachi E 107°98’29.21” N 36°27’21.10” 1213
3 Gansu Qingyang Xifeng E 107°39’49.21” N 35°31’10.10” 1190
4 Gansu Shandan E 101°23’10.02” N 38°03’25.19” 2898
5 Inner Mongolia, Chifengbalin E 118°38’10” N 43°22’26” 740
6 Inner Mongolia, Etuokeqianqi E 107°30’43.58” N 38°29’51.58” 1349
7 Inner Mongolia, Wengniuteqi E 118°59’16” N 42°58’24” 670
8 Ningxia Lingwu E 106°24’27.80” N 37°53’51.81” 1250
9 Ningxia Qingtongxia E 106°09’21.10” N 38°21’06.63” 1123
10 Ningxia Yanchi E 107°23’52.69” N 37°47’52.64” 1352
11 Shanxi Datong Zhouzhuang E 113°25’26” N 40°08’5” 1170
12 Shanxi Tianzhen E 113°54’32” N 40°16’37” 1672
13 Shanxi Youyu E 111°53’26” N 39°27’54” 1547
Table 2: The characteristics data of the investigated soils (n=3)
Samples Sand (g/kg) Silt (g/kg) Clay (g/kg) PH OM CEC
2‑0.05 mm 0.05‑0.002mm <0.002 mm (g/kg) (mmol/kg)
Soil 1 865.4±25.96 18.8±0.62 115.8±3.47 8.06±0.28 3.67±0.12 34.38±1.24
Soil 2 760.2±24.33 28.8±0.92 211±6.54 7.88±0.27 9.21±0.31 19.29±0.73
Soil 3 798.2±22.34 66.8±2.07 135±4.32 7.78±0.28 16.2±0.57 10.24±0.37
Soil 4 852.2±22.16 46.8±1.5 101±3.23 7.84±0.27 22.1±0.71 14.79±0.55
Soil 5 952.2±22.85 8.8±0.31 39±1.29 7.97±0.28 7.49±0.25 15.34±0.55
Soil 6 924.6±26.81 22.8±0.75 52.6±1.74 8.5±0.29 5.29±0.17 27.62±1.02
Soil 7 877.4±28.08 10±0.35 112.6±3.49 7.76±0.26 7.7±0.25 21.68±0.76
Soil 8 961±28.83 2±0.07 37±1.18 8.2±0.28 0.78±0.03 12.91±0.46
Soil 9 943.4±27.36 11.2±0.37 45.4±1.45 8.09±0.27 1.74±0.06 16.39±0.61
Soil 10 903.8±27.11 10.40±0.35 85.8±2.66 8.5±0.3 1.57±0.05 8.85±0.33
Soil 11 886.6±27.48 31.6±1.01 81.8±2.62 8.18±0.28 6.61±0.21 16.18±0.6
Soil 12 899±27.87 18.4±0.59 82.6±2.64 7.48±0.25 11.2±0.37 22.37±0.85
Soil 13 915±27.45 20±0.68 65±2.14 8.1±0.27 5.39±0.17 30.92±1.12
Soil 14 932.6±27.98 11.2±0.38 56.2±1.8 7.36±0.25 4.45±0.15 54.99±1.98
Means 890.83 21.97 87.20 7.98 7.39 21.85
Table 3: Elemental contents in soil samples (Content in mg/kg, n=3).
LOD Ca Na K Fe Mg Mn N
0.004 0.005 0.001 0.002 0.004 0.002 0.010
Soil 1 37170.58±1077.95 5160.00±165.12 4696.75±145.6 3356.81±87.28 1675.81±53.63 434.36±16.51 400.55±14.02 Soil 2 63752.05±1912.6 5094.75±168.13 7860.21±227.95 4761.8±119.05 2561.6±79.41 640.93±23.71 508.35±18.3 Soil 3 86925.45±2694.69 4898.25±146.94 8906.17±276.09 5437.09±146.8 2614.2±75.81 763.41±29.77 534.03±19.76 Soil 4 80086.78±2402.6 5338±165.48 10224.7±296.52 6551.4±170.34 3297.34±102.22 945.39±34.98 766.6±26.06 Soil 5 2194.78±68.04 4159.25±128.94 3844.8±115.35 1608.62±45.04 760.23±22.05 241.16±9.16 309.11±10.51 Soil 6 57531.16±1725.9 10543.50±316.31 5288.4±153.36 3080.36±83.17 1551.6±46.55 355.31±13.15 432.57±15.14 Soil 7 14713.99±456.13 10693.75±310.12 4308.8±133.58 3568.74±99.92 913.72±28.33 483.04±18.84 472.55±17.01 Soil 8 16364.11±494.58 4505.50±126.15 4263.5±123.64 4554.6±118.42 1239.3±37.18 430.41±15.93 387.45±13.17 Soil 9 17504.37±507.63 5741.50±172.25 4633.2±129.73 3557.40±88.94 1127.90±36.09 392.72±14.53 389.32±14.02 Soil 10 34785.15±1043.55 4595.75±147.17 3958.89±122.73 4172.7±116.84 1340.4±41.55 457.82±17.85 471.29±16.5 Soil 11 43626.69±1308.81 4905.75±142.27 4111.76±119.24 3724.3±100.56 1381.15±44.2 327.54±12.12 344.07±11.7 Soil 12 92748.06±2689.7 5471.50±153.2 4320.85±120.98 6007.4±150.19 1976.8±61.28 409.03±14.73 469.39±15.49 Soil 13 43518.80±1349.08 6365.00±190.95 4022.18±120.67 4474.7±120.82 1385.8±41.57 505.41±19.71 418.27±14.22 Soil 14 110070.7±3192.05 13474.25±377.28 7724.43±216.28 3147.16±81.83 1648.6±51.11 443.29±16.4 455.32±16.39
means 50070.91 6496.20 5583.21 4143.11 1676.77 487.84 454.21
RSD 65.88 44.27 38.27 31.13 42.48 37.60 23.98
LOD S P Sr Zn Cl B Cu Mo SUM
0.010 0.002 0.002 0.002 0.010 0.006 0.001 0.003
Soil 1 116.82±4.67 138.46±5.12 90.63±3.53 60.41±2.42 59.56±2.38 53.85±1.94 23.79±0.69 0.92±0.04 53439.30 Soil 2 233.03±9.09 272.58±9.81 152±5.78 91.4±3.47 67.69±2.64 36.99±1.29 32.26±0.9 1.07±0.05 86066.83 Soil 3 80.69±3.31 327.2±11.45 138.06±4.83 103.13±4.12 65.02±2.6 60.58±2.06 38.95±1.17 1.06±0.05 110893.30 Soil 4 75.56±2.95 380.86±13.71 90.21±3.16 130.94±4.98 65.6±2.56 51.66±2.06 59.82±1.8 1.87±0.08 108066.84 Soil 5 105.62±4.12 43.69 1.66 24.58±0.96 45.52±1.78 37.91±1.36 64.25±2.25 7.36±0.21 0.81±0.04 13447.75 Soil 6 189.73±7.59 104.28±3.65 155.44±5.91 58.96±2.36 57.09±2.28 60.16±2.05 18.31±0.51 1.44±0.06 79428.38 Soil 7 323.25±13.25 57.86±2.02 34.15±1.3 48.60±1.8 85.52±3.51 62.85±2.26 14.35±0.42 1.38±0.06 35782.64 Soil 8 120.06±4.68 64.54±2.32 44.04±1.54 45.99±1.75 53.17±2.6 51.80±1.92 15.08±0.44 0.93±0.04 32140.57 Soil 9 203.82±7.75 97.74±3.62 42.18±1.52 43.94±1.58 39.41±1.69 37.25±1.23 13.41±0.4 1.77±0.08 33825.99 Soil 10 99.93±3.9 83.95±2.85 126.76±4.82 35.91±1.44 66.18±2.71 28.48±1 15.65±0.49 1.21±0.05 50240.16 Soil 11 54.32±2.17 208.88±7.31 73.76±2.95 53.97±2 36.39±1.56 37.35±1.27 27.20±0.76 1.65±0.08 58914.87 Soil 12 98.27±4.03 237.82±8.56 128.93±4.9 72.45±2.83 65.11±2.73 52.08±1.82 40.19±1.17 1.52±0.07 112099.56 Soil 13 194.23±7.57 187.42±6.93 71.71±2.8 54.41±1.96 32.21±1.29 32.35±1.16 25.87±0.78 2.17±0.09 61290.61 Soil 14 112.34±4.38 170.04±5.95 116.31±4.42 62.02±2.48 58.73±2.64 25.75±0.88 43.03±1.25 1.87±0.08 137553.94
means 143.41 169.67 92.05 64.83 56.40 46.81 26.81 1.41 69513.62
implied low variability, whereas RSD of more than 90% indicated extensive variability as reported by Zhang et al. (2007). A moderate variability was detected in most element contents of soil samples.
In general, Cu, Fe, Mn, Sr, and Zn are categorized as plant micro elements (<0.01% of plant dry weight) and play important roles in soil fertility. Normal contents of these elements in soil were of significant interest as background values, and they were needed for assessment of the degree of soil contamination to some extent. Cu content was below the limit for agricultural soil in China (100 mg/kg), France and Canada. Zn content was considerably below the maximum regulated soil contents in China and France (AFNOR, 1996; CEPA, 2006; CCME, 2012). Fe, Mn, and Sr contents were below the reference values for agricultural soil according to Kabata-Pendias and Mukhrjee (2007). The study areas were not contaminated by the investigated metal elements (i.e., Cu, Fe, Mn, Sr, and Zn).
Element contents of plant samples
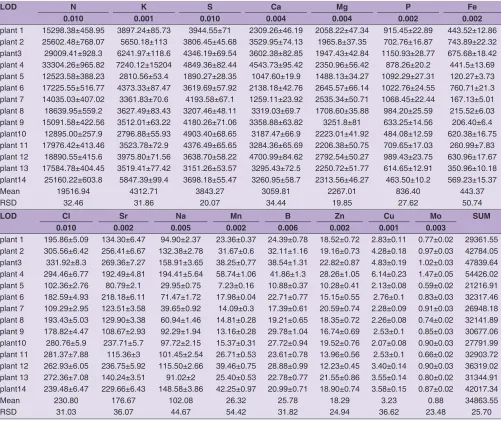
Table 4 listed the elemental contents in plant samples along with LOD. The order of average element contents was N > K > S > Ca > Mg > P > Fe > Cl > Sr > Na > Mn > B > Zn > Cu > Mo. Contents of total elements varied from 21,216.91 mg/kg to 54,426.02 mg/kg, with an average of 34,863.55 mg/kg. The highest contents were observed for N, the values varied from 12,523.58 mg/kg to 33,304.26 mg/kg, and accounted for 55.98% of total element contents. Macro elements (N, P, K, Ca, Mg, and S) accounted for 97.05% of the total elements, whereas micro elements (Fe, B, Mn, Zn, Cu, Mo, Cl, Na, and Sr) were relatively rare. P is an important macro element in plant. However, P content (mean 836.40 mg/kg) was lower than those of other macro elements (mean ≥2267.01 mg/kg). Fe content was the highest among micro elements and ranged from 120.27 mg/kg to 760.71 mg/kg, with an average of 443.37 mg/kg. Fe content in all samples reached above the reference values (17–50 mg/kg) according to Kabata-Pendias and Mukhrjee (2007). Some specific mechanisms might be observed for E. sinica during absorption of additional Fe from rhizosphere soil. Cl content ranged from 102.36 mg/kg to 331.92 mg/kg in samples from different sites and was the second highest among the micro elements. Plants only require Cl in small amounts (Sun et al., 2013), but Cl content was high in E. sinica. Sr levels were between 80.79 and 269.36 mg/kg. Na contents were between 29.95 and 194.41 mg/kg. Minimum and maximum levels of B measured 10.88 and 41.86 mg/kg, respectively. Mo contents of samples varied to a lesser extent.
All these elements and other organic compounds all serve as important pharmacodynamic material bases of medicinal plants (Qin, 2011). However, considerable element
contents in plants fall within certain limits, and excessive metal elements may be harmful for humans. In our study, Zn contents ranged from 10.28 mg/kg to 28.26 mg/kg and were within the reference value of plant foodstuffs (Kabata-Pendias and Pendias, 2011). Cu contents obtained from different sites ranged from 2.07 mg/kg to 6.14 mg/ kg and were within the permissible limit proposed by WHO (1998). The contents of Mn were between 7.23 and 58.74 mg/kg. In sample 4, Mn content was above the reference value (27–50 mg/kg) of Kabata-Pendias and Mukhrjee for plants in agricultural lands. Studies found that nutritional supplementary with mineral elements, especially Cu and Mn, should be more suitable and be recommended for patients suffering chemotherapy to sustain nutrient homoeostasis (Kabata-Pendias and Mukhrjee, 2007; Akutsu et al., 2012).
Element uptake and accumulation of E. sinica
Availability of mineral elements to plants is regulated by soil characteristics, plant biological properties, climate conditions, etc. Soil characteristics, such as sand, silt, OM, and pH value, have important effects on absorption and transfer of specific elements in rhizosphere soil. We investigated the relationships between contents of essential elements in the soils and E. sinica grown on them. The measured results were shown in Table 5. Correlation analysis showed that sand, silt, and OM of the soils were more importance than other factors for E. sinica. For example, content of soil silt was positively related with the contents of N, K, Cl, Na, Mn, B, Cu, and Mo in plant, but content of soil sand was negatively proportional to N, K, Cl, Sr, Na, B, and Cu contents. OM content was positively correlated with N, K, Na, Mn, B, Cu, and Mo contents in plants, whereas Mn content was affected by pH value of soil.
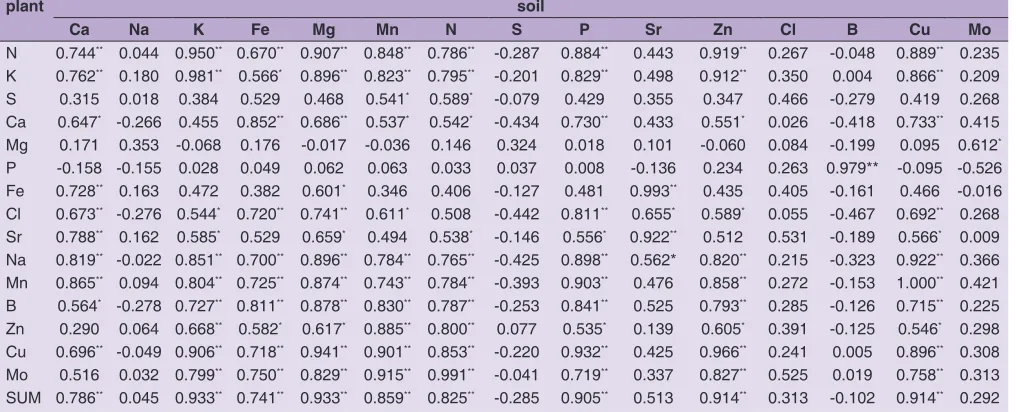
Among the 240 correlations analyzed between element contents from E. sinica and their rhizosphere soils (Table 6), 111 were statistically significant, and N, K, Ca, Sr, Mn, Zn, and Cu contents in plants were correlated to those in soils.
hyperaccumulate N (>12,500 mg/kg), S (>1,890 mg/kg), P (>463 mg/kg), Cl (>102 mg/kg), Sr (>80 mg/kg), and Mg (>1,488 mg/kg), and mean enrichment coefficients of
E. sinica to the six elements totaled 42.88, 34.37, 7.81, 4.38, 2.16, and 1.56, respectively, and the other elements yielded mean enrichment coefficients of <1.
Prediction models for element transfer from soil to E. sinica
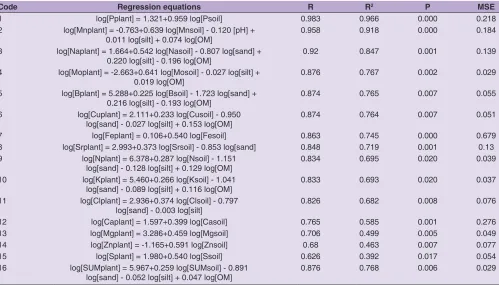
Table 7 showed the prediction models for the essential elements. Multiple linear regression analysis identified Csoil, pH, sand, silt, and OM as factors that best explained variability in Cplant (R2 = 39.2%–96.6%, P < 0.05). More than 76% of Cu, B, Mo, Na, Mn, and P contents in E. sinica were explained by soil factors. These prediction models could be used to obtain reliable predictions of element contents in E. sinica herbaceous stems and therefore used to assess potential value or risk
to humans. These models also contributed to regulation of E. sinica rhizosphere soils to ensure herb growth and quality safety. For example, based on the regression model 2, when grown on soil with high Mn factors, Mn content of E. sinica herbaceous stem can be reduced by raising soil pH.
Fig. 1 showed the interrelation between the identified log [Cplant] and its predicted value. Most predicted values fell within the 95% prediction interval, displaying the good accuracy for these models. Mean square error (MSE) values ranged from 0.029 to 0.679 for these prediction models (Table 7). Thus, these models were responsible predictors of element contents in E. sinica herbaceous stems.
These regression equations could also be used to evaluate the suitability of soils for herb safe production (Römkens et al., 2011). For example, according to Equation 6, an
Table 4: Elemental contents in plant samples (Content in mg/kg, n=3).
LOD N K S Ca Mg P Fe
0.010 0.001 0.010 0.004 0.004 0.002 0.002
plant 1 15298.38±458.95 3897.24±85.73 3944.55±71 2309.26±46.19 2058.22±47.34 915.45±22.89 443.52±12.86 plant 2 25602.48±768.07 5650.18±113 3806.45±45.68 3529.95±74.13 1965.8±37.35 702.76±16.87 743.89±22.32 plant3 29009.41±928.3 6241.97±118.6 4346.19±69.54 3602.38±82.85 1947.43±42.84 1150.93±28.77 675.68±18.42 plant 4 33304.26±965.82 7240.12±15204 4849.36±82.44 4543.73±95.42 2350.96±56.42 878.26±20.2 441.5±13.69 plant 5 12523.58±388.23 2810.56±53.4 1890.27±28.35 1047.60±19.9 1488.13±34.27 1092.29±27.31 120.27±3.73 plant 6 17225.55±516.77 4373.33±87.47 3619.69±57.92 2138.18±42.76 2645.57±66.14 1022.76±24.55 760.71±21.3 plant 7 14035.03±407.02 3361.83±70.6 4193.58±67.1 1259.11±23.92 2535.34±50.71 1068.45±22.44 167.13±5.01 plant 8 18639.95±559.2 3627.49±83.43 3207.46±48.11 3319.03±69.7 1708.60±35.88 984.20±25.59 215.52±6.03 plant 9 15091.58±422.56 3512.01±63.22 4180.26±71.06 3358.88±63.82 3251.8±81 633.25±14.56 206.40±6.4 plant10 12895.00±257.9 2796.88±55.93 4903.40±68.65 3187.47±66.9 2223.01±41.92 484.08±12.59 620.38±16.75 plant 11 17976.42±413.46 3523.78±72.9 4376.49±65.65 3284.36±65.69 2206.38±50.75 709.65±17.03 260.99±7.83 plant 12 18890.55±415.6 3975.80±71.56 3638.70±58.22 4700.99±84.62 2792.54±50.27 989.43±23.75 630.96±17.67 plant 13 17584.78±404.45 3519.41±77.42 3151.26±53.57 3295.43±72.5 2250.72±51.77 614.65±12.91 350.96±10.18 plant14 25160.22±603.8 5847.39±99.4 3698.18±55.47 3260.95±58.7 2313.56±46.27 463.50±10.2 569.23±15.37
Mean 19516.94 4312.71 3843.27 3059.81 2267.01 836.40 443.37
RSD 32.46 31.86 20.07 34.44 19.85 27.62 50.74
LOD Cl Sr Na Mn B Zn Cu Mo SUM
0.010 0.002 0.005 0.002 0.006 0.002 0.001 0.003
plant 1 195.86±5.09 134.30±6.47 94.90±2.37 23.36±0.37 24.39±0.78 18.52±0.72 2.83±0.11 0.77±0.02 29361.55 plant 2 305.56±6.42 256.41±6.67 132.38±2.78 31.67±0.6 32.11±1.16 19.16±0.73 4.28±0.18 0.97±0.03 42784.05 plant3 331.92±8.3 269.36±7.27 158.91±3.65 38.25±0,77 38.54±1.31 22.82±0.87 4.83±0.19 1.02±0.03 47839.64 plant 4 294.46±6.77 192.49±4.81 194.41±5.64 58.74±1.06 41.86±1.3 28.26±1.05 6.14±0.23 1.47±0.05 54426.02 plant 5 102.36±2.76 80.79±2.1 29.95±0.75 7.23±0.16 10.88±0.37 10.28±0.41 2.13±0.08 0.59±0.02 21216.91 plant 6 182.59±4.93 218.18±6.11 71.47±1.72 17.98±0.04 22.71±0.77 15.15±0.55 2.76±0.1 0.83±0.03 32317.46 plant 7 109.29±2.95 123.51±3.58 39.65±0.92 14.09±0.3 17.39±0.61 20.59±0.74 2.28±0.09 0.91±0.03 26948.18 plant 8 193.43±5.03 129.90±3.38 60.94±1.46 14.81±0.28 19.21±0.65 18.35±0.72 2.26±0.08 0.74±0.02 32141.89 plant 9 178.82±4.47 108.67±2.93 92.29±1.94 13.16±0.28 29.78±1.04 16.74±0.69 2.53±0.1 0.85±0.03 30677.06 plant10 280.76±5.9 237.71±5.7 97.72±2.15 15.37±0.31 27.72±0.94 19.52±0.76 2.07±0.08 0.90±0.03 27791.99 plant 11 281.37±7.88 115.36±3 101.45±2.54 26.71±0.53 23.61±0.78 13.96±0.56 2.53±0.1 0.66±0.02 32903.72 plant 12 262.93±6.05 236.75±5.92 115.50±2.66 39.46±0.75 28.88±0.99 12.23±0.45 3.40±0.14 0.90±0.03 36319.02 plant 13 272.36±7.08 140.24±3.51 91.02±2 25.40±0.53 22.78±0.77 21.55±0.86 3.55±0.14 0.80±0.02 31344.91 plant14 239.48±6.47 229.66±6.43 148.58±3.86 42.25±0.97 20.99±0.71 18.90±0.74 3.58±0.15 0.87±0.02 42017.34
Mean 230.80 176.67 102.08 26.32 25.78 18.29 3.23 0.88 34863.55
excessive case was employed to assess the soil fitness for production of Ma Huang by analyzing minimum sand and silt content and maximum of Cusoil and OM content. In this paper, maximum Cusoil (total content of soil elements correlated significantly with Cu in plants) and OM content in soil measured 123,764.69 and 22.11g/ kg, respectively. On the other hand, minimum sand and silt values totaled 760.2 and 2 g/kg, respectively. When these values were used in Equation 6, Cu content of 5.73 mg/kg from E. sinica was calculated, this value is considerably lower than the green standard limit (≤20 mg/kg) for medicinal plants (MOC, 2004). Therefore, when soil Cusoil content reaches 123,764.69 mg/kg, Cu content in E. sinica will not exceed the safety limit. This
finding further confirms the very low risk of producing
E. sinica with Cu contents exceeding the safety limit. Therefore, Equation 6 can provide scientific basis for Cu monitoring of E. sinica.
CONCLUSIONS
The present study showed that 15 essential element characteristics in wild E. sinica and its rhizosphere soil, revealed the influences of rhizosphere soil on the elements in the herbs, and established prediction models for transfer of elements from soil to plant. The study results will assist in regulation of mineral elemental contents in E. sinica
herbaceous stems.
Table 5: Correlation coefficients between the basic compositions in soils and the elemental contents in plants
plant Sand Silt Clay pH OM CEC
N -0.574* 0.739** 0.433 -0.462 0.763** 0.053
K -0.581* 0.711** 0.452 -0.470 0.737** 0.170
S -0.442 0.427 0.386 0.079 0.269 -0.200
Ca -0.277 0.414 0.187 -0.266 0.400 -0.099
Mg 0.150 -0.081 -0.155 -0.068 -0.052 0.150
P -0.118 0.270 0.046 -0.077 0.395 -0.341
Fe -0.516 0.430 0.476 -0.053 0.247 0.170
Cl -0.594* 0.670** 0.484 -0.100 0.431 -0.116
Sr -0.551* 0.477 0.501 -0.232 0.362 0.075
Na -0.553* 0.702** 0.422 -0.403 0.648* 0.105
Mn -0.481 0.641* 0.355 -0.575* 0.759** 0.222
B -0.645* 0.763** 0.512 -0.129 0.653* -0.290
Zn -0.451 0.488 0.375 -0.090 0.476 -0.036
Cu -0.623* 0.779** 0.479 -0.432 0.855** 0.021
Mo -0.499 0.568* 0.404 -0.271 0.758** -0.137
SUM -0.587* 0.745** 0.447 -0.435 0.748** 0.038
*. Correlation is significant at the 0.05 level (2‑tailed). **. Correlation is significant at the 0.01 level (2‑tailed).
Table 6: Correlation coefficients for the element contents between the plants and the soils
plant soil
Ca Na K Fe Mg Mn N S P Sr Zn Cl B Cu Mo
N 0.744** 0.044 0.950** 0.670** 0.907** 0.848** 0.786** -0.287 0.884** 0.443 0.919** 0.267 -0.048 0.889** 0.235 K 0.762** 0.180 0.981** 0.566* 0.896** 0.823** 0.795** -0.201 0.829** 0.498 0.912** 0.350 0.004 0.866** 0.209 S 0.315 0.018 0.384 0.529 0.468 0.541* 0.589* -0.079 0.429 0.355 0.347 0.466 -0.279 0.419 0.268 Ca 0.647* -0.266 0.455 0.852** 0.686** 0.537* 0.542* -0.434 0.730** 0.433 0.551* 0.026 -0.418 0.733** 0.415 Mg 0.171 0.353 -0.068 0.176 -0.017 -0.036 0.146 0.324 0.018 0.101 -0.060 0.084 -0.199 0.095 0.612* P -0.158 -0.155 0.028 0.049 0.062 0.063 0.033 0.037 0.008 -0.136 0.234 0.263 0.979** -0.095 -0.526 Fe 0.728** 0.163 0.472 0.382 0.601* 0.346 0.406 -0.127 0.481 0.993** 0.435 0.405 -0.161 0.466 -0.016 Cl 0.673** -0.276 0.544* 0.720** 0.741** 0.611* 0.508 -0.442 0.811** 0.655* 0.589* 0.055 -0.467 0.692** 0.268 Sr 0.788** 0.162 0.585* 0.529 0.659* 0.494 0.538* -0.146 0.556* 0.922** 0.512 0.531 -0.189 0.566* 0.009 Na 0.819** -0.022 0.851** 0.700** 0.896** 0.784** 0.765** -0.425 0.898** 0.562* 0.820** 0.215 -0.323 0.922** 0.366 Mn 0.865** 0.094 0.804** 0.725** 0.874** 0.743** 0.784** -0.393 0.903** 0.476 0.858** 0.272 -0.153 1.000** 0.421 B 0.564* -0.278 0.727** 0.811** 0.878** 0.830** 0.787** -0.253 0.841** 0.525 0.793** 0.285 -0.126 0.715** 0.225 Zn 0.290 0.064 0.668** 0.582* 0.617* 0.885** 0.800** 0.077 0.535* 0.139 0.605* 0.391 -0.125 0.546* 0.298 Cu 0.696** -0.049 0.906** 0.718** 0.941** 0.901** 0.853** -0.220 0.932** 0.425 0.966** 0.241 0.005 0.896** 0.308 Mo 0.516 0.032 0.799** 0.750** 0.829** 0.915** 0.991** -0.041 0.719** 0.337 0.827** 0.525 0.019 0.758** 0.313 SUM 0.786** 0.045 0.933** 0.741** 0.933** 0.859** 0.825** -0.285 0.905** 0.513 0.914** 0.313 -0.102 0.914** 0.292 **. Correlation is significant at the 0.01 level (2‑tailed).
Fig 1. Relationship between the measured log[Cplant] and the predicted log[Cplant]. y is measured logarithm value, and x is predicted logarithm value; R2 is the regression equations coefficient of determination in Table 7.
ACKNOWLEDGEMENT
We are grateful to Professor Minsheng Yan from Northwest Normal University for morphological identification of the plant species. This study was supported by a grant (No. 81760687) from the National Natural Science Foundation of China.
Authors’ contributions
ZHANG performed statistical analysis and helped in interpretation of data and discussion of results. Junyu LIANG and Hongling TIAN collected the samples.
REFERENCES
Abourashed, E. A., A. T. El-Alfy, I. A. Khan and L. Walker. 2003. Ephedra in perspective-a current review. Phytother Res. 17: 703-712.
AFNOR. 1996. Qualité des sols. Agence Française de NORmalisation, Recueil de normes Française, AFNOR, Paris.
Akutsu, Y., T. Kono, M. Uesao, I. Hoshino, K. Murakami, T. Fujishiro, S. Imanishi, S. Endo, T. Toyozumi and H. Matsubara. 2012. Are additional trace elements necessary in total parenteral nutrition for patients with esophageal cancer receiving cisplatin-based chemotherapy? Biol. Trace Elem. Res. 150: 109-155.
CCME. 2012. Soil Quality Guidelines for the Protection of Environmental and Human Health. Canadian Council of Ministers of the Environment.
CEPA. 2006. Environmental Quality Evaluation Standard for Farmland of Edible Agricultural Products (HJ/T 332-2006). Chinese Environmental Protection Administration, Beijing. Chen, X., X. Y. Zhang, R. R Zhang and K. C. Wang. 2009. Effects
of Mn, Fe, Zn, and Cu on growth and paeoniflorin content of Paeonia lactiflora. China J. Chin. Mater. Med. 34: 961-964. Cheng, J. J., C. F. Ding, X. G. Li, T. L. Zhang and X. X. Wang. 2015.
Rare earth element transfer from soil to navel orange pulp (Citrus sinensis Osbeck cv. Newhall) and the effects on internal fruit quality. PLoS One. 10(3): e0120618.
Han, J. P., S. L. Chen, W. S. Zhang and Y. Wang. 2006. Molecular ecology of Gardenia jasminoides authenticity. Chin. J. Appl.
Ecol. 17: 2385-2388.
Hong H., H. B. Chen, F. Xu, X. Y. Zang, D. H. Yang, X. Wang, S. Q. Cai and M. Mikage. 2011. Surveys on resources and varieties on Chinese markets of crude drug Mahuang. China J. Chin. Mater. Med. 36: 1129-1132.
Kabata-Pendias, A. and A. B. Mukhrjee. 2007. Trace elements from soil to humans. Springer, Berlin, pp. 87-415.
Kabata-Pendias, A. and H. Pendias. 2011. Trace elements in soils and plants. CRC Press, Boca Ratón.
Khasbagan. and Soyolt. 2007. Ephedra sinica Stapf (Ephedraceae): The fleshy bracts of seed cones used in mongolian food and its nutritional components. Econ. Bot. 61(2): 192-197.
MOC. 2004. WM/T 2-2004, Green Standards of Medicinal Plants and Preparations for Foreign Trade and Economy. Ministry of Commerce of the People’s Republic of China, Beijing.
MOA. 1988. NY/T85-1988, Method for Determination of Soil Organic Matter. Ministry of Agriculture of the Peopl’s Republic of China, Beijing.
MOA. 2006a. NY/T 1121.3-2006. Soil Testing Part 3: Method for Determination of Soil Mechanical Composition. Ministry of Agriculture of the Peopl’s Republic of China, Beijing.
MOA. 2006b. NY/T 1121.5-2006. Method for Determination of Soil Cation Exchange Capacity in Calcareous Soil. Ministry of Agriculture of the Peopl’s Republic of China, Beijing.
MOA. 2007. NY/T1377-2007. Determination of pH in Soil. Ministry of Agriculture of the Peopl’s Republic of China, Beijing.
Nasim, S. A. and B. Dhir. 2010. Heavy metals alter the potency of medicinal plants. Rev. Environ. Contam. Toxicol. 203: 139-149. Ohkama-Ohtsu, N. and J. Wasaki. 2010. Recent progress in
plant nutrition research: Cross-talk between nutrients, plant physiology and soil microorganisms. Plant Cell Physiol. 51(8): 1255-1264.
Table 7: The prediction models for the element contents of E. Sinica (n=14)
Code Regression equations R R2 P MSE
1 log[Pplant] = 1.321+0.959 log[Psoil] 0.983 0.966 0.000 0.218
2 log[Mnplant] = -0.763+0.639 log[Mnsoil] - 0.120 [pH] +
0.011 log[silt] + 0.074 log[OM] 0.958 0.918 0.000 0.184
3 log[Naplant] = 1.664+0.542 log[Nasoil] - 0.807 log[sand] +
0.220 log[silt] - 0.196 log[OM] 0.92 0.847 0.001 0.139
4 log[Moplant] = -2.663+0.641 log[Mosoil] - 0.027 log[silt] +
0.019 log[OM] 0.876 0.767 0.002 0.029
5 log[Bplant] = 5.288+0.225 log[Bsoil] - 1.723 log[sand] +
0.216 log[silt] - 0.193 log[OM] 0.874 0.765 0.007 0.055
6 log[Cuplant] = 2.111+0.233 log[Cusoil] - 0.950
log[sand] - 0.027 log[silt] + 0.153 log[OM] 0.874 0.764 0.007 0.051
7 log[Feplant] = 0.106+0.540 log[Fesoil] 0.863 0.745 0.000 0.679
8 log[Srplant] = 2.993+0.373 log[Srsoil] - 0.853 log[sand] 0.848 0.719 0.001 0.13
9 log[Nplant] = 6.378+0.287 log[Nsoil] - 1.151
log[sand] - 0.128 log[silt] + 0.129 log[OM] 0.834 0.695 0.020 0.039
10 log[Kplant] = 5.460+0.266 log[Ksoil] - 1.041
log[sand] - 0.089 log[silt] + 0.116 log[OM] 0.833 0.693 0.020 0.037
11 log[Clplant] = 2.936+0.374 log[Clsoil] - 0.797
log[sand] - 0.003 log[silt] 0.826 0.682 0.008 0.076
12 log[Caplant] = 1.597+0.399 log[Casoil] 0.765 0.585 0.001 0.276
13 log[Mgplant] = 3.286+0.459 log[Mgsoil] 0.706 0.499 0.005 0.049
14 log[Znplant] = -1.165+0.591 log[Znsoil] 0.68 0.463 0.007 0.077
15 log[Splant] = 1.980+0.540 log[Ssoil] 0.626 0.392 0.017 0.054
16 log[SUMplant] = 5.967+0.259 log[SUMsoil] - 0.891
Pharmacopoeia. 2015. Pharmacopoeia of the People's Republic of China. Pharmacopoeia of the P. R. China. Vol. 1. China Medical Science Press, Beijing, pp. 320-321.
Qin, J. F. 2011. The research of trace elements of Chinese medicine in China III. Trace element: Material basis of quantifying property and efficacy of Chinese medicine. Guangdong Trace Elem. Sci. 18(1): 1-10.
Römkens, P. F., D. J. Brus, H. Y. Guo, C. L. Chu, C. F. Chiang and G. F. Koopmans. 2011. Impact of model uncertainty on soil quality standards for cadmium in rice paddy fields. Sci. Total Environ. 409: 3098-3105.
Shen, G. M. 1995. Distribution and evolution of the genus Ephedra in China. Acta Bot. Yunnanica. 17: 15-20.
Singh, V. and A. N. Garg. 1997. Availability of essential trace elements in Ayurvedic Indian medicinal herbs using instrumental neutron activation analysis. Appl. Radiat. Isot. 48: 97-101.
Suchacz, B. and M. Wesolowski. 2013. Classification of herbal mixtures on the basis of some metals content using pattern recognition techniques. J. Trace Elem. Med. Bio. 27: 168-170.
Sun, J. B., Y. G. Gao, P. Zang, H. Yang and L. X. Zhang. 2013. Mineral elements in root of wild Saposhnikovia divaricate and its rhizosphere soil. Biol. Trace Elem. Res. 153: 363-370.
Tuo, F., D. H. Li, F. Q. Zhou, J. H. Luo, H. Tuo and X. Z. Kong. 2010. Determination of trace elements in Chinese medicinal plants by instrumental neutron activation analysis. J. Radioanal. Nucl. Chem. 284: 507-511.
Wang, F. 2012. Trace element research in China: Present and future. Chin. Bull. Life Sci. 24: 713-730.
WHO. 1998. Quality Control Methods for Medicinal Plant Materials. World Health Orgainzation Offset Publication, Geneva.
Xin, G. Z., B. Hu, Z. Q. Shi, J. Y. Zheng, L. Wang, W. Q. Chang, P. Li, Z. P. Yao and L. F. Liu. 2015. A direct ionization mass spectrometry-based approach for differentiation of medicinal Ephedra species. J. Pharm. Biomed. 117: 492-498.
![Fig 1. Relationship between the measured log[Cplant] and the predicted log[Cplant]. y is measured logarithm value, and x is predicted logarithm value; R2 is the regression equations coefficient of determination in Table 7.](https://thumb-us.123doks.com/thumbv2/123dok_us/1256156.1631122/8.612.61.558.59.596/relationship-predicted-logarithm-predicted-regression-equations-coefficient-determination.webp)