Original Research Article
Effect of socio-economic, demographic and environmental factors on
nutritional status of elderly: a cross sectional study
Darshan J. Patil, Maheshkumar M. Shindhe*
INTRODUCTION
‘Aging’ is a continuous process which is progressive and inevitable. No one knows why the ‘aging’ occurs. However, Horman postulates states that ‘aging’ is a result of progressive accumulation of changes in the body. This is also because of wearing of structures and functions in the body during development.1
‘Aging’ is the most important demographic
transformation of 21st century. The elderly population is
growing faster than any other age group. It is expected to cross the age group of 0-9 years by 2030 and 10-24 years by 2050.2 This is because of increase in life expectancy which has increased in last 10 years.3
In 1991, the elderly population in India was 6.8% of total population and by 2011 it increased to 8.6%. It is expected to cross 18.3% by 2050. The elderly population in Karnataka (7.7%) also increasing. However it is lesser than Tamil Nadu (10.4%), Goa (11.2%) and Kerala (12.6%).4
ABSTRACT
Background: Worldwide elderly population is rapidly increasing. This is posing many challenges in elderly population. Malnutrition in them is one of the major problems but ignored component. Socio-economic, demographic and environmental factors are those greatly influence their nutritional status. Hence the present study was undertaken to assess the effect of socio-economic, demographic and environmental factors on nutritional status of elderly.
Methods: The present study was a cross-sectional study which included 545 elderly population of Uchagaon subcentre and was carried out over a period of 1½ years. After selecting Uchagaon subcentre by simple random sampling technique and house to house survey was carried out to select eligible elderly participants who met the selection criteria. Data was collected from eligible elderly by using pretested questionnaire and Mini Nutritional Assessment (MNA) tool.
Results: 65.1% were between the age group of 60-69 years. 55% were females, 66% were currently married, 60% had no formal schooling, 67.2% were belongs to socio-economic status of either class IV/V. 23.5% were malnourished and 49% were at risk of malnutrition. There was association found between nutritional status of elderly with increase in age, marital status, educational status, occupation, socio-economic status, type of family and housing condition.
Conclusions: In the present study majority of the elderly were at risk of malnutrition. The nutritional status of elderly was associated with increase in age, marital status, educational status, occupation, socio-economic status, type of family and housing condition of rural elderly and subsequently modify those factors to improve the nutritional status of elderly and this can be a scope for further study in future.
Keywords: Elderly, Nutritional status, Socio-economic, Demographic factors, Mini nutritional assessment tool Department of Community Medicine, Belgaum Institute of Medical Sciences, Belagavi, India
Received: 23 May 2019
Accepted: 09 July 2019
*Correspondence:
Dr. Maheshkumar M. Shindhe, E-mail: [email protected]
Copyright: © the author(s), publisher and licensee Medip Academy. This is an open-access article distributed under the terms of the Creative Commons Attribution Non-Commercial License, which permits unrestricted non-commercial use, distribution, and reproduction in any medium, provided the original work is properly cited.
Rapid rise in elderly population causes many problems including malnutrition, which is a major but neglected component. Elderly are vulnerable to malnutrition because of many factors. Some of the important factors are low socio economic status, poor environmental condition, reduced physical activity, poor dietary pattern, reduced physical activity, personal habits and others which influences their nutritional status in them.
To estimate the nutritional status of elderly, Nestlé’s Mini Nutritional Assessment (MNA) is one of the most recognized screening tools and is used all over the world.
Mini nutritional assessment (MNA)-is an 18
questionnaire screening tool with a total scoring of 30. Nutritional status were classified as normal nutritional status (24-30), at risk of malnutrition (17.5-23.5) and malnourished (<17).5 It is specially designed for elderly to detect malnutrition and those at risk of malnutrition. It has high sensitivity of 96% and specificity of 98%.6 The nutritional status in elderly is affected by many factors. A study conducted by Shivaraj et al revealed that, the malnutrition among the elderly was associated with increase in age, female sex, illiterate, cultivator, financial dependency.7
In rural set up only few studies were carried out to know the effect of socio-economic, demographic and environmental factors on the nutritional status of elderly. Hence an attempt was made to carry out the present study to assess the effect of socio-economic, demographic and environmental factors on the nutritional status of elderly in rural area of Belagavi district.
METHODS
Study area
The study was carried out in Uchagaon subcentre, Uchagaon, Rural Health Training Centre (RHTC), BIMS, Belagavi.
Study design
A cross-sectional study.
Study duration and period
Duration of 1½ years, between January 2016 to June 2017.
Sample size: Considering the prevalence of malnutrition in elderly as 15%.8
where, n= sample size
z= alpha error= 1.96
p= prevalence of malnutrition= 15%, q= 100-p= 85,
d= absolute error as 3%.
so, n= ≈ 545
n=545.
Method of collection of data
It was a cross sectional study conducted in Uchagaon RHTC, which has 6 sub centres. A simple random sampling technique was used to select Uchagaon sub centre which covers 2 villages. House to house survey was carried out to select eligible elderly after applying below mentioned selection criteria.
Inclusion criteria
Persons aged ≥60 years, residing in the selected area for >1 year.
Exclusion criteria
Terminally illness.
Data collection
Data was collected using pretested questionnaire which comprised of socio-demographic, socio-economic status (by using Udai-Pareek’s SES classification) and environmental information. Nutritional status was assessed by Nestlé’s Mini Nutritional Assessment (MNA) tool. Written informed consent was obtained from all the participants.
Statistical analysis
The data was analysed using SPSS version 22.0 after entering in Microsoft Excel Windows 10 spreadsheet. The association between the MNA score with epidemiological factors and other variables were tested using chi-square test. Significance level was considered at ‘p’ value of ≤0.05.
RESULTS
Among the 545 elderly participants, 245 (45%) were males and 300(55%) were females. Majority of the participants (65.1%) were in the age group of 60-69 years followed by 70-79 years age group (26.6%). Maximum participants among total males (58.8%) and females (70.3%) were in the age group of 60-69 years. Overall the mean age (±SD) of the study participants was 67.84 (±6.38) years (Table 1).
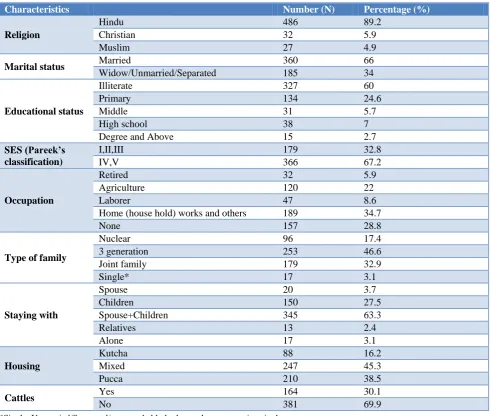
education. More than 3/4th (67.2%) of the participants belonged to class IV and V socio economic status. Majority of the participants were engaging themselves in their household works (34.7%) followed by agricultural activity (22.0%). 5.9% were retired from their previous jobs. Among the total participants, 253 (46.6%) were with 3 generation family. 63.3% were staying with spouse and children, 27.5% were staying with only children and only 3.1% were staying alone. 247 (45.3%) participants were living in mixed type house and cattles were present in 30.1% of the participants (Table 2).
Table 1:Distribution of the elderly participants according to their gender and age group.
Age groups (in years)
Gender
Total N (%) Male
N (%)
Female N (%)
60-69 144 (58.8) 211 (70.3) 355(65.1)
70-79 77 (31.4) 68 (22.7) 145 (26.6)
≥80 24 (9.8) 21 (7) 45 (8.3)
Total 245 (45) 300 (55) 545
Table 2:Distribution of the participants according to the characteristics.
Characteristics Number (N) Percentage (%)
Religion
Hindu 486 89.2
Christian 32 5.9
Muslim 27 4.9
Marital status Married 360 66
Widow/Unmarried/Separated 185 34
Educational status
Illiterate 327 60
Primary 134 24.6
Middle 31 5.7
High school 38 7
Degree and Above 15 2.7
SES (Pareek’s classification)
I,II,III 179 32.8
IV,V 366 67.2
Occupation
Retired 32 5.9
Agriculture 120 22
Laborer 47 8.6
Home (house hold) works and others 189 34.7
None 157 28.8
Type of family
Nuclear 96 17.4
3 generation 253 46.6
Joint family 179 32.9
Single* 17 3.1
Staying with
Spouse 20 3.7
Children 150 27.5
Spouse+Children 345 63.3
Relatives 13 2.4
Alone 17 3.1
Housing
Kutcha 88 16.2
Mixed 247 45.3
Pucca 210 38.5
Cattles Yes 164 30.1
No 381 69.9
*Single: Unmarried/Separated/separated elderly those who were staying single.
Among the 545 participants, 128 (23.5%) participants were malnourished, 267 (49%) were at risk of malnutrition and 150 (27.5%) had normal nutritional status (Table 3).
It was observed that, among the participants aged 60-69 years and 70-79 years, majority were at risk of developing malnutrition and in the participants aged
Among the elderly those who were widowed/unmarried/separated, majority (46.5%) were malnourished than the currently married (11.7%). There was statistically significant association found between marital status and MNA score. In the present study, among the illiterates 51.7% of the participants were at risk of malnutrition and 29.3% were malnourished, whereas among the group with educational status of primary and above, 45% were at risk of malnutrition and only 14.7% were malnourished. Statistically significant association found between educational status and nutrition of elderly (Table 5).
Table 3:Distribution of participants according to their MNA scoring.
MNA
categorization Number
Percentage (%) Normal
nutritional status 150 27.5 At risk of
malnutrition 267 49
Malnourished 128 23.5
Total 545 100
Table 4:Association between age group, gender of participants and MNA scoring.
Variable MNA scoring χ
2
value and p value Normal At risk Malnourished Total N(%)
χ2
: 186.01 ‘p’ value: <0.001
Age group (Years) N (%)
60-69 138 (38.9) 185(52.1) 32 (9) 355 (65.1)
70-79 11 (7.6) 77 (53.1) 57 (39.3) 145 (26.6)
≥80 1 (2.2) 5 (11.1) 39 (86.7) 45 (8.3)
Gender N (%) Male 79 (32.3) 114(46.5) 52 (21.2) 245 (45) χ
2
: 5.125 ‘p’ value: 0.07
Female 71 (23.7) 153 (51) 76 (25.3) 300 (55)
Table 5:Relation between marital status, education status and nutritional status of elderly with MNA score.
Variable
MNA scoring
χ2
value and p value Normal At risk Malnourish Total
N (%) N (%) N (%) N (%)
Marital status
Married 128 (35.5) 190 (52.8) 42 (11.7) 360 (66)
χ 2
: 91.051 p<0.001 Widow/
Unmarried/ Separated
22 (11.9) 77 (41.6) 86 (46.5) 185 (34)
Education
Illiterate 62 (19) 169 (51.7) 96 (29.3) 327 (60)
χ 2
: 34.986 p<0.001 Primary
and above 88 (40.3) 98 (45) 32 (14.7) 218 (40)
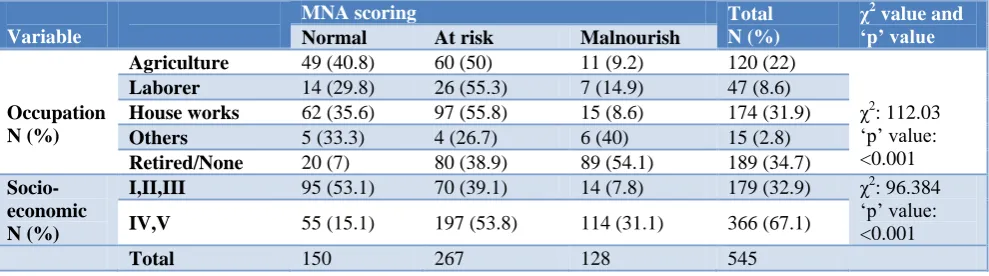
Table 6:Association between occupation, socio-economic status and MNA scoring of the elderly.
Variable
MNA scoring Total
N (%)
χ2
value and ‘p’ value
Normal At risk Malnourish
Occupation N (%)
Agriculture 49 (40.8) 60 (50) 11 (9.2) 120 (22)
χ2
: 112.03 ‘p’ value: <0.001
Laborer 14 (29.8) 26 (55.3) 7 (14.9) 47 (8.6)
House works 62 (35.6) 97 (55.8) 15 (8.6) 174 (31.9)
Others 5 (33.3) 4 (26.7) 6 (40) 15 (2.8)
Retired/None 20 (7) 80 (38.9) 89 (54.1) 189 (34.7)
Socio-economic N (%)
I,II,III 95 (53.1) 70 (39.1) 14 (7.8) 179 (32.9) χ2: 96.384 ‘p’ value: <0.001
IV,V 55 (15.1) 197 (53.8) 114 (31.1) 366 (67.1)
Total 150 267 128 545
Among the elderly, those who have retired/doing no work, majority were malnourished (54.1%) which was high when compared to those who were doing other works (40%), labourers (14.9%) and house wives (8.6%). Statistically significant association was found between occupation and MNA scoring of the elderly. The total cases of malnutrition was found to be high among the
Table 7: Association between type of family and staying with status with MNA scoring of elderly.
Variable
MNA scoring Total*
N (%)
χ2
value and p value
Normal At risk Malnourished
N (%) N (%) N (%)
Type of family
Single* 02 (11.8) 02 (11.8) 13 (76.4) 17 (3.1)
χ2
: 36.865 p value <0.001
Nuclear 33 (34.4) 50 (52.1) 13 (13.5) 96 (17.4)
3 generation 75 (29.7) 116 (45.8) 62 (24.5) 253 (46.4)
Joint family 40 (22.4) 99 (55.3) 40 (22.3) 179 (32.9)
Staying with
Spouse 5 (25) 11 (55) 4 (20) 20 (3.7)
χ2
: 89.738 p value <0.001
Children 19 (12.7) 66 (44) 65 (43.3) 150 (27.6)
Spouse and
children 123 (35.6) 181 (52.5) 41 (11.9) 345 (63.3)
Alone/Friend/
Relatives 3 (10) 9 (30) 18 (60) 30 (2.4)
Total 150 267 128 545
*Single: unmarried/separated elderly those who were staying alone
Table 8: Relation between type of housing, status of cattle shed and MNA scoring of elderly.
Variable
MNA scoring
Total χ2 value and
p value Normal At risk Malnourished
N (%) N (%) N (%) N (%)
Housing condition
Kutcha 11(12.5) 38 (43.2) 39 (44.3) 88 (16.2)
χ2
: 45.97 p value <0.001
Mixed 57 (23.1) 129(52.2) 61 (24.7) 247 (45.3)
Pucca 82 (39) 100(47.6) 28 (13.4) 210 (38.5)
Cattle shed Yes 74 (45.1) 69 (42.1) 21 (12.8) 164 (30.1) χ
2
: 40.087 p value <0.001
No 76 (19.9) 198 (52) 107 (28.1) 381 (69.9)
Total 150 267 128 545
In the present study majority of the participants were from 3 generation family. The malnutrition status was found to be high among those who were living single (76.4%) than the 3 generation (24.5%), nuclear (13.5%) and joint (22.3%) families. There was a significant difference found between type of family and MNA scoring.
Out of 545 elderly, 30 (2.4%) were staying alone or with friends/relatives. Among them 60% were malnourished which was high when compared to those who stay with children (43.3%), with spouse (20%). There was a significant association found between with whom they stay and MNA score (Table 7).
Among the elderly participants the malnutrition was found to be high among those who had Kutcha house (44.3%) than those with mixed type of house (24.7%) and pucca house (13.4%). Their association was found to be statistically significant. Malnutrition was found to be high (28.1%) among those who had no cattle shed. There was a significant association found between status of cattle shed and MNA score of the elderly (Table 8).
DISCUSSION
Elderly population is increasing in faster rate. Increasing
in elderly population raising many challenges.
Malnutrition is one among them. It is influenced by many
factors like socio-economic, demographic and
environmental factors.
Keeping these in mind, the study was carried out over a period of 1½ years which included 545 elderly residing in Uchagaon sub centre, RHTC, Belagavi.
In the present study, almost 2/3rd (65.1%) of the elderly participants were in the age group of 60-69 years with the mean age of 67.84±6.38 years. A significant association was found between low MNA scoring and advanced age. The finding observed in our study was similar to the study conducted by Kansal et al in rural Belagavi, Kavya et al in rural Bangalore and Vedantham et al.9-11 Study conducted by Paul et al, Agarwal et al and Krithika et al also showed similar association between advanced age and low MNA score et al.8,12,13 A study conducted by Reddy et al in rural areas of Tamil Nadu observed that the mean age of the entire study population was 69.8±7.8 years which was almost similar to our study.14
with female predominance with no significant association found between gender and MNA scoring.9,10
In contrast, studies conducted by Lahiri, Kritika, Reddy et al had shown that male participants were more than the females.13-15 However, there was no significant association between gender and MNA scoring. The female predominance could be because of greater life expectancy in females than males in India.
The present study revealed that, 60% were illiterate and remaining 40% participants were literates and a significant association was found between educational status and MNA scoring. These findings were similar to studies conducted by Kritika, Lahiri, Shivaraj, Vedantam, Mathew et al.7,11,13,15,16
In contrast to the present study, Bishnoi et al revealed low illiteracy rate (28%).17 But Ghimire et al had shown higher illiteracy (72.3%).18 However both the studies had shown significant association between literacy and MNA scoring. In literates the malnutrition was found to be less than the illiterates. This could be because; literates are well aware of dietary intake and maintain nutritional status.
In the present study, 66% were currently married. There was an association between MNA score and marital status. The findings are comparable with the study conducted by Bishnoi et al where 69.3% were currently married.17 In other studies done by Lahiri (88.9%), Meenu (80.7%), Kritika et al (71.4%) were currently married.13,14,19
In our study, majority of the participants belonged to class IV/V (67.1%) socio economic status. The observations are almost similar to that of the study conducted by Kansal et al where majority of the participants belonged to class IV/ V (54.21%).9 In contrast to the present study, studies by Mathew, Bishnoi et alrevealed that majority of the participants belonged to class I, II, III socio economic status.16,17
The present study revealed, 46.4% of the participants were from 3 generation family, followed by joint family (32.8%) and nuclear family (17.4%). As compared to the study conducted by Khushboo et al which showed that, majority of the participants were from nuclear family (72%) followed by joint family (28%).20
63.3% of the study participants were staying with spouse and children, 27.5% were staying with only children, 3.7% were staying with only spouse, 2.4% were staying with relatives/ friends/ staying alone. Comparing to our study, a study conducted by Vedantham et al most of the elderly participants were living with their children (66%) and 21% were living with other family members including spouse and relatives.11 In the present study higher prevalence of malnutrition was found among the
elderly those who were staying with friends/family/ alone. This could be due to poor nutritional care provided by friends/relatives than children/spouse.
Present study revealed, 45.3% were staying in mixed type (semi pucca) house, 38.5% were in pucca house and 16.2% were living in kutcha house. The observations are almost similar to the study conducted by Arlappa et al where majority of the participants were residing in semi-pucca house (65%) followed by kutcha (19%) and semi-pucca (16%) house.21 There was a significant association found between housing condition and MNA scoring. The reason could be because, those who reside in kutcha house/no house belonged to low socio economic status and had poor awareness regarding nutrition and dietary intake.
Our study has certain limitations. The present study was carried out in only one sub centre. No blood investigations were carried out to determine the nutritional status of elderly. Except calories intake, detailed analysis of the dietary intake was not carried out.
Many epidemiological factors influenced the nutritional status of rural elderly. There is a need to modify those factors to improve the nutritional status of elderly and this can be a scope for further study in future.
CONCLUSION
The present study revealed, majority of the elderly participants were in the age group of 60-69 years, currently married, females, belongs to Hindu religion, illiterates, from 3 generation family, staying in mixed type of houses and belongs to class IV/V SES. In the present study the nutritional status of elderly by MNA tool revealed that majority of the participants were at risk of malnutrition. The nutritional status of elderly was associated with increase in age, marital status, educational status, occupation, socio-economic status, type of family and housing condition. There was no association found between nutritional status and gender difference.
ACKNOWLEDGEMENTS
We are thankful to all the staff members of Department of Community Medicine, BIMS, Belagavi for their support. We are also thankful to all the elderly participants of Uchagaon, Belagavi.
Funding: No funding sources Conflict of interest: None declared
Ethical approval: The study was approved by the Institutional Ethics CommitteeofBIMS, Belagavi.
REFERENCES
Available at http://onlinelibrary.wiley.com/doi/10.
1080/1 5216540601178067/pdf. Accessed 22
November 2018.
2. Department of Social Economics and Social Affairs, Population division. United Nations, New York.
World population aging-2015. Available at
http://www.un.org/en/development/desa/population/ publications/pdf/ageing/WPA2015_Report.pdf. Accessed 22 November 2018.
3. Department of Economic and Social Affairs, United Nations. Multimedia Library-World Population Prospects: The 2017 Revision. Available at https://www.un.org/development/desa/publications/. Accessed 23 November 2018.
4. Government of India, Ministry of Statistics and Programme implementation, Central statistics office. Elderly in India-Profile and Programmes-2016. Available at http://mospi.nic.in/sites/ default/files/publication_reports/ElderlyinIndia_ 2016.pdf. Accessed 23 November 2018.
5. Mini Nutritional Assessment, Nestle Nutrition
Institute. Available at:
http://www.mna-elderly.com/forms/MNA_english.pdf. Accessed 29 November 2018.
6. Vellas B, Guigoz Y, Garry PJ, Nourhashemi F, Bennahum D, Lauque S, et al. The Mini Nutritional Assessment (MNA) and its use in grading the nutritional state of elderly patients. Nutrition. 1999;15(2):116-22.
7. Shivaraj M, Singh VB, Singh K, Neelam M, Sharma
D. Study of Nutritional status in Elderly in Indian Population. Int J Current Res. 2014;6(11):10253-7.
8. Agarwalla R, Saikia AM, Baruah R. Assessment of
the nutritional status of the elderly and its correlates. J Family Community Med. 2015;22(1):39-43. 9. Kansal D, Baiga SS, Kruthika K, Mallapur MD.
Nutritional assessment among population of rural Belagavi: a cross sectional study. Int J Med Sci Public Health. 2016;5(4):1496-9.
10. Kavya C, Sathosh A. Geriatric health; Assessment of the nutritional status and functional ability of elderly living in rural area of Bangalore, Karnataka, India. Int J Community Med Public Health. 2016;3(12):3460-4.
11. Vedantam A, Subramanian V, Nicholas VR, John KR. Malnutrition in free living in rural south India: Prevalence and risk factors. Public Health Nutr. 2009;13(9):1328-32.
12. Paul SS, Abraham VJ. How healthy is our geriatric population? A community based cross sectional study. J Family Med Prim Care. 2015;4(2):221-4. 13. Kritika, Deepshika, Senwal J, Vyas S, Juyal R, Sati
HC. Nutritional status and associated comorbidities among the elderly in Doiwala block, Dehradun. Indian J Community Health. 2014;26(2):197-203.
14. Reddy BN, Reddy LK, Pallavi M, Reddy N,
Shireesha P. A study on nutritional status and prevalence of non-communicable diseases among the rural elderly of Tamil Nadu: A community based cross sectional study. Int J Res Health Sci. 2014;2(2):604-9.
15. Lahiri S, Biswas A, Santra S, Lahiri SK. Assessment of Nutritional Status among Elderly population in a Rural area of West Bengal, India. Int J Med Sci Public Health. 2015;4(4):569-72.
16. Mathew AC, Das D, Sampath S, Vijaykumar M, Ramakrishnan N, Ravishankar SL. Prevalence and Correlates of Malnutrition among Elderly in an Urban area in Coimbatore. Indian J Public Health. 2016;60(2):112-7.
17. Bishnoi A, Kumar S, Mittal A, Goel RKD, Nazir M, Preet H, et al. An Epidemiological Study of the Nutritional Status of the Elderly in Rural Population of Ambala District, Haryana. Int J Health Sci Res. 2016;6(10):28-32.
18. Ghimire S, Baral BK, Callahan K. Nutritional assessment of community dwelling older adults in rural Nepal. PLoS ONE. 2017;12(2):1-15.
19. Meenu K, Amrit V, Gupta BP, Jasdeep S.
Assessment of malnourishment in elderly of rural Punjab. Healthline.2014;5(2):24-8.
20. Khushboo T, Bala N, Anisha V, Sarita S. Nutritional status and dietary pattern in elderly people of trans Yamuna area of Allahabad. World J Pharm Pharmaceutical Sci. 2015;4(10):1027-42.
21. Arlappa N, Balakrishna N, Kokku SB, Harikumar R, Rao KM. Diet and Nutritional status of the older adults in rural area. J Ageing Res Healthcare. 2016;1(1):36-48.