Original Research Article
An epidemiological study of road traffic accidents among patients
admitted in a tertiary care hospital in Puducherry
Muthukumar T.
1*, Zile Singh
2, Vishnu Prasad R.
3, Abel K. Samuel
4, Raja T. K.
5INTRODUCTION
Road traffic accidents (RTA) are the only public health problem for which society and decision makers still accept death and disability among young people on a large scale.1 The demographic, epidemiological and economic transition in India has changed the health scenario in a significant way during the last two decades. This shift in health problems and priorities has brought
the entire spectrum of non-communicable diseases to the forefront of health care delivery system.
Spectacular advances made in health & health related sciences have paid with dividends in bringing down the mortality and morbidity due to communicable diseases. This has resulted in longevity of the people. At the same time globalization has improved the socio economic status of the people resulting in changes in the life style
ABSTRACT
Background: Road traffic accidents (RTA) are the only public health problem for which society and decision makers still accept death and disability among young people on a large scale. This study was undertaken to determine the various epidemiological factors influencing RTA with a view to suggest appropriate remedial measures for prevention of accidents.
Methods: A hospital based prospective observational study was conducted at a tertiary care hospital in Puducherry. All the patients admitted in the hospital due to RTA from Jan to Dec 2014 were interviewed by using a pre-tested and pre-designed questionnaire. Data was entered in MS Excel and analysed using SPSS version 21.0. Institute ethics committee clearance was obtained.
Results: Among 541 participants, 50% of the victims were in the productive age group of 20-40 yrs. The approximate speed of majority of the vehicles (55.6%) at the time of accident was 40-80 km/hr. Among the accident victims, 85.8% of the two wheeler riders did not use helmet and 70.9% of the car drivers did not wear seat belt at the time of accident. Around 39% of the drivers were under the influence of alcohol at the time of accident. Mobile phone is the major cause of distraction (51.9%) at the time of accident.
Conclusions: Based on this study it is evident that prevention and control of most of the modifiable factors can bring about a change in the statistics that would ensure our future to be safer.
Keywords: Road traffic accidents, Epidemiological study, Puducherry, RTA
Department of Community Medicine, 1Shri Sathya Sai Medical College and Research Institute, Sri Balaji Vidyapeeth, Ammapettai, Tamil Nadu, 2Pondicherry Institute of Medical Sciences, Puducherry, 4Believers Church Medical College, Thiruvalla, Kerala, 5Chettinad Hospital and Research Institute, Chennai, Tamil Nadu, India
3
Deputy Assistant Director of Health, Army Medical Corps, Firozpur Cantonment, Punjab, India
Received: 13 April 2018
Revised: 28 May 2018
Accepted: 29 May 2018
*Correspondence:
Dr. Muthukumar T.,
E-mail: [email protected]
Copyright: © the author(s), publisher and licensee Medip Academy. This is an open-access article distributed under the terms of the Creative Commons Attribution Non-Commercial License, which permits unrestricted non-commercial use, distribution, and reproduction in any medium, provided the original work is properly cited.
of the people. The longevity of life and changes in the life styles has brought the entire spectrum of non-communicable disease and accidents to the forefront of health care delivery system. A steep increase in vehicle and human population traversing the adverse road situations has made road traffic injuries a serious condition. The phenomenal increase in morbidity, mortality, disability and socio-economic impact from injuries in particular, during the past decade has been a matter of increasing concern among professionals and policy makers. 2
Accidents represent major epidemic of non-communicable diseases of present century. In many countries of the world motor vehicle accidents rank first among all accidents. Road accidents are human tragedy. They involve high human suffering and monetary costs in terms of ultimately deaths, injuries and loss of potential income. They are no longer accidental. They are part of price we pay for technological progress. The global burden of disease due to RTI is expected to move from ninth position to third position by 2020. The economic cost of road crashes and injuries is estimated to be 1% of gross national product (GNP) in low-income countries, 1.5% in middle income countries and 2% in high-income countries. The global cost is estimated to be US$ 518 billion per year. Low-income and middle-income countries account for US$ 65 billion, more than they receive in development assistance.3
Accidents are definitely on an increase in India. Increasing mechanization in agriculture and industry, induction of semi-skilled and unskilled workers in various operations and rapid increase in vehicular traffic have resulted in an increase in morbidity and mortality due to accidents. Overcrowding, lack of awareness and poor implementation of essential safety precautions result in an increasing number of accidents.4 India registers the highest road traffic accidents in the world. In India as of today more than a million are injured annually and about a lakh killed in road traffic accidents.5,6 According to the National Transportation and Planning centre, the number of road traffic accidents in India in three times higher than that of the developed countries.
One serious road traffic accident occurs in the country every minute and 16 die on Indian roads every hour. 1214 Road Traffic Accidents and 377 deaths due to RTA occur every day in India. Two wheelers account for 25% of total RTA deaths.20 children under the age of 14 die every day due to RTA in the country. Two people die every hour in Uttar Pradesh – state with maximum number of RTA deaths and Tamil Nadu is the state with the maximum number of RTA injuries. Delhi is the city with highest number of deaths due to RTA followed by Chennai.7 This study was undertaken to determine the various epidemiological factors influencing road traffic accidents with a view to suggest appropriate remedial measures for prevention of accidents.
METHODS
A hospital based prospective observational study was conducted at Pondicherry Institute of Medical Sciences, a tertiary care hospital at Puducherry. All the patients admitted in the hospital due to Road Traffic Accidents (RTA) from January 1st 2014 to December 31st 2014 were traced from the nominal register maintained at casualty. The patients were then visited at their respective wards within 24 to 48 hrs of admission. Patients were explained about the study and importance of their participation in the study. Those who were willing to take part in the study were included after getting a written informed consent.
Interview was conducted both in English and local language (Tamil) according to the participants convenience. Patients were interviewed by using a pre-tested and pre-designed questionnaire containing details regarding socio demographic profile, vehicular factors, environmental factors and predisposing factors for RTA. When the condition of the patients did not permit the interview, the parents, relatives or attendants were interviewed. Total of 541 patients participated in the study. The collected data were entered in Microsoft Excel 2013 and analysed using the statistical software SPSS version 21.0 Chi square test was applied for testing difference in proportion and a p value less than 0.05 was considered statistically significant.
Institute ethics committee clearance was obtained before starting the study. Participant information sheet was given to the participants at the beginning of the interview and written consent was obtained from the participants.
RESULTS
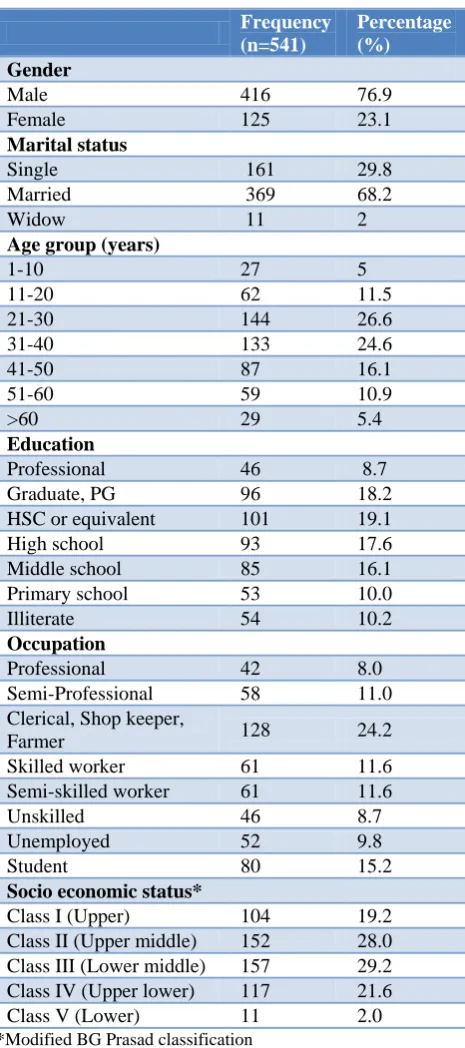
A total of 541 accident victims were included in the study out of which most of the study participants were males (76.9%), married (68.2%) and maximum number of study participants were in the age group of 21-30 years followed by 31-40 years (24.6%). 51.2% of the participants belong to the age group of 20-40 years. Regarding the educational status of the participants maximum number of participants were educated up to HSC or equivalent (19.1%), followed by graduates (18.2%), and High school (17.6%). Predominant of study participants were clerical, shop keeper and farmers (25%) followed by skilled and semi-skilled workers constituting 11.6% each. 29.2% of the accident victims belong to class III, more than half of the victims (50.8%) belong to class III or IV (Table 1).
the accident victims were either driving or riding the vehicle at the time of accident and most of the drivers (84.3%) had obtained a valid driving licence. 33% of the drivers had 6-10 years of experience in driving followed by drivers having experience of 3-5 years (30.6%). More than half of the participants (53.7%) service their vehicle once in three months followed by 31.8% of the participants servicing once in six months. About the attitude of driving, most of the drivers obey traffic rules (86.2%) and 43.6% of the drivers had tendency to overtake other vehicles (Table 2).
Table 1: Socio demographic distribution of the study participants (n=541).
Frequency (n=541)
Percentage (%)
Gender
Male 416 76.9
Female 125 23.1
Marital status
Single 161 29.8
Married 369 68.2
Widow 11 2
Age group (years)
1-10 27 5
11-20 62 11.5
21-30 144 26.6
31-40 133 24.6
41-50 87 16.1
51-60 59 10.9
>60 29 5.4
Education
Professional 46 8.7 Graduate, PG 96 18.2 HSC or equivalent 101 19.1 High school 93 17.6 Middle school 85 16.1 Primary school 53 10.0 Illiterate 54 10.2
Occupation
Professional 42 8.0 Semi-Professional 58 11.0 Clerical, Shop keeper,
Farmer 128 24.2
Skilled worker 61 11.6 Semi-skilled worker 61 11.6
Unskilled 46 8.7
Unemployed 52 9.8
Student 80 15.2
Socio economic status*
Class I (Upper) 104 19.2 Class II (Upper middle) 152 28.0 Class III (Lower middle) 157 29.2 Class IV (Upper lower) 117 21.6 Class V (Lower) 11 2.0
*Modified BG Prasad classification
Table 2: Distribution of the study participants based on the pre disposing factors of RTA.
Frequency Percentage (%)
Time of accident (n=541)
00:00 – 03:00 hrs 21 4 03:01 – 06:00 hrs 10 2 06:01 – 09:00 hrs 63 11.6 09:01 – 12:00 hrs 60 11 12:01 – 15:00 hrs 92 17 15:01 – 18:00 hrs 105 19.4 18:01 – 21:00 hrs 132 24.3 21:01 – 00:00 hrs 58 10.7
Place of accident (n=541)
Urban 154 28.5
Rural 387 71.5
Type of road (n=541)
National Highway 227 42 State highway 203 37.5 Local roads 111 20.5
Status of driving (n=541)
Drivers 376 69.5
Passengers & pedestrians 165 30.5
Possession of licence (n=376)
Yes 317 84.3
No 59 15.7
Driving experience (n=376)
<1 yr 3 0.8
1-2 yrs 20 5.3
3-5 yrs 115 30.6
6-10 yrs 125 33.2
11-15 yrs 58 15.4
16-20 yrs 10 2.7
>20yrs 21 5.6
not sure 24 6.4
Frequency of service of the vehicle (n=402)
Once in 3 months 216 53.7 Once in 6 months 128 31.8 Once in a year 28 7.0 >1 year 30 7.5
Driving attitude (n=376)
Regularly use indicator 304 80.7 Obey traffic rules 324 86.2 Tendency to overtake 164 43.6
Table 3: Distribution of participants based on various factors at the time of RTA.
Frequency Percentage (%)
Mode of transport at the time of accident (n=541)
Pedestrian 87 16.1
Bi cycle 25 4.6
Two wheeler 295 54.6 Three wheeler 6 1.1 Four wheeler 111 20.5
Bus/Lorry 17 3.1
Type of accident (n=541)
Vehicle vs Vehicle 262 48.4 Vehicle vs Objects 69 12.8 Vehicle vs Pedestrian 87 16.1
Skid 104 19.2
Toppling 19 3.5
Speed of the vehicle (n=541)
< 40 km/ hr 54 10 40–80 km/hr 301 55.6 80-100 km/hr 159 29.4 >100 km/hr 4 0.7
Not sure 23 4.3
Safety measures (n=295)
Did not wear helmet 253 85.8 Did not wear seat belt 78 70.9
No air bag 71 64
Drunk and drive (n=376) 146 38.8 Sleepy at the time of
accident 59 15.5
Reason for distraction among the study participants who admitted to be distracted (n= 52)
Using Mobile Phone 27 51.9 Looking at something else 10 19.2 Talking to other
passengers 5 9.6
Thinking about something
else 10 19.2
Weather condition (n=541)
Rainy 56 10.4
Foggy 19 3.5
Cloudy 62 11.5
Drizzling 69 12.8
Hot and clear 191 35.3 Dark and clear 144 26.6
Road condition (n=541)
Smooth 62 11.5
Satisfactory 234 43.3 Pits and holes 129 23.8
Slippery 98 18.1
Mud-covered 18 3.3
Factors favouring RTA (n= 541)
Trees too close to the road 195 36.0 No adequate signboards 182 33.6 No adequate light 177 32.7
Considering the safety measures followed by the victims most of the two wheeler riders (85.8%) did not wear helmet at the time of accident and out of the total cars involved in accident, 64% of the cars did not have airbags and 70.8% of the car drivers did not wear seat belt at the time of accident. In the present study, 38.8% of the drivers were under the influence of alcohol at the time of accident. 15.7% of the drivers admitted to be sleepy at the time of accident (Table 3).
Mobile phone was major cause of distraction (51.9%) among the driver who admitted to be distracted at the time of accident. 35% of accidents took place when the weather was hot and clear followed by 26.6% of the accidents which took place in dark and clear weather. Around 43.3% of the study participants said the road, where the accident took place was satisfactory, followed by pits and holes (23.8%) and slippery (18%). Thirty six percent of the accidents took place in the road where the trees were too close to the road and one third of the accidents occurred in roads with inadequate signboard and 32.7% of accidents took place where there was no adequate light (Table 3).
DISCUSSION
In our study we found that among the accident victims, 85.8% of the two wheeler riders did not use helmet at the time of accident and 70.9% of the car drivers did not wear seat belt at the time of accident and only 36% of the vehicles had seat belt facilities. Around 39% of the drivers were under the influence of alcohol at the time of accident. Mobile phone is the major cause of distraction (51.9%) at the time of accident.
The present study shows that majority of the accidents (59%) occurred during day time (06.00 hrs-18.00 hrs) (Table 2). A study by Ganveer et al, and Ranganathan et al, also observed that when temporal distribution of the accidents was studied, about 53.19% in the first study and 60% of the accidents in the latter study took place in the daytime (6 AM-6 PM).8,9 This is mainly because of the increased activities on road during daytime such as commercial activities, activities like attending the schools, colleges and offices. These times coincide with the period when people are more active and mobile.
tiredness after a day’s work, urgency to reach home, poor visibility due to insufficient road lighting, evening is the time where people use for meeting friend and family and also for other entertainment etc. Usually the busiest period is between 9 AM–6 PM where the majority of the people travel for work, school etc, with a sense of urgency to reach their destinations which might have lead to more number of RTAs during this period. In contrast to our study findings, Singh et al, Ghangale and Biswas et al, had shown that most (40.15%) of the RTA’s occurred in the night time.12-14 This may be due to the absence of traffic police and traffic signals, violation of traffic rules and low visibility.
In the present study 85.8% of the accident victims (Table 3) who were riding two wheeler at the time of accident did not wear helmet and 70.9% of the victims travelling in car did not were seat belt at the time of accident (Table 3). Study done by Jha et al had shown that 71% of the two wheeler riders were not wearing any protective helmet and a study conducted by Trivedi found that 88.5% did not use helmet at the time of accident.11,15 Results by Neto et al, found that 50% of motor cycle riders were not wearing helmets at the time of RTA and majority of the vehicle occupants had not worn any seatbelt. Studies in Bangalore, Nagpur (74%) and Haryana (100%) of India had also shown that drivers were not using safety measures.2,16,8,17 Most of the drivers don’t have the knowledge about safety measures and they don’t use it regularly, this may be one of the reasons for not using the safety measure at the time of RTA. The other reasons for not using safety measures may be lack of seriousness about the use, feel uncomfortable, ignorance, lack of strict implementation of legislation.
In the present study 23.8% of the victims responded that the road on which the RTA occurred was with pits and holes and 18.1% of the victims responded that the road was slippery (Table 3). Similarly study done by Gururaj G shown the presence of a road problem like ditches, road openings, road humps, slippery areas, lighting effects and others was a contributory factor in 15% of crashes.18 Singh et al had shown that majority (84.41%) of the victims responded that the road on which the RTAs took place was tarred, 12.04% of the victims reported that the road was bumpy and 3.88% of them said that the road was wet at the time of injury.12
In the present study, among the victims 38.8% of the drivers gave history of having consumed alcohol before the RTA (Table 3). While, Sreedharan in a study found that 20% of the motorcycle riders had consumed alcohol.19 Whereas, the study conducted by Singh A et al shown that 18% victims had history of alcohol consumption within 6 hrs before accident.12 In the WHO supported study done at Nepal, it was found 16.9%of the victims consumed alcohol 2 to 3 hours prior to accident.20 The reason for high percentage of drunk and drive in the present study may be due the reason that in Pondicherry, the price of alcohol is cheaper compared to the other neighbouring states. Alcohol and driving should never be
mixed. Increased use of alcohol in drivers expose them to the risk of accidents as the judgment gets impaired and control over vehicles is lost due to the effect of alcohol and other drugs. National maximum legal blood alcohol concentration is 30 mg/100 ml.21
In our study 5% of the total accident victims said that they were using mobile phone at the time of accident. The major cause (51.9%) of distraction for accident was mobile phone usage (Table 3). A study by Bener reported that 42.3% of the victims had habit of using mobile phone while driving.22 Use of mobile phone while driving vehicle is increasing which diverts the attention; it affects the reaction time and maintenance of lane, hence users may be at more risk of RTA.
Strengths of our study include that the information from the patient was collected within 48 hours following the accident thus minimizing the chance of recall bias and the primary data was collected directly from the RTA victims rather than depending solely on hospital records, which provided more valid information about the mode and type of injuries. Limitations of the study are, the information is based entirely on the data collected from victims, it may not be corroborative with actual facts regarding road traffic injury causation.As it is Hospital based study it is not representative of the exact burden of Road traffic accidents.
CONCLUSION
It is clear from the study that majority of the victims being in the productive age group, and many of them being married, places an economic burden on the family apart from the physical pain and mental suffering. Efforts need to be made in all are as concerned with Road safety, be it engineering, enforcement, education and emergency care, after all Road safety is no accident.
Recommendations
It is recommended that strict enforcement of the traffic rules by the government with penalisation of the drivers those who disobey it. Helmets should be made compulsory for all riders of bicycles, motorcycles and mopeds. Since seat belts are especially effective in motor vehicles travelling at low speed attention should be paid to the enforcement of seat belt laws on the roads. Regulating availability of alcohol in specific times can be thought of. Usage of mobile telephones while driving should be avoided. It is evident that prevention and control of most of the modifiable factors can bring about a change in the statistics that would ensure our future to be safer.
ACKNOWLEDGEMENTS
Funding: No funding sources Conflict of interest: None declared
Ethical approval: The study was approved by the Institutional Ethics Committee
REFERENCES
1. Mohan D. Road traffic injuries: a neglected pandemic. Bulletin of the World Health Organization 2003;81:684-5.
2. Gururaj G, Kolluri S, Chandramouli B, Subbakrishna D, Kraus J. Traumatic brain injury. National Med J India. 2005;61:128-33.
3. Peden M, McGee K, Sharma G. The injury chart book: a graphical overview of the global burden of injuries. Geneva: World Health Organization 2002: 5.
4. Park K. Park's textbook of Prevent Social Med; 2012: 374-82.
5. WHO. World Report on Road Traffic injury prevention. Geneva; 2006: 1-52.
6. Singh A, Goel A. Epidemiological study of non fatal road traffic accidents in Rohilkhand Region. Medico-Legal Update-An International J. 2011; 11. 7. Bureau NCR. Global status report on road safety
2013. New Delhi. 2013: 76-81.
8. Ganveer GB, Tiwari RR. Injury pattern among non-fatal road traffic accident cases: A cross-sectional study in Central India. Indian J Med Sci. 2005;59:9. 9. Ranganathan N, Gupta S, Raju M. Spatial and
temporal characteristics of accidents in a metropolitan city 1991. Proceedings of the International Conference on Traffic Safety. 1991: 27-30.
10. Rastogi R. A study of accidents in and around Kota city. Indian highways. 2006;34:5.
11. Jha N, Srinivasa D, Roy G, Jagdish S, Minocha R. Epidemiological study of road traffic accident cases: A study from South India. Indian J Community Med. 2004;29:20-4.
12. Singh A, Bhardwaj A, Pathak R, Ahluwalia S. An epidemiological study of road traffic accident cases
at a tertiary care hospital in rural Haryana. Indian J Community Health. 2012;23:53-5.
13. Ghangale A. Blunt thoracic trauma in vehicular road accidents. J Forensic Med Toxicol. 2003;20:45-9. 14. Biswas G, Verma S, Sharma JJ, Aggarwal N.
Pattern of road traffic accidents in North-East Delhi. J Forensic Med Toxicol. 2003;20:27-32.
15. Trivedi A, Rawal D. Prevalence of road traffic accidents and driving practices among young drivers. Age. 2011;61:31-9.
16. Morais Neto OLD, Malta DC, Mascarenhas MDM, et al. Risk factors for road traffic injury among adolescents in Brazil: National Adolescent School-based Health Survey (PeNSE). Ciência & Saúde Coletiva. 2010;15:3043-52.
17. Singh H, Dhattarwal S. Pattern and distribution of injuries in fatal road traffic accidents in Rohtak (Haryana). JIAFM. 2004; 26(1):74-8.
18. Gururaj G, Reddi M, Aeron Thomas A. Epidemiology of road traffic injuries in Bangalore. Proceedings of the 5th world conference on injury prevention and control. 2000: 68-77.
19. Sreedharan J, Muttappillymyalil J, Divakaran B, Haran JC. Determinants of safety helmet use among motorcyclists in Kerala, India. J Injury Violence Res. 2010;2:49.
20. Mishra B, Sinha ND, Sukhla S, Sinha A. Epidemiological study of road traffic accident cases from Western Nepal. Indian J Community Med. 2010;35:115.
21. JS M. A Compressive Textbook of Community Medicine. New Delhi: CBS Publishers & Distributors pvt Ltd; 2008: 155.
22. Bener A, Burgut HR, Sidahmed H, AlBuz R, Sanya R, Khan WA. Road traffic injuries and risk factors. Californian J Health Promotion. 2009;7:92-101.