IJEDR1801038
International Journal of Engineering Development and Research (
www.ijedr.org
)
224
The effect of polymer coating on acoustic transducer
material - design, analysis & optimization
1Raja Seshu.T., 2Swami Naidu.G. 1PG student, 2Professor & Head,
Department of Metallurgical Engineering,
JNTUK-University College of Engineering, Vizianagaram, Andhra Pradesh, India
________________________________________________________________________________________________________
Abstract – This paper aims at design the Acoustic transducer to withstand high pressures. Transducer is layered with Natural rubber, Neoprene, Nitrile rubber and Polyurethane and selects the suitable polymer among them in order to withstand high pressures. In general under sea water 1bar pressure increases to every 10 meters depth. Hence the performance of transducer varies with depth of water and pressure. The function of Acoustic transducer is receiving and sends the acoustic signal. Different types of transducers made of PZT’s (lead zirconate-titanate) and Ceramics etc are available in the market for underwater applications. Because of good acoustical properties Clay poled ceramic material has been used for transducer instead of PZT’s. As per ASTM D 3182 standards Polymer material specimen is taken and tensile strength test is conducted, and generates the stress versus strain curve. The uniaxial test data is necessary for Hyper Elastic curve fitting to evaluate the C01, C10 constants. CATIA V5R20 software is used for modeling and ANSYS 17.0 version is used for analysis. Mate lab program is used for determining stresses at other thicknesses. Among the four polymers Nitrile rubber is suitable for Acoustic transducer design to withstand high pressures.
Key words: Decoy, CATIA, ANSYS, Clay poling
________________________________________________________________________________________________________
Introduction
Acoustic transducer is a device which converts acoustic signals into electrical signal and vice versa. For underwater applications use the acoustic transducer [1] piezoelectric ceramics, polymers, single crystals and composites are the four varieties of materials used widely as acoustic transducer material [2] The strong forces and the ability to work at a high operation frequency make the piezoelectric suitable for acoustic applications [3] Crack propagation in a typical structural ceramic is accompanied by acoustic emission. two types of emission are detected, first is caused by slow growth of the fracture-initiating flaw and second is occurs due to bulk stressing [4] aligning all of the individual dipole moments in the same single direction by the process called poling. Poling is a process of subsequent heating above the Curie temperature by the application of electric field and cool below the Curie temperature. Each dipole will feel a torque in the electric field if it is not parallel to the field lines produced, and so is turned to that direction [5] rubbers and polyurethane is used as insulation material to withstand high pressures. The polyurethanes (PU) foams are widely used as insulating and core materials [6] Rubber composites have wide applications such as seals, hoses, soles and gloves. The incorporation of carbon black largely increased the tensile strength, tear strength, tensile modulus and abrasion resistance of rubber compounds [7]
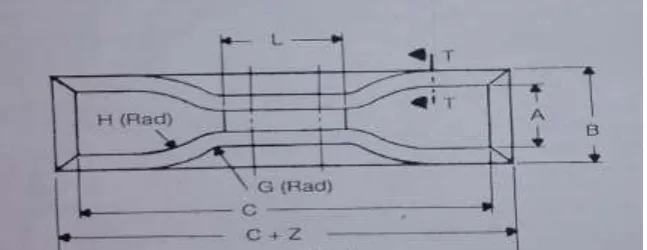
EXPERIMENTATION
The test method used to evaluate the tensile properties of Neoprene, Natural rubber and Nitrile rubber. The specimen is taken according to ASTM D 3183 standards.
IJEDR1801038
International Journal of Engineering Development and Research (
www.ijedr.org
)
225
Graph 1.2: Nitrile rubber load (N) vs Strain (%) GraphGraph 1.3: Neoprene rubber -load (N) vs Strain (%) Graph
Graph 1.4: Natural rubber -load (N) vs Strain (%) Graph
Calculations:
Calculate the tensile stress at any specified elongation as follows: T (xxx ) = F (xxx) / A
Where:
T (xxx ) = tensile stress at (xxx) % elongation, MPa
F (xxx) = force at specified elongation, MN and
A = cross-sectional area of unstrained specimen, m2.
Y ( stress ) = F (Y) / A
Where
Y ( stress )= yield stress, that stress level where the yield point occurs, MPa
F (Y) = magnitude of force at the yield point, MN
A = cross-sectional area of unstrained specimen, m2.
Evaluate the yield strain as that strain or elongation magnitude, where the rate of change of stress with respect to strain, goes through a zero value.
Calculate the tensile strength as follows: TS = F (BE) / A
Where:
TS = tensile strength, the stress at rupture, MPa
F (BE )= the force magnitude at rupture, MN , and cross-sectional area of unstrained specimen, m2
Calculate the elongation as follows: E = 100 [L – L (0)] / L (0)
Where:
E = the elongation in percent
L = observed distance between bench marks on the extended specimen, and L (0) = original distance between bench marks
Natural rubber Nitrile rubber Neoprene
Load (N) Strain % Load (N) Strain % Load (N) Strain %
IJEDR1801038
International Journal of Engineering Development and Research (
www.ijedr.org
)
226
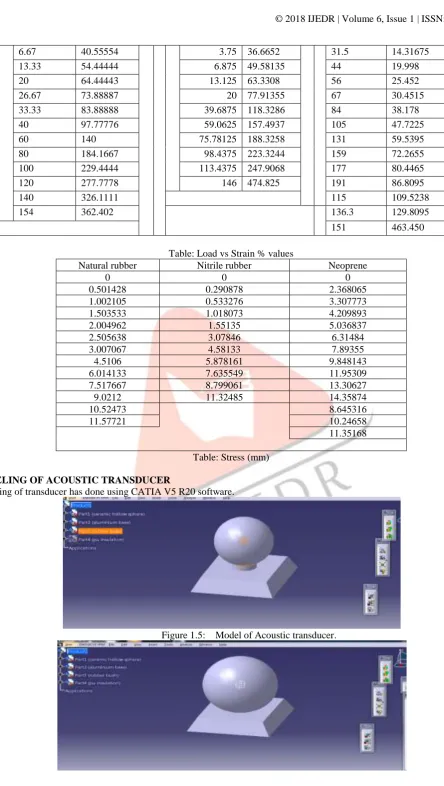
6.67 40.55554 3.75 36.6652 31.5 14.31675
13.33 54.44444 6.875 49.58135 44 19.998
20 64.44443 13.125 63.3308 56 25.452
26.67 73.88887 20 77.91355 67 30.4515
33.33 83.88888 39.6875 118.3286 84 38.178
40 97.77776 59.0625 157.4937 105 47.7225
60 140 75.78125 188.3258 131 59.5395
80 184.1667 98.4375 223.3244 159 72.2655
100 229.4444 113.4375 247.9068 177 80.4465
120 277.7778 146 474.825 191 86.8095
140 326.1111 115 109.5238
154 362.402 136.3 129.8095
151 463.450
Table: Load vs Strain % values
Natural rubber Nitrile rubber Neoprene
0 0 0
0.501428 0.290878 2.368065
1.002105 0.533276 3.307773
1.503533 1.018073 4.209893
2.004962 1.55135 5.036837
2.505638 3.07846 6.31484
3.007067 4.58133 7.89355
4.5106 5.878161 9.848143
6.014133 7.635549 11.95309
7.517667 8.799061 13.30627
9.0212 11.32485 14.35874
10.52473 8.645316
11.57721 10.24658
11.35168
Table: Stress (mm)
MODELING OF ACOUSTIC TRANSDUCER
Modeling of transducer has done using CATIA V5 R20 software.
IJEDR1801038
International Journal of Engineering Development and Research (
www.ijedr.org
)
227
Figure 1.6: Model of Acoustic transducer layered with rubberFigure 1.7: Quatre part of Acoustic transducer
To do static analysis in ANSYS APDL as axi symmetric problem it can be modeled as quarter part of the transducer.
Parameter Value
Inner diameter of hallow sphere 69 mm
Outer diameter of hallow sphere 71 mm
Height of alumina block 20 mm
Width of alumina block 100 mm
Taper angle of alumina block 26.560
Table: Design parameters of Acoustic Transducer
Finite element analysis
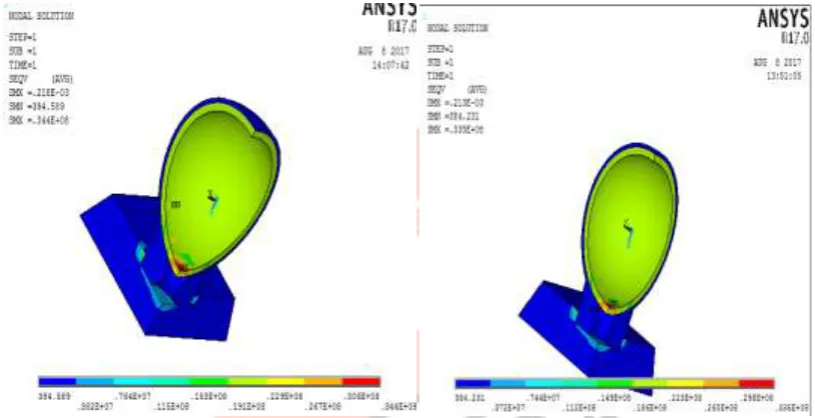
Static analysis is carried out to determine the maximum stresses at different depths using ANSYS APDL 17.0 version. ANSYS results
Stress on transducer at 200, 300, 400 ant failure (246) meters depth
Figure 1.5: Transducer at 200 m depth Figure 1.9: Transducer at 300 m depth
IJEDR1801038
International Journal of Engineering Development and Research (
www.ijedr.org
)
228
Figure 1.10: Transducer at 400 m depth Figure 1.11: Transducer at Failure (248m) depth2 mm Polymer layer Insulation
Figure 1.12: 2 mm Neoprene rubber insulation Figure 1.13: 2 mm Nitrile rubber insulation
2mm thick layer of Neoprene, Nitrile, Natural rubber and Polyurethane insulation is provided to transducer for reducing stresses and the result is shown in 1.12, 1.13, 1.14 and 1.15figures.
Figure 1.14: 2 mm Natural rubber insulation Figure 1.15: 2 mm Polyurethane insulation
IJEDR1801038
International Journal of Engineering Development and Research (
www.ijedr.org
)
229
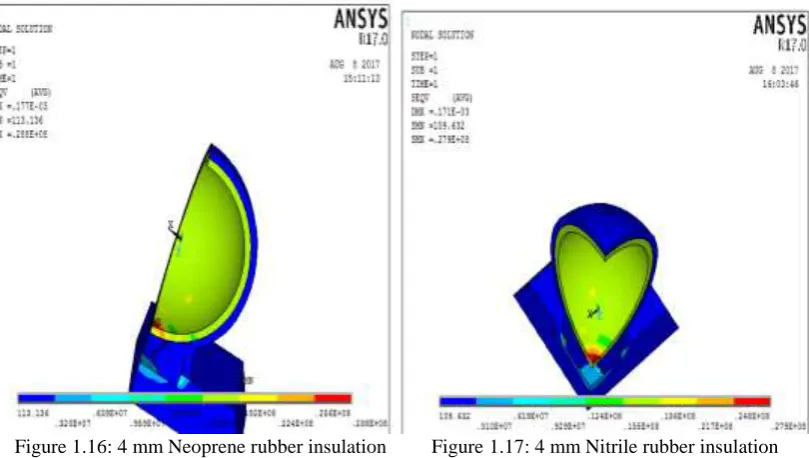
Figure 1.16: 4 mm Neoprene rubber insulation Figure 1.17: 4 mm Nitrile rubber insulation4mm thick layer of Neoprene, Nitrile, Natural rubber and Polyurethane insulation is provided to transducer for reducing stresses and the result is shown in 1.16, 1.17, 1.18 and 1.19 figures.
Figure 1.18: 4 mm Natural rubber insulation Figure 1.19: 4 mm Polyurethane insulation 5 mm Polymer layer Insulation
IJEDR1801038
International Journal of Engineering Development and Research (
www.ijedr.org
)
230
5mm thick layer of Neoprene, Nitrile, Natural rubber and Polyurethane insulation is provided to transducer for reducing stresses and the result is shown in figures.Figure 1.22: 5 mm Natural rubber insulation Figure 1.23: 5 mm Polyurethane insulation 6 mm Polymer layer Insulation
Figure 1.24: 6 mm Neoprene rubber insulation Figure 1.25: 6 mm Nitrile rubber insulation
IJEDR1801038
International Journal of Engineering Development and Research (
www.ijedr.org
)
231
Figure 1.26: 6 mm Natural rubber insulation Figure 1.27: 6 mm Polyurethane insulation8.1.6 7 mm Polymer layer Insulation
Figure 1.28: 7 mm Neoprene rubber insulation Figure1.29: 7 mm Natural rubber insulation
Figure 1.30: 7 mm Polyurethane insulation
7mm thick layer of Neoprene, Natural rubber and Polyurethane insulation is provided to transducer for reducing stresses and the result is shown in 1.25, 1.29 and 1.30.
IJEDR1801038
International Journal of Engineering Development and Research (
www.ijedr.org
)
232
Figure 1.31: 8 mm Polyurethane insulation Figure 1.32: 9 mm Polyurethane insulationBy further proceeding to 8mm and 9mm thickness of Polyurethane stress is reduced below the proof stress at 9mm thickness and the result is shown in figures 1.31, 1.32.
Figure 1.33: Deformation of Acoustic transducer at 6mm thickness.
Polymer Material
Maximum stress on the acoustic transducer at different thickness (MPa)
2mm 3mm 5mm 6mm 7mm 8mm 9mm
Nitrile rubber
33.5 27.9 24.6 20.9
Neoprene
rubber 34.4 28.8 26 24.8 21.5
Natural rubber
34.8 29.1 26.9 25 21.8
Polyurethane
35.3 33.6 29.9 28.1 21.9 23.6 20.7
Table 1.34: Stresses of Acoustic transducer at various thicknesses
The allowable stress of the ceramic transducer is 22.4 MPa. The transducer is fails at 2.6MPa pressure at 248 meters depth. Maximum stresses on ceramic transducer material are shown using bar chart.
1 MN MX X Y Z
File: C:\Users\raja seshu\AppData\Local\Temp\WB_RAJASESHU-PC_raja seshu_1544_2\ 0
.141E-04.283E-04.424E-04.566E-04.707E-04.849E-04.990E-04.113E-03.127E-03 AUG 9 2017
IJEDR1801038
International Journal of Engineering Development and Research (
www.ijedr.org
)
233
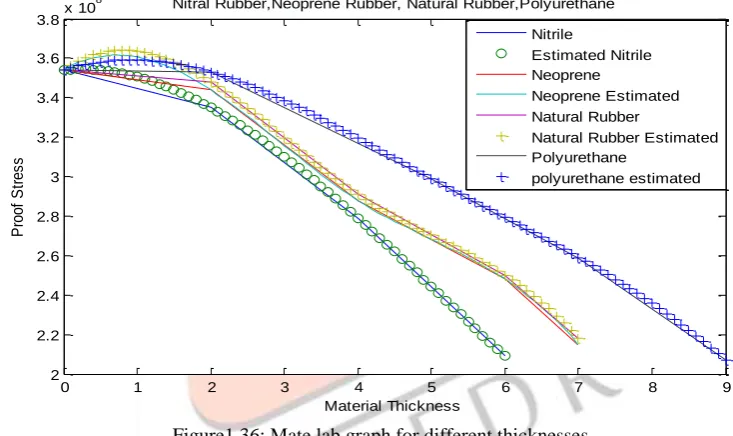
Figure 1.35: Maximum stresses on transducer for various thickness.We have got stress below the proof stress at 6mm thickness for Nitrile rubber, 21.5 MPa for Neoprene rubber at 7 mm thickness, 21.9MPa for Natural rubber and 20.7MPa for Polyurethane at 9mm thickness
Figure1.36: Mate lab graph for different thicknesses
By using mat lab program we have check maximum stresses on acoustic transducers for various polymers at different thicknesses.
Conclusion:
• It can be observed that maximum stress of the Acoustic transducer is 35.4 MPa at 400 meters depth and proof stress is 22.4 MPa so the maximum stress below the proof stress is obtained at 6mm, 7mm and 9mm thickness of Nitrile rubber, Neoprene, Natural rubber and Polyurethane respectively.
• Performance of the transducer varies with thickness of the insulation. If thickness increases impedance increases and output accuracy will reduce so we have to reduce the width of insulation layer which can capable of minimizing the stresses. By acoustic test the allowable thickness for rubber materials is 7-8 mm thickness and for Polyurethane is 9-10 mm.
• It can be concluded that Nitrile rubber at 6mm thickness insulation of transducer is best to withstand high pressures and can sustain up to 400 meters depth.
References
[1] Cheol-Ho , Yun, Nak Yong Ko, “ Design and Experiment of an Acoustic Transducer for Underwater Navigation”, 2012 [2] Huidong Li, Z. Daniel Deng and Thomas J. Carlson, “Piezoelectric Materials Used in Underwater Acoustic Transducers”, Energy and Environment Directorate, Pacific Northwest National Laboratory
[3] Zhiyuan Shen, Jingyu Lua, Chee Wee Tan, Jianmin Miao,, Zhihong Wang. “d33 mode piezoelectric diaphragm based acoustic transducer with high sensitivity”, September 2012
[4] A. G. EVANS and M. LINZER, “Failure Prediction in Structural Ceramics Using Acoustic Emission”, Vol. 56, No. 11, November 1977.
[5] L. Pardo, “Piezoelectric ceramic materials for power ultrasonic transducers”, 2015.
0 5 10 15 20 25 30 35 40
2 4 5 6 7 8 9
polyurethane
natural rubber
neoprene
nitrile rubber
0 1 2 3 4 5 6 7 8 9
2 2.2 2.4 2.6 2.8 3 3.2 3.4 3.6 3.8x 10
8 Nitral Rubber,Neoprene Rubber, Natural Rubber,Polyurethane
Material Thickness P ro o f S tr e s s Nitrile Estimated Nitrile Neoprene Neoprene Estimated Natural Rubber
Natural Rubber Estimated Polyurethane