RESEARCH
Nanosurveyor: a framework for real-time
data processing
Benedikt J. Daurer
1*, Hari Krishnan
2*, Talita Perciano
2, Filipe R. N. C. Maia
1,3, David A. Shapiro
4,
James A. Sethian
2,5and Stefano Marchesini
2*Abstract
Background: The ever improving brightness of accelerator based sources is enabling novel observations and discov-eries with faster frame rates, larger fields of view, higher resolution, and higher dimensionality.
Results: Here we present an integrated software/algorithmic framework designed to capitalize on high-throughput experiments through efficient kernels, load-balanced workflows, which are scalable in design. We describe the streamlined processing pipeline of ptychography data analysis.
Conclusions: The pipeline provides throughput, compression, and resolution as well as rapid feedback to the micro-scope operators.
Keywords: Streaming, Ptychography
© The Author(s) 2017. This article is distributed under the terms of the Creative Commons Attribution 4.0 International License (http://creativecommons.org/licenses/by/4.0/), which permits unrestricted use, distribution, and reproduction in any medium, provided you give appropriate credit to the original author(s) and the source, provide a link to the Creative Commons license, and indicate if changes were made.
Background
When new drugs are synthesized [1], dust particles are brought back from space [2], or new superconduc-tors are discovered [3], a variety of sophisticated X-ray microscopes, spectrometers, and scattering instruments are often summoned to characterize their structure and properties. High-resolution and hyperspectral X-ray imaging, scattering and tomography instruments at ern synchrotrons are among the workhorses of mod-ern discovery to study nano-materials and characterize chemical interactions or electronic properties at their interfaces.
A new generation of microscopes are being pioneered, commissioned, and planned at several US Department of Energy (DOE) user facilities [4–6] and elsewhere to achieve superior resolution and contrast in three dimen-sions, encompassing a macroscopic field of view and chemical or magnetic sensitivity, by coupling together
the brightest sources of tunable X-rays, nanometer posi-tioning, nanofocusing lenses, and faster detectors. Exist-ing soft X-ray detector technology in use at the Advanced Light Source (ALS) for example generates 350 MBytes/s per instrument [7]; commercial detectors for hard X-rays can record 6 GB/s or raw data per detector [8, 9], and a synchrotron light source can support 40 or more experi-ments simultaneously 24 hours a day. Accelerator tech-nologies such as multi-bend achromat [10] are poised to increase brightness by two orders of magnitude around the globe [11, 12]. Next generation microscopes may exploit multi-color sources, increased detector paral-lelism, increased frame rate, or stroboscopic structured illumination to extract higher-dimensional, higher reso-lution, higher frame-rate characterization of a specimen. There is a need for reducing data into meaningful images as rapidly as it is acquired, using low-cost algorithms and computational resources.
Modern synchrotron experiments often have quite complex processing pipelines, iterating through many different steps until reaching the final output. One exam-ple for such an experiment is ptychography [13–15], which enables one to build up very large images by com-bining the large field of view of a high-precision scanning
Open Access
*Correspondence: [email protected]; [email protected]; [email protected]
1 Laboratory of Molecular Biophysics, Department of Cell and Molecular
Biology, Uppsala University, Uppsala, Sweden
2 Computational Research Division, Lawrence Berkeley National
Laboratory, Berkeley, CA, USA
microscope system with the resolution provided by dif-fraction measurements.
Ptychography uses a small step size relative to the size of the illuminating beam when scanning the sample, con-tinuously generating large redundant datasets that can be reduced into a high-resolution image. Resolution of a ptychography image does not depend directly on the size or shape of the illumination. X-ray wavelengths can probe atomic and subatomic scales, although resolution in scat-tering experiments is limitated by other factors such as radiation damage, exposure, and brightness of the source to a few nanometers except in special cases (such as peri-odic crystals). To reconstruct an image of the object from a series of X-ray scattering experiments, one needs to solve a difficult phase retrieval problem, because at short wave-lengths it is only possible to measure the intensity of the photons on a detector. The phase retrieval problem is made tractable in ptychography by recording multiple diffraction patterns from overlapping regions of the object, providing redundant datasets to compensate for the lack of the phase information. The problem is made even more challenging in the presence of noise, experimental uncertainties, optical aberrations, and perturbations of the experimental geome-try which require specialized solvers and software [16–18].
In addition to its reconstruction pipeline, a ptychogra-phy experiment involves additional I/O operations such as calibrating the detector, filtering raw data, and com-municating parameters (such as X-ray wavelength, scan positions, detector distance, and flux or exposure times) to the analysis infrastructure.
Large community driven projects have developed frameworks optimized for distributed data stream pro-cessing. Map-reduce-based solutions such as Hadoop [19, 20] and Spark [21] provide distributed I/O, a unified environment, and hooks for running map and reduce operations over a cloud-based network. Other frame-works such as Flink [22], Samza [23], and Storm [24] are more tailored for real-time stream processing of tasks executing a directed acyclic graph (DAG) [25] of opera-tions as fast as possible. Workflow graphs such a Luigi [26] and Dask distributed [27, 28] provide an iterative component, but are either optimized for batch process-ing and workers are treated as a sprocess-ingular entity able to execute the DAG in its entirety.
Such frameworks target operations as a unit of tasks and generalize the notion of resources; however, the eco-system is harder to decentralize. These paradigms are not easily mappable to a production beamline environment, where processing algorithms working on data from a detector might be running on a field-programmable gate array (FPGA), the motion control system on a real-time MCU, the acquisition control on a windows operating system, and the scientist a macOS laptop. The rest of the
pipeline tasks might hop to several different architec-tures including CPUs for latency bound tasks, and GPUs for high-throughput image processing and visualization. While frameworks such as Flink along with Kafka [29] (high-throughput distributed message system) and Zoo-Keeper [30] (distributed coordination and management) can be adopted to fit the described processing environ-ment, our solution at a lower level accomplishes the same task with less computational and human resources.
Nanosurveyor is a modular framework to support distributed real-time analysis and visualization of data. The framework makes use of a modular infrastructure similar to Hummingbird [31] developed to monitor flash X-ray imaging experiments at free electron lasers (FELs) with high data rates in real time over multiple cores and nodes. Similar frameworks and pipelines have been also implemented in other research fields such as serial crys-tallography [32], cryo-electron microscopy [33], or func-tional magnetic resonance imaging [34].
Within this framework, we developed a streamlined processing pipeline for ptychography which unifies all components involved and allows scientists to monitor and quickly act upon changes along the experimental and computational pipeline.
Methods: real‑time streaming framework
Nanosurveyor was developed to provide real-time feed-back through analysis and visualization for experiments performed at synchrotron facilities, and execute a com-plex set of operations within a production environment. Its design is such that it can be effectively adapted to different beamline environments. It is built around a cli-ent–server infrastructure allowing scientists to use facil-ity resources while located at a beamline or remotely, operating on live data streamed from the beamline. Addi-tionally, one can use the Nanosurveyor user interface for off-line processing of experimental data saved on disk. In this section, we describe the resources and capabilities provided by the modular streaming infrastructure.
Terminology primer
As the streaming pipeline architecture is heavily depend-ent on a variety of resources which uses terminology more common in computational sciences, a brief primer is necessary to ensure both completeness and clarity for the rest of the paper.
• Communication: To ensure generality of the modu-lar components within Nanosurveyor, communication between modules and throughout the system is impor-tant. ZeroMQ, a communication interface [37], allows the internal architecture to communicate using common communication patterns while ensuring data are queued for processing and delivered to destination successfully. A core component of the communication interface is sockets acting as plugs between different modules.
• Event loop: Actions driven by events are at the core of Nanosurveyor. This design allows for immedi-ate response critical to a streaming pipeline. When an event such as reading occurs, the core pipeline pushes the information or metadata to the appropri-ate events waiting in the pipeline. These actions take place until no other actions need to be performed.
Modular framework
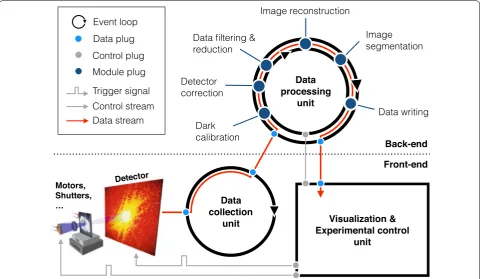
As described above, Nanosurveyor is designed to be adaptable and modular. Therefore, we designed it with a client–server infrastructure (Fig. 1) enabling scientists to
run their experiment while at the beamline or remotely from their institution. This strategy also allows the client to be very light and flexible while the server can be scaled according to the resources needed.
The Nanosurveyor infrastructure equips each module with two fundamental capabilities. First, a description format language of key-value pairs allows every module to describe its input and output. Second, it provides the ability to describe the connection between the modules, including the front-end.
The capability to connect the communication path between modules allows the end-to-end pipeline to be constructed and described seamlessly. This is done through a proxy communication layer allowing the modules to run either closely together or on com-pletely separate machines. This strategy is transparent to the beamline user and accommodates both environ-ments with centralized resources as well as those where resources are spread across a network.
Additionally, as each module in the pipeline can be executed in its own environment, Nanosurveyor provides
dynamic parallelism by allowing the user to scale the number of resources available to each step: this is done by treating each stage as a worker process that can be scaled up or down to address bottleneck or performance issues.
Software stack
The core components of the Nanosurveyor streaming software are written in Python using ZeroMQ, a high-performance messaging library [37] for network com-munication, PyQt4 [35] and PyQtGraph [36] for the graphical user interface (GUI) and visualization, and Numpy [38] together with Scipy [39] for manipulation of data arrays. For some components, we used C exten-sions in order to boost the performance to meet the demands of producing a real-time interactive tool run-ning at the beamline. With all these dependencies pre-installed, Nanosurveyor can be simply installed in the standard Python way: python setup.py install.
Python is a language with a robust and active commu-nity with libraries that are well tested, supported, and maintained. Additionally, the choice of Python allows our infrastructure to be flexible to the demands of vary-ing requirements of different processvary-ing pipelines. The ptychography pipeline (discussed in detail later in the paper) contains GPU optimized code and Python binding support easily allows the Nanosurveyor infrastructure to provide support for these types of hybrid architec-tures. The framework currently runs on Mac, Linux, and Linux-based cluster environments, and can be extended to Windows platforms depending on support for module dependencies. The core components that Nanosurveyor depends on are available on all major platforms.
Communication
A critical component in generating usable real-time pipelines relies on the communication infrastructure. This enables a clear and concise separation of the inputs and outputs at the module level. Furthermore, it defines how modules communicate from beginning to end, and ensures that tasks are load-balanced to achieve the appropriate performance characteristics of the pipeline.
The communication in Nanosurveyor uses Javascript Object Notation (JSON) [40], an industry standard way of conveying metadata between modules as well as between the front-end and back-end. The metadata pro-vides a human readable component.
ZeroMQ provides the communication backbone of the Nanosurveyor infrastructure. Using the publisher–sub-scriber model for the core components enables Nano-surveyor to provide a load-balancing scheme, which uses a backlog queue to avoid losing data when sufficient resources are not be available. The execution pipeline
creates a command port and a data port. The command port allows metadata to reach and update parameters as well as return responses to keep status requests alive and provide feedback on the current state of the running module. The data port moves data through the pipeline, running the actionable item within each module and moving the result to the output queue to be processed by the next stage of the pipeline.
Two types of configurations are required: front-end and back-end. The front-end sets up the variables necessary for each module to function while the back-end configu-ration is responsible for allocating resources, balancing the load of workers, scheduling activities, and communi-cating between modules while providing feedback to the front-end.
These two components provide the Nanosurveyor infrastructure with the information it needs to establish the relevant connections, receive and send parameters to ensure proper configuration, and introspect the state of parameters and data to provide visual feedback to the user when running through the processing pipeline.
Client–server architecture
The Nanosurveyor framework consists of an assortment of core components that ensure that the front-end pro-vides easy to use and adaptable interface while the back-end is efficient, resilient, and responsive. The individual processing modules are all based on the same structure: an event loop runs routing data from the control and data sockets, waiting for tasks, asking the handler for config-uration parameters (JSON string), and processing data (receiving/sending through the data socket).
Back‑end
The main back-end handler is running a big ZeroMQ event loop. The main task of the handler is to register the modules that run on the back-end and ensure data and control paths are appropriately connected up and run-ning. It also does the following:
• Launches all the processing modules as separate pro-cesses (single-core or MPI) and keeps track of the jobs started. This can be done with a batch process-ing system such as SLURM (or any other queuprocess-ing system) or by launching separate python processes;
• Creates the sockets for streaming pipeline, which is a list of control and data sockets communicating between the handler and all the processing modules as well as the data collector and the interface;
Data tracking
Tracking and ensuring the correctness of data is an important part of the execution pipeline. The Nanosur-veyor framework provides a module called nscxwrite which allows customized writing of files at different stages of the data acquisition pipeline (raw, filtered, and reconstructed). This capability provides several benefits, such as assurances to users that data move correctly from module to module and are not corrupted along the way, as well as an ability to debug an algorithm that is exe-cuted within a complex sequence of events.
Furthermore, the ability to save intermediate data can be enabled or disabled (for performance reasons or to reduce storage) as well as customized. The framework also comes with a standalone script called nsraw2cxi, that translates raw detector data to processed CXI files, and a script to stream simulated FCCD data through the pipeline for testing. The data format of the output files follows the CXI file format [41].
Logging
Nanosurveyor also provides a way to debug a complex pipeline through logging of both the output and error channels which includes communication between mod-ules as well as output and error that arise from within modules.
The output of all modules is piped to STDOUT and STDERR within the file system running each process ($HOME/.nanosurveyor/streaming/log/).
This is a useful tool that invokes tail -f on the piped out/err files, making it possible to monitor what is going within the individual processing modules.
Graphical user interface
For the front-end, the framework provides a versatile GUI based on PyQt4 and PyQtgraph for monitor-ing, visualizmonitor-ing, and controlling the data processed live or post-processed through the pipeline. PyQt4 (built on Qt) provides the ability to construct and modify the user interface to easily add and remove functionality while PyQtgraph provides access to advanced visuali-zation functionality for data that can be represented as images or volumes. Several common operations provided through the framework include the following:
• View the content of already processed files: inspect reconstructions from collected data and provide other useful utilities (histograms, error line plots, correlation plots, and others);
• Control and monitor the streaming: configure streaming, inspect live reconstruction, monitor per-formance (upload/download rates, status update of the streaming components);
• Simulate an experiment starting from an SEM image or similar;
• Process and inspect, through a provided interface, data from custom modules processed on the back-end (e.g., data from a ptychography or Tomography reconstruction).
Generally speaking, the design facilitates adding new modules to the GUI, e.g., a viewer for tomograms or sim-ilar. This flexibility allows the front-end to be customized for different beamline processing environments.
Finally, the architecture aims to be modular in the front- and back-end of the client–server architecture, meaning that there is a template structure for the basic features of a processing module. Additionally, in princi-ple, any given processing module can be hooked into this network (e.g., tomography, spectral analysis, or any other image analysis).
Results: streaming ptychography
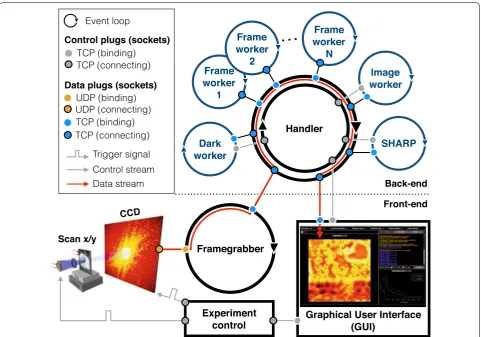
We adapted the outlined streaming framework described above for the specific needs of ptychography and are cur-rently implementing this ptychography streaming pipe-line at the beampipe-line for scanning transmission X-ray microscopy (STXM) at the ALS. The main motivation for this project is to make high-resolution ptychographic reconstructions available to the scientist in real-time. To achieve this goal, we streamlined all relevant process-ing components of ptychography into a sprocess-ingle unit. A detailed outline of our pipeline is sketched in Fig. 2.
As described in the previous sections, we follow the idea of a modular streaming network using a client– server architecture, with a back-end for ptychographic processing pipeline and a front-end for configuration, control and visualization purposes.
producing low-resolution image reconstructions and an initial estimate of the illumination function which, together with the clean diffraction frames, is then feeded as an input for the high-resolution ptychographic recon-struction worker (SHARP).
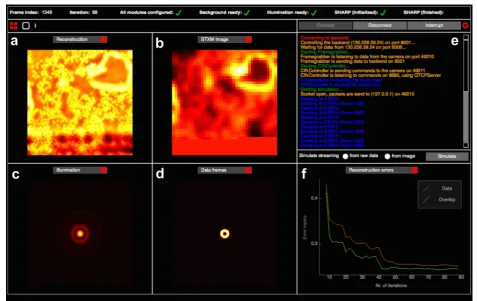
The front-end consists of a worker that reads raw data frames from a fast charge-coupled device (FCCD) [42], coordinating with a separately developed interface for controlling the experiment (such as motors and shutters) and a graphical user interface (GUI) which is used both for visualizing and controlling the ongoing reconstruc-tion. An example view of the GUI for streaming ptychog-raphy is shown in Fig. 3.
Following the data flow along the streaming pipeline, the starting trigger comes from the control interface which
initiates a new ptychographic scan providing information about the scan (step size, scan pattern, number of scan points) and other relevant information (e.g., wavelength) to the back-end handler. Simultaneously, the control sends triggers to the scanning motors and the FCCD. A typical ptychographic scan combines the accumulation of a given number of dark frames together with scanning the sample in a region of interest. The frame-grabber, already wait-ing for raw data packets to arrive, assembles the data and sends it frame-by-frame to the back-end handler. When dealing with an acquisition control system that runs inde-pendently, the handler can distinguish between dark and data frames using counters. Dark and data frames are dis-tributed to the corresponding workers. Having clean dif-fraction frames and an initial guess for the illumination
ready, the SHARP worker is able to start the iterative reconstruction process. SHARP initializes and allocates space to hold all frames in a scan, computes a decompo-sition scheme, initializes the image and starts the recon-struction process. Unmeasured frames are either set to a bright-field frame (measured by removing the sample) or their weight is set to 0 until real data are received.
Depending on the configuration, data at different states within the streaming flow can be displayed in the GUI and/or saved to a CXI file via the nscxiwrite worker module.
All components of the streaming interface run inde-pendent event loops and use asynchronous (non-block-ing) socket communication. To maximize performance, the front-end operates very close to the actual experi-ment, while the back-end runs remotely on a powerful GPU/CPU cluster.
Pre‑processing of FCCD data
We developed the following processing scheme for denoising and cleaning the raw data from the FCCD and preparing frames for the ptychographic reconstruction,
1. Define center (acquire some diffraction frames and compute the center of mass if needed). This is needed for cropping, and to deal with beamstop transmis-sion;
2. Average dark frames: we first acquire a sequence of frames when no light is present, and compute the average and standard deviation of each pixel and readout block. We set a binary threshold to define bad (noisy) pixels or bad (noisy) ADC channels, when the standard deviation is above a threshold or if the standard deviation is equal to 0;
3. Remove offset using the overscan linear or quadratic offset: stretch out the readout sequence in time and fit a second order polynomial over the overscan; 4. Identify the background by thresholding;
5. Perform a Fourier transform of the readout sequence of the background for each channel, remove high frequency spikes by thresholding, and subtract from data;
6. Threshold signal below 1 photon; 7. Divide by beamstop transmission; 8. Crop image around center;
9. Downsample: take a fast Fourier transform (FFT), crop or multiply by a kernel (e.g., Gaussian) and take inverse fast Fourier transform (IFFT).
Simulation
For testing the functionality and performance of the streaming ptychography pipeline as well as exploring different configurations, we developed a protocol that simulates an entire ptychography scan. Using a simu-lated illumination from a Fresnel Zone Plate (FZP) and basic scan parameters (number of scan points, the scanning step size, the scanning pattern), diffraction patterns from a well-known test sample are calculated in the same raw data format as those generated by the FCCD. As a last step, Poisson noise and a real back-ground are added to the data. These raw data packets together with the simulated metadata are introduced to the end-to-end streaming pipeline and produce outputs as shown in Fig. 3.
One major benefit of this feature is the ability to scale and test the pipeline at different acquisition rates and therefore be able to provide performance metrics on the behavior of a sequence of algorithms enabling developers to further improve their execution pipeline.
In a simple performance test, we simulated a 40 × 40 scan producing 1600 raw data frames which were sent by a virtual FCCD at a rate of 10 Hz. At the end of the pipe-line, we observed a complete reconstructed image after around 5 min. This translates into a streamlining pipe-line rate of about 2 Hz, with most of the time spent on filtering and cleaning the individual frames. A significant portion of the pre-processing time is unique to the FCCD pipeline. While this rate is still far from ideal, it can be easily be sped up and scaled by using parallel execution, load-balancing strategies, and eventually through high-throughput GPU optimizations. With further improve-ments on the performance on the individual components as well as optimization of the network communication, we expect a substantial increase of the processing rate.
Experimental data
Experimental data produced by the FCCD can involve missing frames, corrupted frames, and timing issues between different hardware and software components. In addition, the correct choice parameter values for the ptychographic reconstruction might be inherent to the data itself and can thus carry from experiment to experi-ment. To make Nanosurveyor more robust for such cases, it is desirable to expose configuration parameters as a runtime or heuristic feature rather than determined them at execution time, and take a more data-based approach where options are set based on feature detection.
Discussion
Performance considerations and additional limitations must be understood and considered in integrating such an execution pipeline in a production environment. While the following list is not comprehensive, in building this environment, we have considered the following:
• Limits (performance, algorithm, memory, disk) to software and hardware need to be considered. The Nanosurveyor infrastructure provides logging sup-port while the ZeroMQ publisher–subscriber model allows a stuck or crashed process to be replaced with another. The current solution Nanosurveyor can be made more robust and this is work that is considered as active and ongoing;
• Hardware failures are inevitable in a production environment involving machinery. Recovery from these types of issues requires customization for each beamline environment. Within Nanosurveyor, there is a heartbeat for each module and a base mechanism within the framework to inform the user that a fail-ure (or multiple failfail-ures) might have occurred;
• Interrupting experiments should be a core use case of any real-time feedback loop when trying to get an understanding of the data as quickly as possi-ble. Once information about the material is flow-ing through the computational pipeline, it is valu-able to be valu-able to determine if an experiment is, in fact, failing or uninteresting. This can occur in many ways such as wrong setup, wrong material, or wrong region of scanning. For these scenarios, it is prudent for a working pipeline to be able to abort, clear out the pipeline, and reset itself;
• Expensive operations and algorithms executed in a beamline operating environment may have varying degrees of performance characteristics. These char-acteristics can often slow down the overall pipeline if any one of the operations is inefficient. Nanosur-veyor attempts to get around this issue in two ways: first, it allows for a load-balancing approach where more workers can be added to the expensive stages of the pipeline. Second, using the ZeroMQ queue, the beamline can still operate with the slowdown and backlog while ensuring that the pipeline can continue to function, at least until hardware memory runs out. This issue can also be mitigated by evaluating the performance of the module and if possible optimiz-ing the algorithm as well;
extract-ing or identifyextract-ing important information earlier to reduce size and complexity.
• For current 2D and 3D visualization requirements, it is sufficient to use PyQtGraph. However, if the data volume gets large enough such that it would be dif-ficult to view raw output, visualization frameworks supporting distributed rendering strategies could be used. More advanced approaches such as adaptive downsampling, compression, or other visualization representations could be swapped into the pipeline if needed.
Conclusions and future work
This work introduced Nanosurveyor—a framework for real-time processing at synchrotron facilities. The infra-structure provides a modular framework, support for load-balancing operations, the ability to run in a distrib-uted client–server mode, and gives feedback on each stage of a complex pipeline.
The framework was adapted to support streamlined pipelines for ptychography. In this case, expensive stages such as pre-processing are load-balanced with multi-ple workers, and image reconstruction are parallelized over MPI to compute efficiently in a distributed manner. Results from every stage of the pipeline are then trans-mitted to the front-end, providing users at the beamline comprehensive knowledge of the experiment and of how the data are transformed from start of acquisition to end output. Although the Nanosurveyor framework provides several core capabilities that are necessary for operating at typical beamlines, there are several key advances that we are currently working on to make the computational pipe-line complete. A couple of highlights include the following:
Iterative execution, instrument control Adding support for controlling the beamline itself will complete the cur-rent pipeline and provide an iterative execution loop enabling future pipelines to adaptively acquire and ana-lyze data from the operating beamline, and automati-cally request more data when necessary. For example, if the reconstruction detects bad frames, or that the sam-ple has drifted, then more frames can be automatically requested on the fly without interrupting the overall experiment. If the reconstruction determines that part of the image being acquired is empty or uninteresting it could request fewer frames and focus on the relevant part of the sample.
Optimizing pipeline execution Currently, communication occurs over ZeroMQ providing many benefits, including dealing with backlog, automated load-balancing, and the ability to interleave work running different stages of the execution pipeline. We are also investigating ways to fuse
modules to optimize execution times. Making communi-cation agnostic by using handles enables efficient use of memory optimization strategies, socket communication, or saving on data movement costs, e.g., transferring data between GPU-based modules by moving a pointer rather than copying data.
In conclusion, we have presented a framework that is built to run at modern beamlines, can handle the geo-graphic considerations between users and experiments running at synchrotron facilities, and supports real-time feedback. These features, along with the modular design, provide a foundation that can be extended and readily deployed on many of the beamlines in use today.
Authors’ contributions
BJD, HK, TP, FM, and SM designed and implemented the real-time streaming framework. BJD, HK, TP, JAS, and SM wrote the manuscript with contributions from all. DAS translated the pre-processing code from matlab to python and helped us testing the streaming ptychography framework at the ALS. All authors read and approved the final manuscript.
Author details
1 Laboratory of Molecular Biophysics, Department of Cell and Molecular
Biol-ogy, Uppsala University, Uppsala, Sweden. 2 Computational Research Division,
Lawrence Berkeley National Laboratory, Berkeley, CA, USA. 3 NERSC, Lawrence
Berkeley National Laboratory, Berkeley, CA, USA. 4 Advanced Light Source,
Lawrence Berkeley National Laboratory, Berkeley, CA, USA. 5 Department
of Mathematics, University of California, Berkeley, Berkeley, CA, USA.
Acknowledgements
The authors would like to thank John Joseph, the STXM control team, Susan James, and the LBL IT group for their support.
Competing interests
The authors declare that they have no competing interests.
Availability of data and materials
Further information about Nanosurveyor is available at http://www.camera.lbl. gov/software or upon request to [email protected].
Funding
This work was partially funded by the Center for Applied Mathematics for Energy Research Applications, a joint ASCR-BES funded project within the Office of Science, US Department of Energy, under Contract Number DOE-DE-AC03-76SF00098, by the Swedish Research Council and by the Swedish Foundation for Strategic Research. The Advanced Light Source is supported by the Director, Office of Science, Office of Basic Energy Sciences, of the US Department of Energy under Contract No. DE-AC02-05CH11231.
Received: 23 September 2016 Accepted: 18 January 2017
References
1. Cavalier, M.C., Pierce, A.D., Wilder, P.T., Alasady, M.J., Hartman, K.G., Neau, D.B., Foley, T.L., Jadhav, A., Maloney, D.J., Simeonov, A., et al.: Covalent small molecule inhibitors of ca2+-bound s100b. Biochemistry 53(42), 6628–6640 (2014)
2. Westphal, A.J., Stroud, R.M., Bechtel, H.A., Brenker, F.E., Butterworth, A.L., Flynn, G.J., Frank, D.R., Gainsforth, Z., Hillier, J.K., Postberg, F., et al.: Evidence for interstellar origin of seven dust particles collected by the stardust spacecraft. Science 345(6198), 786–791 (2014)
4. Nazaretski, E., Huang, X., Yan, H., Lauer, K., Conley, R., Bouet, N., Zhou, J., Xu, W., Eom, D., Legnini, D., Harder, R., Lin, C.-H., Chen, Y.-S., Hwu, Y., Chu, Y.S.: Design and performance of a scanning ptychography microscope. Rev. Sci. Instrum. 85(3), 033707 (2014). doi:10.1063/1.4868968
5. Winarski, R.P., Holt, M.V., Rose, V., Fuesz, P., Carbaugh, D., Benson, C., Shu, D., Kline, D., Stephenson, G.B., McNulty, I., et al.: A hard X-ray nanoprobe beamline for nanoscale microscopy. J. Synchrotron Radiat. 19(6), 1056–1060 (2012)
6. Shapiro, D., Roy, S., Celestre, R., Chao, W., Doering, D., Howells, M., Kevan, S., Kilcoyne, D., Kirz, J., Marchesini, S., et al.: Development of coherent scattering and diffractive imaging and the cosmic facility at the advanced light source. In: Journal of Physics: Conference Series, vol. 425, pp. 192011. IOP Publishing, Bristol (2013)
7. Doering, D., Chuang, Y.-D., Andresen, N., Chow, K., Contarato, D., Cum-mings, C., Domning, E., Joseph, J., Pepper, J.S., Smith, B., Zizka, G., Ford, C., Lee, W.S., Weaver, M., Patthey, L., Weizeorick, J., Hussain, Z., Denes, P.: Development of a compact fast ccd camera and resonant soft X-ray scat-tering endstation for time-resolved pump-probe experiments. Rev. Sci. Instrum. 82(7), 073303 (2011). doi:10.1063/1.3609862
8. Broennimann, C., Eikenberry, E.F., Henrich, B., Horisberger, R., Huelsen, G., Pohl, E., Schmitt, B., Schulze-Briese, C., Suzuki, M., Tomizaki, T., Toyokawa, H., Wagner, A.: The pilatus 1 m detector. J. Synchrotron Radiat. 13(2), 120–130 (2006). doi:10.1107/S0909049505038665
9. Dinapoli, R., Bergamaschi, A., Henrich, B., Horisberger, R., Johnson, I., Mozzanica, A., Schmid, E., Schmitt, B., Schreiber, A., Shi, X., et al.: Eiger: next generation single photon counting detector for X-ray applications. Nucl. Instrum. Methods Phys. Res. Sect. A: Accel. Spectrom. Detect. Assoc. Equip. 650(1), 79–83 (2011)
10. Eriksson, M., Al-dmour, E., Ahlbäck, J., Andersson, Å., Bocchetta, C., Johans-son, M., Kumbaro, D., Leemann, S., Lilja, P., Lindau, F., et al.: The max iv facility. In: Journal of Physics: Conference Series, vol. 425, pp. 072008. IOP Publishing, Bristol (2013)
11. Almer, J., Chupas, P., Stephenson, B., Tiede, D., Vogt, S., Young, L., Evans, P., Parise, J., Suter, B.: Emerging opportunities in high-energy X-ray science: The diffraction-limited storage ring frontier. Synchrotron Radiat. News
29(1), 12–13 (2016). doi:10.1080/08940886.2016.1124675
12. Reich, E.S., et al.: Ultimate upgrade for us synchrotron. Nature 501(7466), 148–149 (2013)
13. Rodenburg, J.M.: Ptychography and related diffractive imaging methods. Adv. Imag. Electron Phys. 150, 87–184 (2008)
14. Rodenburg, J.M., Hurst, A.C., Cullis, A.G., Dobson, B.R., Pfeiffer, F., Bunk, O., David, C., Jefimovs, K., Johnson, I.: Hard-X-ray lensless imaging of extended objects. Phys. Rev. Lett. 98, 034801 (2007). doi: 10.1103/Phys-RevLett. 98.034801
15. Thibault, P., Dierolf, M., Menzel, A., Bunk, O., David, C., Pfeiffer, F.: High-resolution scanning X-ray diffraction microscopy. Science 321(5887), 379–382 (2008). doi:10.1126/science.1158573
16. Nashed, Y.S.G., Vine, D.J., Peterka, T., Deng, J., Ross, R., Jacobsen, C.: Parallel ptychographic reconstruction. Opt. Express 22(26), 32082–32097 (2014). doi:10.1364/OE.22.032082
17. Enders, B., Thibault, P.: A computational framework for ptychographic reconstructions. Proc. R. Soc. A 472, 2196 (2016)
18. Marchesini, S., Krishnan, H., Daurer, B.J., Shapiro, D.A., Perciano, T., Sethian, J.A., Maia, F.R.N.C.: SHARP: a distributed GPU-based ptycho-graphic solver. J. Appl. Crystallogr. 49(4), 1245–1252 (2016). doi:10.1107/ S1600576716008074
19. Hadoop, A. http://hadoop.apache.org (2016). Accessed 9 Sept 2016 20. White, T.: Hadoop: The Definitive Guide, 1st edn. O’Reilly Media, Inc.
,Sebas-topol (2009)
21. Zaharia, M., Chowdhury, M., Franklin, M.J., Shenker, S., Stoica, I.: Spark: cluster computing with working sets. In: Proceedings of the 2nd USENIX conference on Hot topics in cloud computing, p. 10, Boston, 22–25 June 2010
22. Apache Flink. http://flink.apache.org (2016). Accessed 9 Sept 2016 23. Apache Samza. http://samza.apache.org (2016). Accessed 9 Sept 2016 24. Apache Storm. http://storm.apache.org (2016). Accessed 9 Sept 2016 25. Jensen, F.V.: An introduction to Bayesian networks vol. 210. UCL press,
London (1996)
26. Luigi: A workflow engine in Python. https://luigi.readthedocs.io/en/stable (2016). Accessed 9 Sept 2016
27. Dask Development Team: Dask: Library for Dynamic Task Scheduling. http://dask.pydata.org (2016). Accessed 9 Sept 2016
28. Rocklin, M.: Dask: parallel computation with blocked algorithms and task scheduling. In: Huff, K., Bergstra, J. (eds.) Proceedings of the 14th Python in Science Conference, pp. 130–136 (2015)
29. Apache Kafka. http://kafka.apache.org (2016). Accessed 9 Sept 2016 30. Apache ZooKeeper. http://zookeeper.apache.org (2016). Accessed 9 Sept
2016
31. Daurer, B.J., Hantke, M.F., Nettelblad, C., Maia, F.R.: Hummingbird: monitor-ing and analyzmonitor-ing flash X-ray imagmonitor-ing experiments in real time. J. Appl. Crystallogr. 49(3), 1042–1047 (2016)
32. Barty, A., Kirian, R.A., Maia, F.R.N.C., Hantke, M., Yoon, C.H., White, T.A., Chap-man, H.: Cheetah: software for high-throughput reduction and analysis of serial femtosecond X-ray diffraction data. J. Appl. Crystallogr. 47(3), 1118–1131 (2014). doi:10.1107/S1600576714007626
33. Fernandez-Leiro, R., Scheres, S.: A pipeline approach to single-particle processing in relion. bioRxiv (2016). doi:10.1101/078352
34. Eklund, A., Dufort, P., Villani, M., LaConte, S.: Broccoli: software for fast fmri analysis on many-core cpus and gpus. Front. Neuroinformatics 8, 24 (2014). doi:10.3389/fninf.2014.00024
35. Riverbank Computing. http://www.riverbankcomputing.com/software/ pyqt (2016). Accessed 9 Sept 2016
36. Campagnola, L.: http://pyqtgraph.org (2016). Accessed 9 Sept 2016 37. Hintjens, P.: ZeroMQ: messaging for many applications. “ O’Reilly Media,
Inc.”, Sebastopol (2013)
38. van der Walt, S., Colbert, S.C., Varoquaux, G.: The numpy array: a structure for efficient numerical computation. Comput. Sci. Eng. 13(2), 22–30 (2011). doi:10.1109/MCSE.2011.37
39. Jones, E., Oliphant, T., Peterson, P., et al.: SciPy: open source scientific tools for Python. [Online]. http://www.scipy.org/ (2001). Accessed 7 April 2016 40. ECMA international. http://www.ecma-international.org/publications/
standards/Ecma-404.htm (2016). Accessed 9 Sept 2016
41. Maia, F.R.N.C.: The coherent X-ray imaging data bank. Nat. Methods 9(9), 854–855 (2012). doi:10.1038/nmeth.2110