Takafumi Nakagawa · Masamitsu Ohta
Collapsing process simulations of timber structures under dynamic loading
II: simplification and quantification of the calculating method
Received: July 25, 2002 / Accepted: December 2, 2002
Abstract In a previous paper we presented the efficacy of
the extended distinct element method (EDEM) on the col-lapsing process simulation of timber-frame structures. The results obtained were qualitative, and the need for quantita-tive simulation was pointed out. In this report, we improved our simulating programs with the aim of establishing a quantitative simulation by EDEM. For this purpose, the parameters of the frame members (beam or column) were determined by comparing the simulated results of four-point bending tests with experimental results. Other param-eters of plywood and joint members were determined by simulations of two rail shear and slip tests of joint parts, respectively. Using these parameters we made simulations of the collapsing process of an actual-size plywood-sheathed wall and at the same time carried out the experiments under similar conditions. Simulated load–dis-placement curves of the plywood-sheathed wall were simi-lar to those obtained in the experiments, and the sequence of failure at nailed joints of the simulation model gave good agreement with that of the experimental collapsing pro-cesses. Using these processes, we believe that we estab-lished a basic quantitative simulation method to test the collapsing process of timber-frame structures.
Key words Shear wall · Distinct element method ·
Computer simulation · Timber-frame structure
Takafumi Nakagawa (*)· Masamitsu Ohta
Graduate School of Agricultural and Life Sciences, The University of Tokyo, 1-1-1 Yayoi, Bunkyo-ku, Tokyo 113-8657, Japan Tel. 81-3-5841-5253; Fax 81-3-5684-0299
e-mail: [email protected]
Part of this paper was presented at the 52nd Annual Meeting of the Japan Wood Research Society, Gifu, April 2002; and at the 7th World Conference of Timber Engineering, Malaysia, August 2002
Introduction
To improve the performance of wooden structures, it is important to know the fracture behavior of the structures under various loading conditions. For this purpose, the establishment of a simulating method to explore the frac-turing process is desirable.
In our previous report1
we developed a simulating method based on the extended distinct element method (EDEM). There, we made three-dimensional simulations for two-story frame construction models and obtained good simulated results that correspond to the experimental one qualitatively. To obtain a quantitative output from the simulation, however, it was pointed out that the relations between the parameters of spring elements and actual mechanical properties need clarification.
In this study we examined the parameters of EDEM spring elements needed to obtain quantitative results. We also tried to reduce the number of elements of structural members and joint parts in the simulation model for the convenience of large-scale simulation models that corre-spond to actual wooden houses.
Theory
As the principle of EDEM was precisely explained in our previous report,1
we explain only the modified points here. For analysis of the whole structure it is desirable to reduce the number of elements used in the calculation. In our previous report, frame members consisted of four particle elements in the cross section connected by eight spring elements, including diagonal springs. Thus, it was difficult to develop our models based on the large-scale model, as it would require large memories and long calculating times.
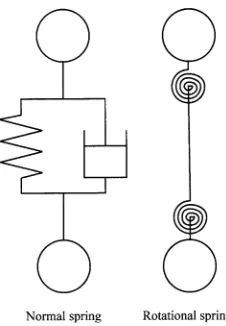
moment, we employed a rotational spring instead of shear springs and a diagonal configuration of springs. By this simplification of the spring configuration, we lost the possi-bility of treating the material orthotopically; but in frame structures the anisotropy of the frame members is generally not so important.
The EDEM elements in this report are depicted in Fig. 2. The normal spring connects particle elements in the normal direction, and the rotational spring works against the rela-tive rotation. Figure 3 shows the forces generated by the rotational spring following movement of particle element B from the original point i to i. The EDEM calculation was made under the following theoretical concepts.
The motion of particle element i having the mass m is expressed as follows
Fi Fni Fsi (1)
md
dt C
d dt
i i
i
2
2 0
u u
F
(2)
where Fni represents the forces from normal springs; Fsi is the sum of all forces generated by the relative rotation against adjacent particle elements; Fi is the sum of all forces acting on the particle elements; C is the coefficient of vis-cous damping; and ui is the displacement vector.
The accelerations of the element in x- and y-directions are then obtained by the following relations
d x dt
F m
d y dt
F m
it xit it yit
2
2
2
2
, (3)
where Fxit and Fyit are the components of the forces acting on element i at time t. Velocities and displacement increments of element i during time increment ∆t are obtained by the
numerical integration of these equations.
Following this calculation, we can obtain the coordinates of all particle elements consecutively; thus, we can follow every step of the fracturing process in a computer. The panel members were made up as a lattice sheet of particles that connected each other in the horizontal, vertical, and diagonal directions by spring elements (Fig. 1b).
Determining method of the spring parameters
In our previous report, the EDEM parameters were deter-mined by the characteristic data of frame members (e.g., modulus of elasticity, cross-sectional area, density) deduc-tively. However, simulated mechanical values by this method were different from the actual ones, and the results obtained had rather poor value from a practical viewpoint. Therefore, we tried to adjust the induced stress and defor-mation of the EDEM model to the corresponding experi-mental results at the frame or panel member levels, relating them using the following methods.
Spring parameters of frame members
We defined spring parameters of frame members by carry-ing out simulations of four-point bendcarry-ing tests, shown in Fig. 4. As EDEM is a dynamic analysis, it requires many cycles of calculation to obtain a convergent solution by the simulation model, as shown in Fig. 5a. The load– displacement curves of each spring parameter can be ob-tained by changing the loading weight (Fig. 5b). From these curves we obtained a relational equation between the bend-ing modulus of elasticity (MOE) and the parameter of rota-tional spring Ks as follows
Ks
(
N m)
kb MOE GPa(
)
(4)where kb is a constant. For the frame member of 10
10 cm cross-sectional area, kb is 2.03 10 4
. The parameters
Fig. 1. Modeling of structural components by particle elements and
spring elements
Fig. 2. Spring elements
Fig. 3. Forces that act on the rotational spring. A, B, C, particle
of a normal spring is defined as: MOE cross-sectional area.
Spring parameters of panel members
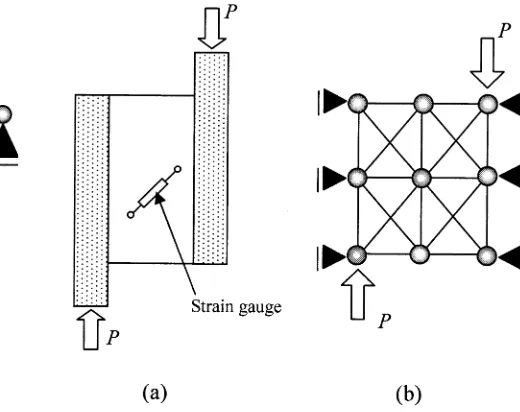
We defined the parameters for spring elements of the panel members by simulations of the two-rail shear test, as shown in Fig. 6. The same procedure as in the preceding section was carried out to obtain load–displacement curves. As a result, the following relational equation between the shear modulus G and the parameter for a normal spring Kn was
obtained
Kn
(
N m)
kg G GPa(
)
(5)where kg is a constant. For plywood of 8.9 mm thickness, kg
is 5.2 104
.
Springs parameters of nailed joints
Spring parameters of the nailed joint were determined by the results of single shearing tests. We approximated load– displacement curves of the shear tests under monotonic loading by trilinear curves and adapted them to the nonlin-ear spring of nailed joints in our simulation models (Fig. 7). Representative data for the CN50 nail corresponding to this curve are shown in Table 1.
Spring parameters of joints between frame members
Spring constants of the joints between frame members were determined by approximating load–displacement curves of
experimental results under monotonic loading reported in the literature,2,3
where the characteristic values for the me-chanical properties of the joint part between sill/beam and column with a hold-down fastener (type S-HD20), a corner fastener (type CPT), and a clamp iron (type C120) were reported. Considering embedment, the parameters for the
Fig. 4. Simulation of the four-point bending test
Fig. 5. Method to determine bending rigidity. a Transition of
deflec-tion by extended distinct element method (EDEM) calculadeflec-tion. b simulated load–deflection relation
Fig. 6. Simulation of two-rail shear test. a Schema of two-rail shear
experiment. b EDEM model of two-rail shear test
Fig. 7. Nonlinear relation between load and displacement for the
nailed joint springs. P1, P2, P3, D1, D2, and D3 are the specific values on the envelope curve of the tension side (see Table 1)
Table 1. Representative data in the load–displacement curves of
nailed joints in the simulation with type CN50
Parameter Result
Load (kN)
P1 0.75
P2 1.75
P3 1.25
Displacement (mm)
D1 0.6
D2 15.0
Fig. 8. Nonlinear relation between load and displacement for the joint
springs at the joints between frame members. P1, P2, P3, D1, D2, D3 (see Fig. 7). P4, P5, D4, D5, specific values on the envelope curve of compres-sion side (see Table 2)
Fastener type Load (kN) Displacement (mm)
P1 P2 P3 P4 P5 D1 D2 D3 D4 D5
S-HD20 21.5 41.4 40.0 12.0 25.0 5.19 25.0 40.0 2.00 16.0
CPT 8.16 14.2 10.00 12.0 25.0 0.690 10.0 30.0 2.00 16.0
C120 3.20 8.50 6.00 12.0 25.0 0.500 13.0 18.0 2.00 16.0
S-HD20, hold-down fastener; CPT, corner fastener; C120, iron clamp Data are from Ohno et al.,2 Nagaoka et al.,3 and Inayama4
compression side were determined using the experimental results under monotonic loading reported in the literature.4
Combining two curves obtained from monotonic loading tests reported in the literature, the load–displacement curve of this joint spring is shown in Fig. 8. Representative data corresponding to the curve of Fig. 8 are shown in Table 2.
The value of the damping coefficient C in Eq. 2 was obtained using the following equation5
C 2h mk (6)
where h is the damping factor; and k is a spring constant.
Fracture condition
In the EDEM calculation, the fracture condition is gener-ally defined by the concept of the maximum deformation theory as follows
Dij Lij (7)
where Dij is the distance between the particle elements i and
j; and Lij is maximum displacement of nailed joints or frame
joints in experiments. Lij corresponds to the displacement
D3 in Figs. 7 and 8. If these fracture conditions are satisfied
at any step of the EDEM calculation, spring elements connecting the relating two elements to each other are eliminated.
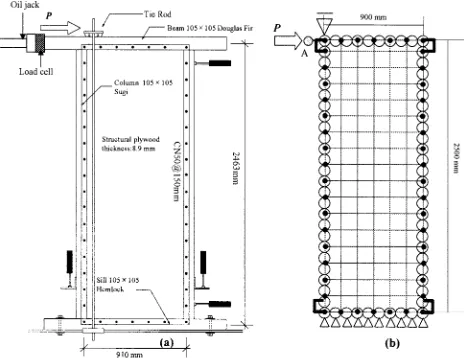
Fig. 9. Specimen and simulation model of the shear test. a schema for
the experimental specimen. b EDEM model (only main elements are shown). Heavy black dots, nailed position; A loading point; heavy U lines, position of the C120 iron clamp
Evaluation of the EDEM simulation by the sheathed
shear wall test
Shear experiments of a simple wood-framed shear wall with plywood sheathing were carried out to verify the validity of our method to deterdmine EDEM parameters. We con-ducted the EDEM simulation under similar conditions.
Specimens and experimental method
model was 900 2500 mm. The modulus of elasticity of frame members was set at 7.5 GPa, and the shear modulus of the panel member was set at 0.5 GPa. To simulate tie-rod system behavior, the upstroke movement of the top left side element was limited by a roller. The reaction force of the model panel was estimated to be the force induced in the normal spring between the top left element and the loading (point A in Fig. 9b), which was added for the convenience of calculation. Nailed points by CN50 nails were modeled by nonlinear joint springs, and the positions are indicated in Fig. 9b. As the loading is monotonic in our experiment, the same load–displacement relation shown in Fig. 7 was used for all nailed joints. The column and beam/sill were con-nected by a joint spring simulating a C120 iron clamp. The time increment for a single calculating cycle was 1.0 105
s. Loading was done under monotonic loading until displacement reached 200 mm. The calculated cycles num-bered two million.
Results and discussion
Load–displacement curves
Figure 10 shows load–displacement curves of the shearing tests of shear walls and that of our simulation. It is apparent that the shapes of these curves are similar. Table 3 shows characteristic values for four experiments and the simula-tion. These values were calculated from the load–actual shear deformation angle relation based on Japanese struc-tural design guidelines.6
The averages of experimental val-ues showed good agreement with the simulated result. Here, the structural characterization factor (Ds) indicates the reducing ability of the shearing force by the elastoplastic deformation of the structure. It is defined by the following equations
Ds P
P
u
y y
u
1
2µ 1 µ
δ δ
, (8)
where δu and Py are yield displacement and yield load, respectively; δu is the ultimate displacement, which corre-sponds to the point that the load decreased to 80% of the
Py
δ δ
2 0
Ë Á
¯
˜
Ú
(
)
Symbols used here are depicted in Fig. 11.
Table 3. Characteristic values for the specimens of shearing tests of shear walls
Parameter Experiment Simulated
1 2 3 4 Ave. SD
values
Pmax (kN) 10.2 10.6 10.4 9.79 10.3 0.355 10.5
Py (kN) 2.23 3.39 3.00 1.95 2.64 0.667 3.32
Pu (kN) 8.67 8.78 9.22 8.95 8.90 0.242 8.92
P1/150 (kN) 6.00 6.11 7.19 5.58 6.22 0.684 5.64
Ds 0.234 0.254 0.239 0.244 0.243 0.009 0.240
Pmax, maximum load; Py, yield load; Pu, ultimate load of perfect elastoplastic model; P1/150, load at shear deformation of 1/150 rad; Ds, structural characterization factor; 1–4, specimen codes
Fig. 10. Comparison of experimental and simulated results of the
shearing tests of shear walls
0.8 Pmax Pmax
Fig. 11. Definitions for calculating structural characterization factors.
The Ds value is postulated to be used under cyclic load-ing conditions, but we adapted it to our experimental results and simulated one under monotonic loading. The Ds value obtained from experimental results agrees with the simu-lated value. Thus, it was found that the ductility of shear walls was also simulated well by this method.
Sequence of failure
Figure 12 shows the sequence of failure at nailed joints and shear deformation of nails. At first, failure occurred in the nailed joint at the lower right-hand corner of the simulation models, after which the failures spread to adjacent nailed joints. After all the nailed joints of the right side column were broken, failures developed at the sill and beam. Gen-erally, it is difficult to formulate the failure of nailed joints in the actual experiments because failure patterns of nailed joint are various (e.g., punching out, pull out, cutoff of nail). Despite that, the fracture sequence of the model simulation
bers are the sequence of the failure
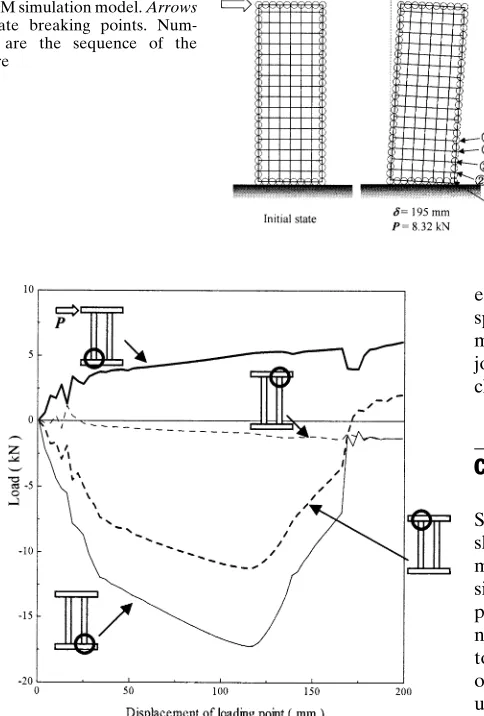
Fig. 13. Load–displacement curves of joint springs corresponding to
the C120 iron clamp between the column and the beam/sill. The x-axis is equal to the displacement shown in Fig. 10. The positive direction of the y-axis indicates the tensile load
expresses breaking phenomena qualitatively, which corre-sponds well with the observed results of the actual experi-ments. Figure 13 shows the load–displacement relations of joint springs between column and beam/sill. The nonlinear characteristic is observed in Fig. 13.
Conclusions
Simulated load–displacement curves of the plywood-sheathed wall were similar to those obtained in the experi-ments, and the sequence of failure at nailed joints of the simulation model agreed well with experimental collapsing processes qualitatively. Consequently, it turned out that our newly developed EDEM modeling method and the method to determine EDEM parameters are adequate for analysis of timber-frame structures. This method thus, proved to be useful for quantitative analysis of the fracture process of timber-frame structures.
Acknowledgments This work was supported in part by a Grant-in-Aid
for Scientific Research from the Ministry of Education, Science, Sports, and Culture, Japan (grant 09460072), and by a Grant-in-Aid for Scientific Research from the same Ministry (Research Fellowships of the Japan Society for the Promotion of Science for Young Scientists).
References
1. Nakagawa T, Ohta M (2003) Collapsing process simulations of tim-ber structures under dynamic loading I: simulations of two-story frame models. J Wood Sci 49:392–397
2. Ohno Y, Okabe M, Sakuma H, Shimoyashiki T (2001) Comparison of tie-rod system with hold-down system under horizontal loading test for shear wall (in Japanese). In: Summaries of technical papers of the annual meeting of the Architectural Institute of Japan, C-1, structure III, Tokyo, pp 309–310
3. Nagaoka K, Tsuchimoto T, Ohta M (1999) Fracturing process analy-sis of joint connections of Japanese frame constructions under dif-ferent deformation rate. In: Proceedings of the Pacific timber engineering conference, vol 3, Rotorua, pp 303–308
4. Inayama M (1991) The theory and application for crashing in wood (in Japanese). Doctoral dissertation, University of Tokyo 5. Meguro K, Hakuno M (1988) Fracture analyses of concrete
struc-tures by granular assembly simulation (in Japanese). Bull Earth-quake Res Inst 63:409–468