http://www.sciencepublishinggroup.com/j/wjac doi: 10.11648/j.wjac.20190402.12
ISSN: 2637-5966 (Print); ISSN: 2637-5982 (Online)
Total and Chemical Speciation Analyses of Potential Toxic
Metals in Refuse Dumpsite Soils
Odunayo Timothy Ore
1, *, Godswill Ehimengbale Akhigbe
1, Abiodun Odunlami Adegunwa
2,
Emmanuel Oladimeji Olalekan
1, Dayo Abiodun Ayeni
1, Olamide Mary Omirin
1,
Philomena Ebunoluwa Adebiyi
31
Chemistry Department, Obafemi Awolowo University, Ile-Ife, Nigeria 2
Pure and Applied Chemistry Department, Osun State University, Osogbo, Nigeria
3Environmental Health Department, Medical and Health Services, Obafemi Awolowo University, Ile-Ife, Nigeria
Email address:
*
Corresponding author
To cite this article:
Odunayo Timothy Ore, Godswill Ehimengbale Akhigbe, Abiodun Odunlami Adegunwa, Emmanuel Oladimeji Olalekan, Dayo Abiodun Ayeni, Olamide Mary Omirin, Philomena Ebunoluwa Adebiyi. Total and Chemical Speciation Analyses of Potential Toxic Metals in Refuse Dumpsite Soils. World Journal of Applied Chemistry. Vol. 4, No. 2, 2019, pp. 19-29. doi: 10.11648/j.wjac.20190402.12
Received: August 28, 2019; Accepted: September 16, 2019; Published: September 26, 2019
Abstract:
Potential toxic metals (Pb, Cu, Zn, Cd, Cr, Ni and Fe) concentrations in two selected refuse dumpsites (Apollo andTonkere) soils in Ile-Ife, Nigeria were determined using Atomic Absorption Spectrometry to assess the pollution status of the areas. Control soils were also collected from areas with little or no anthropogenic inputs. Potential toxic metal concentrations in the refuse dumpsite soils were considerably higher than those of the control. Geo-accumulation index results indicated that the refuse dumpsites have unpolluted to moderate pollution for all the investigated metals, while pollution index results (> 1) suggested that the refuse dumpsites were contaminated with all the analyzed metals. Enrichment factor results indicated no enrichment for all the investigated metals. This might be connected with recent regular clearing of the dumpsites. Chemical speciation results showed relatively high bioavailability and mobility potential with a large proportion retained in the labile fraction. The study concluded that the studied dumpsites were still impacted with the analyzed potential toxic metals whose concentrations exceeded those of the control samples and standard permissible limits and that long-term exposure to these bioavailable metals might pose intrinsic hazards to human health. It is therefore recommended that clearing of the dumpsites should be consistent.
Keywords:
AAS, Dumpsite, Potential Toxic Metal, Pollution, Speciation1. Introduction
One serious problem that has persisted for long in our environment in Nigeria is the generation of refuse, its dumping and consequently its management. Anthropogenic contributions ranging from nutrition to industrialization to agricultural practices to transportation to education to commerce etc, have been largely responsible for the upsurge in refuse generation in the Nigerian society. The increase in the nation’s population equally brings about an upsurge in the human practices responsible for the generation of refuse. The proper management of refuse can prove to be of great value, nevertheless, it can pose serious threat to lives as a result of
its potential to pollute the aquatic and terrestrial environment [1].
elements of high molecular masses, most of which belong to the transition elements [2]. Potential toxic metal pollution not only affects the production and quality of crops, but are environmentally problematic due to their high persistence and toxic effects [3].
Refuse management has remained an obdurate environmental sanitation problem in Nigeria. Contributory factors to the challenge include inadequate regulatory framework that has manifested in lack of interest of private sector investment in service delivery (infrastructure); uncoordinated institutional functions; low political will, low capacity to discharges duties, poor data information for planning, wrong attitude of waste generator amongst others. Yet, on the increase, is the demand for good waste management service for public health and environmental protection [4]. Waste that had been continuously dumped at a particular location would lead to contamination of the environment with various potential toxic metals which are mostly toxic. The toxic potential toxic metals are either taken up in the plants or they affect living organisms particularly humans in the environment which could lead to various diseases and even death. Open spaces are abused in terms of use, they are used for defecation and indiscriminate citing of disposal points for refuse [5]. The contaminants (potential toxic metals) present in these refuse dumpsites, leaches into the soil, contaminates the groundwater or is either washed away by runoff into surrounding rivers, thereby making the environment unsafe. Hence, there is a need to determine the total pollution status of the areas with respect to the potential toxic metal concentration.
2. Materials and Methods
2.1. Study Area, Sampling, Sample Storage and Preparation
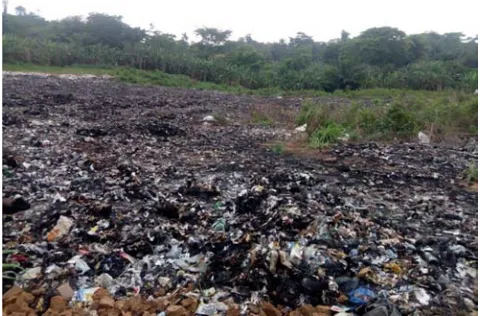
The study areas are within Ife, Osun state, Nigeria. Ile-Ife lies between latitude 7° 27ʹ 59ʺ N and longitude 4° 33ʹ 59ʺ E. The areas (Apollo and Tonkere) are hosts to the Community of Obafemi Awolowo University, Ile-Ife, domestic and industrial waste dump site. Figure 1 shows the picture of Tonkere refuse dumpsite. The areas are the major dump sites where all the solid domestic and industrial waste around the environment are being deposited; the areas are not close to residential areas basically to reduce the level of toxicity and contamination affecting the populace. Surface soils were collected from ten (10) sampling points on the refuse dumpsites of Apollo and Tonkere areas. The samples were collected by scooping the soil samples into air tight containers labeled according to the name of the area from which the samples were collected and transported into the laboratory for analysis. The surface soil samples were air-dried; rocks and pebbles were removed before pulverization using a mortar and pestle. The pulverized soil samples were then passed through a 500 µm filter sieve to achieve uniform particle size.
Figure 1. A picture showing the Tonkere refuse dumpsite.
2.2. Quality Assurance and Quality Control
All the glassware and sample bottles were cleaned using the procedure of Laxen and Harrison (1981). The containers were thoroughly washed with detergent rinsed with water, soaked in 10% HNO3 for 48 hours. Thereafter, they were
thoroughly rinsed with distilled water and by doubly distilled water and then kept dried at 105°C in the oven. All analyses were performed in duplicates [6].
Recovery analysis was done to ascertain the accuracy of the method/analytical procedure used by spiking 1 g each of two different soil samples with 5.0 µg/g standard mixture of the potential toxic metal solutions (Pb, Cu, Cd, Fe and Zn). Standard metal solutions were used to fortify the sample with the specified metal, digested and taken for AAS analysis. The percentage recovery (%R) for the potential toxic metals was determined as given below:
% R = [(C - Cʹ) / A] x 100 (1) Where C = potential toxic metal concentration in the spiked soil sample, C´ = potential toxic metal concentration in the unspiked sample and A = the amount of potential toxic metal used for spiking [7].
2.3. Data Treatment
For the interpretation of the geochemical data the following statistical methods were used: Descriptive statistics (mean, range, standard deviation) were performed in addition to pollution index, geo-accumulation index and enrichment factor to investigate the pollution status of the sites. Cluster analysis, principal component analysis/ANOVA and T-test were also used to interpret the results while coefficient of variation was adopted to evaluate the spatial and temporal distribution patterns of the metals. Mobility factor was determined to have an understanding of the level of availability of the metals in the environment studied [8].
Mobility Factor (MF)
metal mobility was calculated as a mobility factor (MF) on the basis of the following equation [9].
MF = × 100 (2)
Pollution Index (PI)
The elemental concentrations of the soils were also subjected to statistical analysis to determine the PI of the elements. The PI is the quotient of the concentration of the element x in the sample to the maximum permissible level of the element.
( ) = (3)
It is agreed in principle that if the value of PI of an element is greater than 1.0, it implies that the contamination of the sample by the element is high and may be toxic at the level it is present in the sample [10].
Geoaccumulation Index (Igeo)
An index of geo-accumulation (Igeo) is used to quantify the
extent of potential toxic metal contamination associated with the soils. It was calculated using the equilibrium equation below [11].
Igeo = log2(Cn/1.5 Bn) (4)
Where Cn is the measured concentration of the potential
toxic metal ‘n’ in the sample and Bn is the geochemical
background value of the element n and 1.5 is the background matrix correction factor due to lithogenic effects. The geo-accumulation index (Igeo) was distinguished into seven
classes as: Igeo≤0, class 0, unpolluted; 0<Igeo≤1, class 1, from
unpolluted to moderately polluted; 1<Igeo≤2, class 2,
moderately polluted; 2<Igeo≤3, class 3, from moderately to
strongly polluted; 3<Igeo≤4, class 4, strongly polluted;
4<Igeo≤5, class 5, from strongly to extremely polluted; and
Igeo>5, class 6, extremely polluted [11].
Enrichment Factor (EF)
Enrichment factor (EF) has been employed for the assessment of contamination in various environmental media by several researchers. EF was used in the study to assess the relative contributions of natural and anthropogenic potential toxic metal inputs to soils [12]. It has also been used to indicate the degree of pollution or contamination or both. It is calculated using the expression:
EF = (!"/ ! $)
(&"/ & $) (5)
Where Cx = content of the examined element in the
examined environment
Cref = content of the examined element in the reference
environment
Bx = content of the reference element in the examined
environment
Bref = content of the reference element in the reference
environment
Five contamination categories are recognized and interpreted [13]: EF < 1 indicates no enrichment, EF < 3 is
minor enrichment, EF = 3 - 5 is moderate enrichment, EF = 5 - 10 is moderately severe enrichment, EF = 10 - 25 is severe enrichment, EF = 25 - 50 is very severe enrichment and EF > 50 is extremely severe enrichment.
2.4. Elemental Analysis
2.4.1. Total Metal Analysis
Pulverized soil samples (1.0 g) each was pretreated using 10 mL Aqua regia (mixture of concentrated HCl and HNO3
acids in the ratio 3:1, British Drug House, BDH Analar grade). This was then heated on a hot plate at 70°C to near dryness and then cooled, and 5 mL of 2 M HCl was added. This was filtered into 50 mL volumetric flask and made up with double distilled water [6]. The filtrates were analyzed for potential toxic metals (Pb, Cu, Zn, Cd, Cr, Ni and Fe) using Atomic Absorption Spectrophotometer, Model Alpha Star 4 (ChemTech Analytical) at the Centre for Energy Research and Development of the Obafemi Awolowo University, Ile-Ife, Nigeria. Blank determination was also carried out.
2.4.2. Speciation of Potential Toxic Metals
The methodology was designed to extract and partition Pb, Cu, Zn, Cd, Cr, Ni and Fe into water soluble, exchangeable, carbonate bound, Fe-Mn oxides bound, organic bound and residual fractions. Each soil sample weighing 1.0 g were air dried and homogenized to ≤ 2.0 mm diameter particle size and underwent sequential extraction to obtain the six operationally defined fractions. The resulting supernatant aqueous layers were carefully filtered into analytical vial of size 75 mL and taken for AAS analysis. The concentrations of the following metals (Pb, Cu, Zn, Cd, Cr, Ni and Fe) were determined. The summary of the adopted procedure [8; 14] is as follows:
Water soluble fraction (F1)
Exactly 1.0 g of air-dried soil sample each was mixed with 10 mL distilled water with continuous agitation using mechanical shaker for 1 hour. This was then centrifuged and the supernatants decanted and made up to 25 mL with distilled water and stored in a cleaned plastic container.
Exchangeable fraction (F2)
The residue from F1 was extracted at room temperature for 1 hour with 20 mL 1 M MgCl2 solution at pH 7. The mixture
was thoroughly agitated throughout the extraction.
Bound to carbonates (F3)
The residue of F2 was extracted with 20 mL of 1 M sodium acetate/acetic acid buffer at pH 5 for 5 hours at room temperature. The extracted metal solution was decanted from the residual soil samples. The residual sediment was used for the next extraction.
Bound to iron and manganese oxides (F4)
The residue from F3 was extracted under mild reducing conditions as follows: Hydroxyl amine hydrochloride (NH2OH.HCl) weighing 0.69 g was dissolved in 250 mL
distilled water to prepare 0.04 M NH2OH.HCl. The residue
was extracted with 20 mL of 0.04 M NH2OH.HCl in 25%
for 6 hours. The extract was decanted from the residual sediment which was used for the next extraction.
Bound to organic matter and sulphide (F5)
The residue from F4 was oxidized as follows: 3 mL of 0.02 M HNO3 and 5 mL of 30% (v/v) hydrogen peroxide,
which has been adjusted to pH 2, was added to the residue from F4. The mixture was heated to 85°C in a water bath for 2 hours with occasional agitation and allowed to cool down. Another 3 mL of 30% hydrogen peroxide, adjusted to pH 2 with HNO3, was then added. The mixture was heated again at
85°C for 3 hours with occasional agitation and allowed to cool down. Then 5 mL of 3.2 M ammonium acetate in 20% (v/v) HNO3 was added, followed by dilution to a final
volume of 20 mL with de-ionized water. The extracted metal solution was decanted from the residual sediment which was used for the next extraction.
Residual or inert fraction (F6)
Residue from F5 was oven dried at 105°C. Digestion was carried out with a mixture of 5 mL conc. HNO3 (HNO3, 70%
w/w), 10 mL hydrofluoric acid (HF, 40% w/w) and 10 mL perchloric acid (HClO4, 60% w/w) in Teflon beakers. The
fractions (extracts) were then taken for AAS determination.
3. Results and Discussion
3.1. Results of Recovery Analysis
The reliability of the analytical procedures adopted in this study was tested in terms of sensitivity, recovery, precision
and accuracy. Table 1 shows the values for % recovery for the potential toxic metals under experimental conditions used. The recoveries of metals in spiked sample were between 84.5 - 94.8%. Since the mean percentage recoveries for all analyte were within an acceptable range (70-110%); this gives credence to the reliability of the results of this study.
Table 1. Analytical results for calibration curve and percentage recovery (% R) for the analyzed heavy metals.
Heavy metals Amount spiked (µg/g) Amount recovered (µg/g) % Recovery
Pb 5.0 4.250 85.00
Cu 5.0 4.740 94.80
Cd 5.0 4.350 87.00
Zn 5.0 4.225 84.50
Fe 5.0 4.450 89.00
3.2. Elemental Analysis
The range and mean levels of the analyzed metals (Pb, Cu, Zn, Cd, Cr, Ni and Fe) of the soils of Apollo and Tonkere markets are shown in Table 2. It is observed that the soil samples contain relatively low trace metals. The order of decreasing mean values of metals in the soils are Fe > Cu > Zn> Ni > Cd > Cr >Pb. The comparatively high value of Fe in the soils is due to the fact that Nigerian soil is very rich in Fe and could be released to the environment at low pH [15]. The metals are also generally higher in the refuse dumpsite soils than the control soils.
Table 2. Showing range and mean of total metal concentrations of soils of Apollo and Tonkere markets; comparing the elemental concentrations of analyzed soils with their standard permissible limits; indicating the values of geo-accumulation index (Igeo), pollution index (PI) and enrichment factor (EF) for the
metals in the refuse dumpsite soils, and comparing the mean total metal concentrations of the refuse dumpsite and control soils using T-test values at 95% confidence interval.
Element
(µg/g) Study soils Control soils
Permissible limit
(DPR, 2002) P.I E.F (Igeo)
T-test value tcalculated Remark
Pb 3.50-6.50 (4.72±0.04) 3.60-4.25 (4.18±0.03) 85 1.12 0.16 -0.41 13.15 SD
Cu 18.75-40.00 (27.30±0.26) 14.50-34.00 (23.93±0.22) 36 1.14 0.16 -0.39 15.77 SD
Zn 20.25-27.50 (24.20±0.25) 21.00-25.00 (22.68±0.21) 146 1.06 0.15 -0.49 5.86 SD
Cd 7.50-25.25 (16.65±0.11) 6.75-20.00 (14.00± 0.08) 0.80 1.18 0.17 -0.33 23.52 SD
Cr 10.00-16.25 (13.37±0.25) 8.50-10.25 (9.43±0.17) 100 1.41 0.21 -0.08 15.40 SD
Ni 10.00-32.50 (22.25±0.21) 9.00-25.00 (17.87±0.17) 35 1.24 0.18 -0.26 20.19 SD
Fe 6.20-72.00 (33.58±0.08) 5.30-54.50 (27.70±0.06) 5000 1.21 -0.30 71.61 SD
SD = Significant difference; tcritical = 2.13
Analysis of Variance (ANOVA)
The single factor analysis of variance was carried out on the refuse dumpsite soils using Microsoft excel software package. If Fcalculated > Fcritical, the null hypothesis is rejected.
However, this is not the case for the refuse dumpsite soils as 2.03 ˂ 2.04 as shown in Table 3. Therefore, we accept the null hypothesis. The means of the ten population are not all equal.
Table 3. Single factor analysis of variance.
ANOVA
Source of Variation SS Df MS F P-value F crit
Between Groups 3416.03 9 379.55 2.03 0.05 2.04
Within Groups 11214.04 60 186.90
Total 14630.08 69
Cluster analysis
The hierarchical cluster analysis was used to determine the
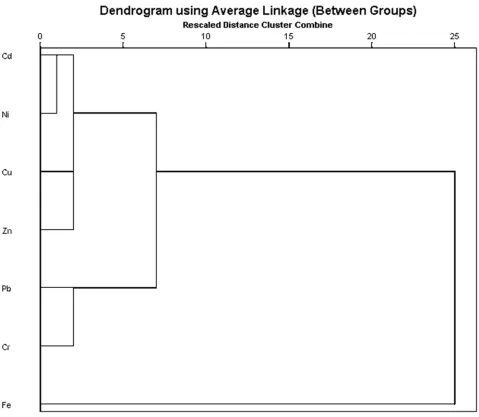
performed using Statistical Package for Social Scientist (SPSS). Figure 2 shows the clustering analysis of the analyzed potential toxic metals in the refuse dumpsite soils. On the X-axis of the dendrogram is the similarity matrix using Euclidean distance, while on the Y-axis are listed the analyzed potential toxic metals. The results showed two
major groups; the first group being Fe and the second group being Cd, Ni, Cu and Zn. The latter group members show closest inter-element clustering, indicating chemical affinity and/ or similar sources. Also, the latter group are transition metals with similar properties such as variable oxidation state, among other properties.
Figure 2. Dendrogram showing the clustering relationship between the analyzed metals.
Correlation between the Analyzed metals
Correlation coefficient measures the strength of a linear relationship between any two variables on a scale of -1 (perfect inverse relation) through 0 (no relation) to +1 (perfect sympathetic relation). In this study, the raw data was used in calculating the correlation coefficient using the Microsoft Excel computer software package.
The results of correlation were calculated using the raw data. The correlation coefficient data is important in order to deduce the possible sources of the potential toxic metals in the studied soils. The correlation matrix of the analyzed metals in the studied soils is presented in Table 4. Strong and positive correlations between Fe/Cd, Cu/Cd, Ni/Cd, Cu/Fe, Ni/Fe and Ni/Cu. Strong and significant positive correlations
indicated chemical affinity; similar genetic origin and / or common background levels in the soils.
Table 4. Correlation matrix of the analyzed metals in the studied soils.
Pb Cd Cr Fe Cu Ni Zn
Pb 1
Cd 0.47 1
Cr 0.25 0.03 1
Fe 0.62 0.96 0.13 1
Cu 0.51 0.80 0.29 0.88 1
Ni 0.39 0.94 -0.10 0.92 0.79 1
Zn -0.48 -0.25 0.19 -0.31 -0.35 -0.43 1
T-test analysis
A comparison of the concentrations of the analyzed metals in the refuse dumpsite and control soil samples using T-test values at 95% confidence interval is presented in Table 2. This statistical analysis indicates significant difference if T- experimental value is greater than 2.13 at 95% confidence limit and vice versa. The results of the T-test indicate that there is a significant difference between the concentrations of all the analyzed metals in this study.
Comparison of the elemental values and their standard permissible limits
The comparison of the elemental values and their standard permissible limits is presented in Table 2. The metals are all below the standard permissible limits set by the Department of Petroleum Resources except for Cd which has a mean value of 16.65. The mean value obtained for this metal in this study is comparatively higher than its permissible limit. This indicates a degree of contamination in the studied soil.
Pollution Index (PI), Geo-accumulation Index (Igeo) and Enrichment Factor (EF)
The values for the geo-accumulation index, pollution index and enrichment factor for the analyzed potential toxic metals in the refuse dumpsite soils are listed in Table 2. For enrichment factor, an element is regarded as a reference element if it is of low occurrence variability and is present in trace amounts. It is also possible to apply an element of geochemical nature whose substantial amounts occur in the environment but has no characteristic effects i.e. synergism or antagonism towards an examined element [16]. Most commonly used reference elements in enrichment factor include Sc, Mn, Al and Fe [17]. In this study, Fe was chosen as the geochemical normalizer because of its conservative nature during diagenesis [18]. Moreover, soils in Nigeria have been reported to be rich in Fe [15].
From the results presented in the Table 2, all the analyzed metals have their EF values less than 1 i.e. EF < 1. According to the interpretation of Birth [13], EF < 1 indicates no enrichment which suggests a possible mobilization of metals. Also, from the table, the results of the PI show a PI > 1 for all the metals in the studied soils. This suggests that the soils are contaminated with all the potential toxic metals under study.
Applying the classification system [11] for the index of geo accumulation to the study soils, the Igeo values are
generally low for all the metals. The Igeo value is less than 0
in all cases. The metals fall into class 0: unpolluted to moderate pollution.
Comparison of the total elemental concentrations with similar Studies
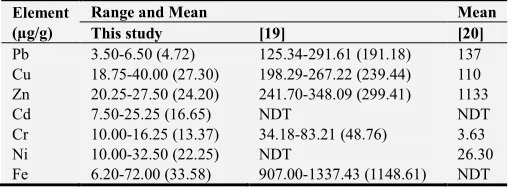
The comparison of the total elemental concentration in this study with similar studies is presented in Table 5. The total metal concentrations obtained in this study are comparatively lower than that previously reported by [19] on the same investigated dumpsites as well as a study by [20] (except for Cr) on another study area. This lower metal levels in this study is due to recent regular clearing of the dumpsites by concerned authority.
Table 5. Comparison of the total elemental concentrations in this study with similar studies.
Element (µg/g)
Range and Mean Mean
This study [19] [20]
Pb 3.50-6.50 (4.72) 125.34-291.61 (191.18) 137
Cu 18.75-40.00 (27.30) 198.29-267.22 (239.44) 110
Zn 20.25-27.50 (24.20) 241.70-348.09 (299.41) 1133
Cd 7.50-25.25 (16.65) NDT NDT
Cr 10.00-16.25 (13.37) 34.18-83.21 (48.76) 3.63
Ni 10.00-32.50 (22.25) NDT 26.30
Fe 6.20-72.00 (33.58) 907.00-1337.43 (1148.61) NDT
NDT = Not determined
3.3. Chemical Fractionation of the Metals in the Study Soils
The sequential extraction procedures (speciation) were used to study the bioavailability of the potential toxic metals in the studied soils. If extract is soluble, the metals present in this extract can easily be released into the soil and made available to plants depending on changes in the environmental conditions such as pH, redox reaction or the presence of organic chelator [8]. The results of the sequential extraction are presented in Figures 3-9.
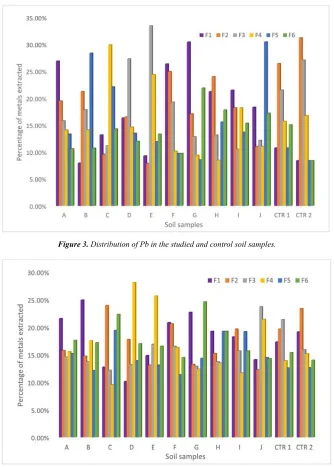
Lead: The percentage of lead extracted in the studied dumpsite soils is presented in Figure 3. The percentage concentration is of the trend: Water-soluble ˃ Carbonate ˃ Exchangeable ˃ Organic matter ˃ Fe-Mn oxide ˃ Residual. The relatively high levels of lead in the water-soluble fraction is not consistent with the reports of [21] and [22].
The bioavailability level of lead is presented in Figure 10. The bioavailable fractions constitute 53.52% while the non-bioavailable fractions constitute 46.48%. The studied refuse dumpsites are at a risk of metal contamination as a result of the concentration of bioavailable fractions in the sites.
Cadmium: The percentage of cadmium extracted in the studied dumpsite soils is presented in Figure 4. The percentage mean concentration is of the trend: Water-soluble ˃ Residual ˃ Fe-Mn oxide ˃ Exchangeable ˃ Carbonate ˃ Organic matter.
The bioavailability level of cadmium as presented in Figure 10 shows that the bioavailable fractions make up 49.79% while the non-bioavailable fractions make up 50.21%. While the water-soluble fraction holds a high percentage of Cd, an appreciable amount in the residual fraction indicates that cadmium will not be available for uptake by plants. This is in contrast with the report of [23].
Chromium: The percentage of chromium extracted in the dumpsite soils is presented in Figure 5. The percentage mean concentration is of the trend: Exchangeable ˃ Carbonate ˃ Residual ˃ Fe-Mn oxide ˃ Water-soluble ˃ Organic matter. High levels of metals in the exchangeable fraction are an indication of lability. The metals bound to carbonate phase are affected by ion exchange and changes of pH. Significant amount of trace metals can be co-precipitated with carbonates at the appropriate pH.
fractions while 47.61% remains in the non-bioavailable fractions.
Iron: The percentage of Fe extracted in the dumpsite soils is presented in Figure 6. The percentage mean concentration is of the trend: Exchangeable ˃ Water-soluble ˃ Fe-Mn oxide ˃ Carbonate ˃ Residual ˃ Organic matter.
The bioavailability level of Fe as shown in Figure 10 depicts a 53.64% in the bioavailable fractions and 46.36% in the non-bioavailable fractions.
Copper: The percentage of Cu extracted in the studied soils is presented in Figure 7. The percentage mean concentration follows the trend: Residual ˃ Carbonate ˃ Exchangeable ˃ Water-soluble ˃ Fe-Mn oxide ˃ Organic matter.
The bioavailable fractions hold 51.86% while the non-bioavailable fractions account for 48.14% of the metal.
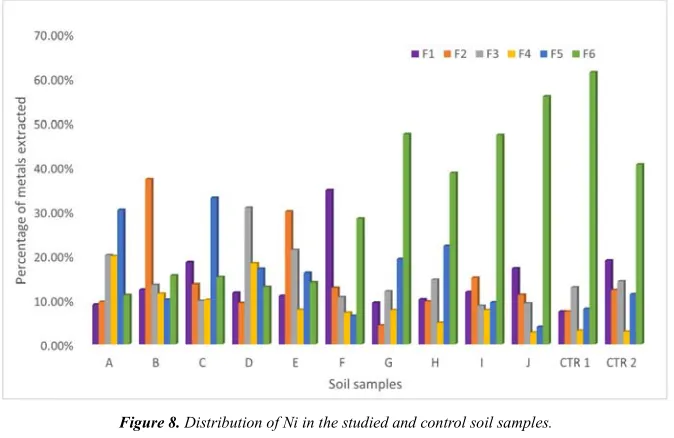
Nickel: The percentage of Ni extracted in the studied soils
is presented in Figure 8. The percentage mean concentration follows the trend: Residual ˃ Organic matter ˃ Exchangeable ˃ Carbonate ˃ Water-soluble ˃ Fe-Mn oxide. A relatively high percentage of Ni in the residual fraction indicates a retention of the metal in the silicate matrix of the soil, and hence suggests that the metal will not be available for uptake. The bioavailable fractions hold 45.55% while the non-bioavailable fractions hold 54.45%. This largely suggests that the metal may not be available for uptake.
Zinc: The percentage of Zn extracted in the studied soils is presented in Figure 9. The percentage mean concentration follows the trend: Carbonate ˃ Fe-Mn oxide ˃ Exchangeable ˃ Water-soluble ˃ Organic matter ˃ Residual.
The bioavailable fractions hold 53.85% while the non-bioavailable fractions account for 46.15%. This suggests a possible availability of the metal for uptake by plants.
Figure 3. Distribution of Pb in the studied and control soil samples.
Figure 5. Distribution of Cr in the studied and control soil samples.
Figure 6. Distribution of Fe in the studied and control soil samples.
Figure 8. Distribution of Ni in the studied and control soil samples.
Figure 9. Distribution of Zn in the studied and control soil samples.
4. Conclusion and Recommendations
Potential toxic metals in soils from refuse dumpsites were investigated to determine the pollution status of the area using Atomic Absorption Spectrophotometry. The elemental concentrations were subjected to descriptive statistics. The statistical information obtained from the pollution index, geo-accumulation index and enrichment factor suggested that the soils are contaminated with the potential toxic metals and they may be as a result of anthropogenic inputs emanating from all sorts of refuse dumped in the soils.
The speciation of the potential toxic metals gave information about the chemical behavior of the potential toxic metals in the soils as well as mobility and bioavailability of these potential toxic metals. The information obtained from the bioavailability of these metals indicated that they are present in the mobile fraction and as such might pose intrinsic hazards to human health.
Waste generation is increasing as a result of the upsurge in the human population. Based on the findings of this study, a remediation scheme should be developed to clean up the potential toxic metals of these soils. Also, refuse dumpsites should be located in areas far away from residential areas so as to prevent the leaching of these metals to agricultural lands. An effective waste management plan should also be developed. It is also recommended that wastes should be sorted into biodegradable and non-biodegradable forms before their disposal.
Acknowledgements
The authors acknowledge the Environmental and Pollution research laboratory administrators for allowing us to use the laboratory for this research.
References
[1] Bishop P. L. 2000. Pollution Prevention: Fundamentals and Practice. McGraw-Hill, Companies Inc.
[2] Silberberg, M. S. 2000. Chemistry: the molecular nature of matter and change. McGgraw hill higher education, 2nd Edition. pp. 1000-1035.
[3] Esakku, S., Palanivelu, K. and Joseph, K. 2003. Assessment of potential toxic metals in a municipal solid waste dumpsite, Workshop on sustainable landfill Management. 3-5 December, Chennai, India. pp. 139-145.
[4] Iriruaga, E. T. 2012. Solid waste Management in Nigeria. www.d-waste.com/new-infographics/item/124-solid-waste-management-in-nigeria.html. 15 November, 2012. Retrieved 10 October, 2018.
[5] Abankwa V., Grimard A., Somer K. and Kuria F. 2009. United Nations Human Settlements Programme (UN-HABITAT). www.unhabitat.org/pmss/getElectronicVersion.aspx?nr=2929 & Accessed; December, 2011.
[6] Adebiyi, F. M. and Ayeni, O. A. 2010. Evaluation of phytoaccumulation of selected metals from petroleum products impacted-soils by Cynodon dactylon plants using AAS/AES analytical techniques. Analytical Letters. 43: 1879-1888.
[7] Osakwe, S. A. and Okolie, L. P. 2015. Distribution of different fractions of Iron, Zinc, Chromium, Lead and Nickel in Soils around Petrol filling stations in selected Areas of Delta State, Nigeria. Journal of Applied Sciences and Environmental Management. 19 (4): 706-716.
[8] Oyewole, F. G. and Adebiyi, F. M. 2017. Total and speciation analyses of potential toxic metals in the sand fraction of Nigerian oil sands for human and ecological risk assessment.
Human and Ecological Risk Assessment: An International Journal. 23 (8): 2046-2068.
[9] Salbu, B., Krekling, T. and Oughton, D. H. 1998. Characterization of radioactive particles in the environment.
Analyst, 123: 843-849.
[10] Adebiyi, F. M., Asubiojo, I. O. and Ajayi, T. R. 2008. Elemental characterization of Nigerian oil sands by TXRF spectrometry. Petroleum Science and Technology. 25 (1), 29– 39.
[11] Buccolieri, A., Buccolieri, G. and Cardellicchio, N. 2006. Potential toxic Metals in Marine Sediments of Taranto Gulf (Ionian Sea, Southern Italy). Marine chemistry. 99: 227-235. [12] Barbieri, M. 2016. The Importance of Enrichment Factor (EF)
and Geoaccumulation Index (Igeo) to Evaluate the Soil Contamination. Journal of Geology and Geophysics. 5: 237. [13] Sucharovà, J., Suchara, I., Hola, M., Marikova, S., Reimann,
C., Boyd, R., Filzmoser, P. and Englmaier, P. 2012. Top-/Bottom-Soil Ratios and Enrichment Factors: What Do They Really Show? Applied Geochemistry. 27: 138-145.
[14] Abu-Kukati, Y. 2001. Potential toxic metal distribution and speciation in sediments from Ziqlab Dam-Jordan. Geological Engineering, 25 (1), 33-40.
[15] Asubiojo O. I. and F. M. Adebiyi 2011. Effects of Bitumen Deposit on Soil Physico-Chemical Characteristics. Soil and Sediment Contamination: An International Journal, 20: 2, 142-162.
[16] Odat, S. 2015. Application of Geoaccumulation Index and Enrichment Factors on the Assessment of Potential toxic Metal Pollution along Irbid/zarqa Highway-Jordan. Journal of Applied Sciences. 15: 1318-1321.
[17] Ololade, I. A. 2014. An Assessment of Potential toxic-Metal Contamination in Soils within Auto-Mechanic Workshops Using Enrichment and Contamination Factors with Geoaccumulation Indexes. Journal of Environmental protection. 5: 970-982.
[18] Chapman, P. M. and Wang, F. 2001. Assessing Sediment Contamination in Estuaries. Environmental Toxicology and Chemistry, 20: 3-22.
[20] Olayiwola, O. A. and Onwordi, C. T. 2015. Environmental Fate of Potential toxic Metals in Soil of Ido-Osun Waste Dump Site, Osogbo, Osun, Nigeria. American Journal of Environmental Protection. 3 (1): 1-4.
[21] Nwajei, G. E, Iwegbue, C. M. A. and Okafor, M. I. 2007. Potential toxic metals in surface soils under waste dumps in Onitsha, Nigeria. Journal of Biological Sciences. 7 (2): 405-408.
[22] Segarra, M. J., Prejo, R., Wilson, J., Bacon, J. and Santos-Echeandia, J. 2008. Metal speciation in surface sediments of the Vigo Ria (NW Iberian Peninsula). Scientia Marina. 72 (1): 119-126.