Forward Physics at CMS
Grzegorz Brona1,afor CMS Collaboration.
1Warsaw University, Faculty of Physics, Hoza 69, Warsaw, Poland
Abstract.An overview of the forward physics programme at CMS is given. It covers measurements of the central exclusive production, diffractive dissociation, forward en-ergy flow and forward jets.
1 Introduction
Compact Muon Solenoid (CMS) is one of the two large, multi-purpose experiments at the Large Hadron Collider (LHC) at CERN. With a close cooperation with TOTEM experiment, located at the same interaction point, almost 100% coverage in pseudorapirities for charged and neutral particles is assured.
The central part of CMS, which spans to|η| < 3 , is optimized for processes with large polar angles and high values of pT. It consists of a tracker, hadronic and electromagnetic calorimeters
and muon chambers. In the region|η| <1.74, the Hadronic Calorimeter (HCAL) cells have widths of 0.087 inηand 0.087 rad in φ. In the (η,φ) plane, and for|η| < 1.48, the HCAL cells map on to 5×5 ECAL crystals arrays to form calorimeter towers. At larger values of|η|, the size of the towers increases and the matching ECAL arrays contain fewer crystals. ECAL and HCAL extend to |η| <3.0. In the forward region CMS is complemented by several subdetectors. The two Hadronic Forward (HF) calorimeters cover the region of 3.0 <|η| <5.2. They consist of iron absorbers and embedded radiation hard quartz fibres, which provide a fast collection of Cerenkov light. Half of the fibres run over the full depth of the absorber, while the other half start at a depth of 22 cm from the front of the detector. This structure makes it possible to distinguish showers generated by electrons and photons, from those generated by hadrons. The tower segmentation of the HF calorimeters inη andφis 0.175×0.175 except for|η|above 4.7 where the segmentation is 0.175×0.135. The CMS CASTOR calorimeter is located 14 meters from the interaction point only at one side of the detector and covers range of−5.2 > η >−6.6. It is a sampling calorimeter with tungsten absorber plates and fused silica plates as an active medium. It is composed of two parts - an electromagnetic one, 22 radiation length deep, and a hadronic one. The total depth is 10.3 interaction lengths. CASTOR is segmented only inφ. The CMS Zero Degree Calorimeters (ZDC) are installed at the end of straight beam line section, 140 meters from the interaction point, at both sides of the detector. They are able to detect neutrals, and cover|η|>8.1 . The 6<|η|<8 region is covered by Forward Shower Counters (FSC), which role is to detect an activity at large rapidities and selects events with diffractive gaps at one or two sides of the interaction point.
ae-mail: [email protected]
C
Xor its decay products. In the CEP three distinct processes may be involved, namely photon-photon, photon-pomeron and pomeron-pomeron interactions. The systemX is reconstructed in the central CMS barrel, while forward detectors are used to veto non-exclusive events.
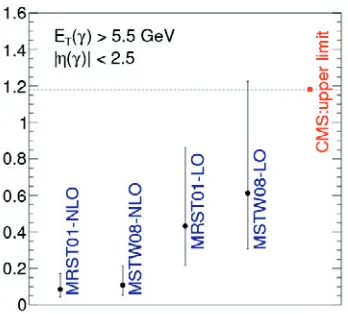
The CEP of di-photons provides information on several ingredients needed for the exclusive Higgs search, that is on the unintegrated gluon distributiong(x1,x2), the Sudakhov form factor (i.e. the probability of no gluon radiation) and on the rapidity gap survival probabilityS2(i.e. the probability of no other parton-parton interactions). The measured cross section for exclusive di-photons will give an estimation what CEPH cross section to expect. When the exclusive His found, the ratio H/(gg) (corrected for kinematic dependencies) will determine theggHcoupling in a unique way. In the analysis of 2010 7 TeV data [1] the following requirements were applied: twoγwithin|η|<2.5 andET >5.5 GeV, no additional activity within|η|<5.2 acceptance. No CEP di-photon candidates
defined with those requirements were found. In Fig. 1 the 95% CL limit on thepp → p+γγ+p production cross section is presented and compared with ExHuMe model at LO and NLO.
Exclusive di-lepton production (γγ → l+l−) is a nearly pure QED process Therefore its cross section is precisely known. Its measurement at the LHC is an independent cross check of the the absolute luminosity calibration. Two exclusive di-lepton analyses were performed on 2010 low pile-up data, production ofee[1] andμμ[2]. Foreechannel both leptons were required to haveET >5.5
GeV and contained within|η|<2.1, while forμμchannel pT >4 GeV,|η|<2.5 andm(μμ)>11.5
GeV selection criteria were applied. Foree analysis 17 candidates were found with the Standard Model predictions of 16.3±1.3(signal)+0.85±0.28(background) events. Forμμthe production cross section was calculated:σ(pp→p+μμ+p)=3.38+−0.580.55(stat.)±0.16(syst.)±0.14(lumi.) pb. The data to theory ratio is 0.83+0.14
−0.13(stat.)±0.04(syst.)±0.03(lumi.).
3 Soft diffraction
Inclusive diffractive interactions cannot be calculated within perturbative quantum chromodynamics, and traditionally have been described by models based on Regge theory. The predictions of these models generally differ when extrapolated from pre-LHC center-of-mass energies to 7 TeV at LHC. Therefore, measurements of diffractive cross sections at the LHC provide a valuable input for under-standing diffraction and improve its modeling in current event generations. They are also crucial for the proper modeling of the final state of minimum-bias (MB) events, and can help improve the simu-lation of, e.g., the underlying event, pileup events, and the measurement of the machine luminosity at the LHC.
Figure 1: pp→p+γγ+pproduction cross section measured by CMS and compared with ExHuMe model at LO and NLO.
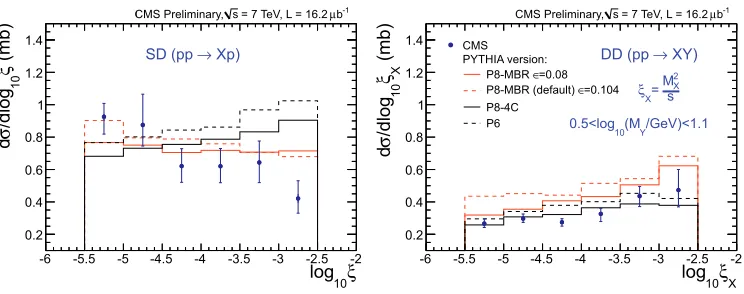
CASTOR calorimeter. The data is compared to PYTHIA8-MBR simulation. The diffractive-event generation in MBR is based on a phenomenological renormalized Regge theory model, which is uni-tarized by interpreting a Pomeron flux as the probability for forming the diffractive rapidity gap. With an intercept for the Pomeron trajectory,α(t)=1++αt, with=0.08 and scaling of the DD cross section downwards by 15% a good description of the data in the analysis is obtained. As a result the differential SD cross section is measured as a function ofξ, the forward momentum loss of the incoming proton, for−5.5 < log10ξ < −2.5 (Fig. 2). The total measured SD cross section for this region is 4.27±0.04(stat.)+0.65
−0.58(syst.) mb.
The differential DD cross section is measured using events for which one hadronic system is detected in the central detector (12<MX <394 GeV) and the other one in the CASTOR calorimeter
(3.2<MY <12 GeV), as a function ofξX =MX2/sfor−5.5<log10ξX <−2.5 (Fig. 2). The DD cross
section is also measured differentially as a function of the width of the central pseudorapidity gap,
Δη, forΔη >3 andMX,MY >10 GeV. The total DD cross cross section integrated over this region is
0.93±0.01(stat.)+0.26
−0.22(syst.) mb.
4 Hard diffraction
Diffraction with a hard scale can be described in terms of the convolution of diffractive parton distri-bution functions and hard scattering cross sections, calculable in pQCD. In hard-diffractive hadron-hadron collisions factorisation is broken because of soft rescattering between the spectator partons. This leads to the suppression of the observed diffractive cross section in hadron-hadron interactions. The suppression factor is called rapidity-gap survival probability. With 2010 data CMS has performed an analysis of hard diffraction events where the hard scale is set by high-pT dijet system [4]. Events
with jets withpT >20 GeV and−4.4< η <4.4 were selected. To enhance the diffractive contribution
ξ 10
log
-6 -5.5 -5 -4.5 -4 -3.5 -3 -2.5 -2 0.2
X ξ 10
log
-6 -5.5 -5 -4.5 -4 -3.5 -3 -2.5 -2 0.2
Figure 2: The SD (left) and DD (right) cross sections as a function ofξcompared to models.
˜ ξ±=C
(Ei±pi z)
√
s (1)
whereEiandpizare the energy and longitudinal momentum of theithobject, respectively, and the sum
runs over all reconstructed objects. TheC factor is a correction determined from MC and account-ing for not reconstructed particles. The results are compared with the predictions of non-diffractive (PYTHIA6 Z2 and PYTHIA8 tune 1) and diffractive (POMPYT SD, POMWIG SD and PYTHIA8 SD+DD) MC generators, and with the NLO calculation based on POWHEG. The differential cross section for dijet production as a function of ˜ξ(averaged result for ˜ξ+and ˜ξ−) is plotted in Fig. 3. From the comparison it is obvious that the generators without diffraction are unable to describe the data. Based on a comparison of the measured cross section with LO and NLO diffractive MCs, the rapidity-gap survival probability ranges from approximately 0.08±0.04 (NLO) to approximately 0.12±0.05 (LO).
5 Forward energy flow
The forward energy flow is directly sensitive to the amount of parton radiation and multiparton inter-action and thus provides a measurement complementary to those for the central region alone allowing for discrimination between different models. Two measurements of the forward energy flow were performed, for HF [5] and for CASTOR [6] acceptance.
In the HF acceptance the average energy flow at forward rapidities is determined separately in two different event classes: in minimum bias events and in events with a hard scale provided by a dijet system at central rapidities (|η| < 2.5). The analysis is carried out at two different centre-of-mass energies, 900 GeV and 7 TeV. For 900 GeV (7 TeV) the leading and the sub-leading jets in the dijet system are required to have pT > 8 GeV/c (pT > 20 GeV/c). The measurement is
Figure 3: The differential cross section for dijet production and comparison with MC models.
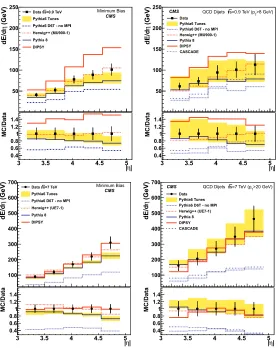
distributions in the data are compared to Monte Carlo predictions on the corresponding hadron level. Both, at detector and at hadron level in MC and also in data, events are selected by requiring activity in the 3.9<|η|<4.4 range in coincidence at both sides of CMS. This selection suppresses diffractive events. The dominant systematic effect in the measurement is the global energy scale uncertainty of the HF calorimeters, which is estimated to be 10% of the measured energy. The results are shown in Fig. 4. The systematic uncertainties are indicated as error bars, while the statistical errors are not shown since they are comparably small. The data are compared to various Monte Carlo predictions. The Pythia 6 tunes (Q2 ordered - CW, D6T, DW, ProQ20 and p
T ordered - Z2, P0, ProPT0) are
shown as bands, which are constructed from the maximum and minimum variation in the Pythia 6 predictions in each bin. The spread of forward energy flow for the different Pythia 6 tunes is fairly large, which may be a consequence of the fact that the forward region was not considered when the tunes were performed. The MC predictions without multiple interactions obtained with Pythia 6 D6T and CASCADE, undershoot the data by at least 40%. Herwig++, which uses specific tunes describes well the measurements at both energies. Pythia 8 predictions are within the tune uncertainty band of the Pythia 6.
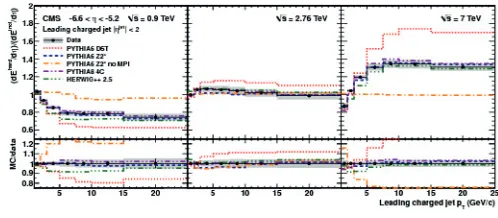
In the CASTOR acceptance the average energy flow is measured also in the minimum bias events (defined as in the HF based analysis) and in events with a hard scale set by a dijet system in central rapidities (|η| < 2). The central jets are selected with a cut pT > 1, which provides large events
statistics, allowing for the energy flow measurement as a function of central jetspT. The analysis is
| η | 3 3.5 4 4.5 5
0.4 0.6 0.8 | η | 3 3.5 4 4.5 5
0.4 0.6 0.8 | η |
3 3.5 4 4.5 5
(GeV) η dE/d 100 200 300 400 500 600 700 =7 TeV s Data Pythia6 Tunes Pythia6 D6T - no MPI Herwig++ (UE7-1) Pythia 8 DIPSY =7 TeV s Data Pythia6 Tunes Pythia6 D6T - no MPI Herwig++ (UE7-1) Pythia 8 DIPSY Minimum Bias CMS | η | 3 3.5 4 4.5 5
MC/Dat a 0.4 0.6 0.8 1 1.2
1.4 3 3.2 3.4 3.6 3.8 4 4.2 4.4 4.6 4.8 5|η|
(GeV) η dE/d 100 200 300 400 500 600 700 Data Pythia6 Tunes Pythia6 D6T - no MPI Herwig++ (UE7-1) Pythia 8 DIPSY CASCADE >20 GeV) T
=7 TeV (p s QCD Dijets CMS | η | 3 3.5 4 4.5 5
MC/Dat a 0.4 0.6 0.8 1 1.2 1.4
Figure 4: Forward energy flow for centre-of-mass 900 GeV (top) and 7 TeV (bottom), for minimum bias (left) and dijet (right) samples.
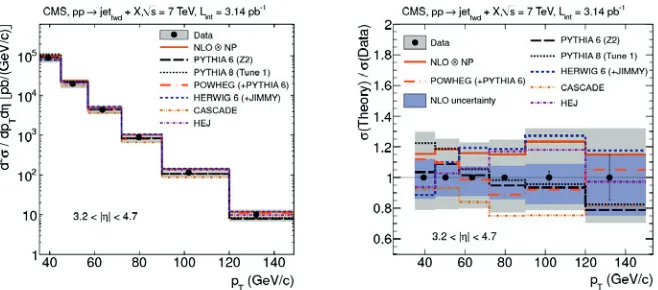
6 Forward and forward-central jets
The inclusive production cross sections for forward jets, as well for jets in dijet events with at least one jet emitted at central and the other at forward pseudorapidities, are measured in the range of transverse momenta pT =35-150 GeV/c, at centre-of-mass energy of 7 TeV [7]. Forward jets are
reconstructed within 3.2 <|η|<4.7, and central jets within the|η|<2.8 range. The jetspT spectra are corrected to account for the migration of events across bins due to finite energy resolution of the calorimeters. Finally the corrected differential cross sectionsd2σ/dp
Tdηare plotted. The dominant
Figure 5: Ratio of the forward energy flow in CASTOR acceptance for dijet and minimum bias samples for centre-of-mass 900 GeV left , 2.76 TeV (middle) and 7 TeV (left).
obtained with the POWHEG package (matched with PYTHIA and HERWIG parton showers) as well as with NLOJET++within the FASTNLO package, for different sets of parton densities, and (iii) the CASCADE and HEJ. Before comparing the data to parton-level predictions such as NLOJET++or HEJ, the uncertainties from non-perturbative (NP) effects are determined, by comparing the PYTHIA 6 and HERWIG 6+JIMMY parton-level spectra with the corresponding particle-level predictions after hadronisation and UE activity. Half of the difference between the correction factors coming from these two model predictions is taken as an estimate of the total uncertainty associated with the NP effect. The uncertainty associated with higher-order corrections neglected in the NLO calculation are evaluated by changing the renormalisation and factorisation scales by factors proportional to the jetpT
(pT/2 and 2pT). The uncertainties associated with the PDF and the strong couplingαS is estimated
following the PDF4LHC interim recommendation. The fully corrected inclusive forward jet cross section as a function of pT is shown in Fig. 6. Within the theoretical (dark band) and systematic
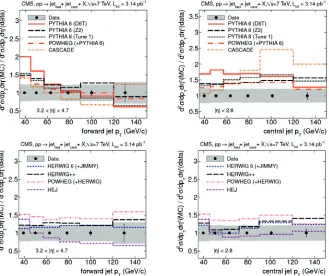
experimental (gray band) uncertainties, all the predictions are in agreement with the measurement. Similar plots for the cross section for the simultaneous production of at least one forward and at least one central jet are presented in Fig. 7. The HERWIG and HERWIG++appear to be consistent with the data. The other generators, and different tunes, do not describe the data over the full range ofpT
values. The discrepancies are larger for jets at central values ofη. In the case of forward jets, the comparison of the inclusivepT spectrum with that requiring the simultaneous presence of a jet in the
central pseudorapidity region shows that the inclusive spectrum is about a factor of four higher in the lowestpTbin but that both distributions agree progressively better at largerpTvalues. This suggests
that inclusive forward jets ofpT ≈35−70 GeV/c may be balanced by other forward jets or by soft
central jets that do not surpass thepT threshold of 35 GeV/c, thereby producing the overall deficit of
central jets in the data.
7 Ratio of inclusive to exclusive dijet production
For this studies events containing at least two jets withpT >35 GeV/c and within|y|<4.7 acceptance
are selected [8]. Events with at least one pair of such jets are denoted as "inclusive". Events with ex-actly one pair of jets are called "exclusive". The ratio of the cross section of all pairwise combinations of jets to the exclusive dijet cross section as a function of the rapidity difference between jets|Δy|is measured (Rinc). The ratio of the cross section for the pair consisting of the most forward and the
Figure 6: Inclusive jet cross section at 3.2 < η| < 4.7, compared to predictions (left). Ratio of theory/data (right).
(RMN). The ratios, corrected for detector effects, are compared to the MC predictions at the
stable-particle level: PYTHIA6 tune Z2, PYTHIA8 tune 4C, HERWIG++tune UE-7000-EE-3, CASCADE and HEJ+ARIADNE. The PYTHIA6 and PYTHIA8 generators agree with the measurements. The predictions of the HERWIG++generator are larger than the measurement especially at largeΔy. The BFKL-motivated generators CASCADE and HEJ+ARIADNE predict for these ratios a significantly stronger rise than observed. The moderate rise of the measured dijet ratios indicates that the BFKL effects are not dominant for jets withpT >35 GeV/c at the present collision energy of 7 TeV.
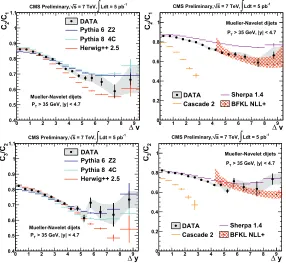
8 Mueller-Navelet dijets
A pair of the most forward and the most backward jets in an event is called Muller-Navelet dijet. Due to large rapidity separation between these jets which can be populated with soft emissions, correlation between the jets is an observable sensitive to the details of the QCD evolution. In particular BFKL effects can be disentangled from the standard DGLAP approach. The CMS analysis is based on the 7 TeV data [9]. Jets withpT >35 GeV and within|η|<4.7 are selected. For each Muellet-Navelet
pair the angular distance is calculated:Δφ=φ1−φ2. Then the average cosines corresponding to the coefficients of a Fourier series inΔφ are derived: Cn = cos(n(Δ−π))withn ∈ {1,2,3}. Finally
the ratios between coefficients are calculated to minimilize the DGLAP and enhance BFKL effects. The results are compared to both DGLAP and BFKL-based MC generators, and to the NLL BFKL calculations. In Fig. 9 theC2/C1 andC3/C2 ratios are plotted and compared with MC models and direct NLL BFKL calculations. Standard DGLAP MC (Pythia and Herwig) describe qualitatively well the data. However the best description at large rapidity separations between jets is given by NLL BFKL calculations. This could be a first experimental indication of effects requiring the BFKL approach in the LHC regime.
References
Figure 7: Theory/data for cross sections for forward (left) and central (right) jets produced in dijet events. The error bars on data points reflect statistical uncertainties, with systematic uncertainties plotted as grey bands.
[4] CMS Collaboration, Phys.Rev. D87, 012006 (2012) [5] CMS Collaboration, JHEP11148 (2011)
Figure 8:Rinc(left) andRMN(right) as a function of the rapidity separation. The shaded band indicates
the size of the systematic uncertainty.
y Δ
0 1 2 3 4 5 6 7 8 9
1 /C2 C 0.4 0.5 0.6 0.7 0.8 0.9 1 1.1 DATA Pythia 6 Z2 Pythia 8 4C Herwig++ 2.5
-1 Ldt = 5 pb
∫
= 7 TeV, s CMS Preliminary,> 35 GeV, |y| < 4.7 T
P
Mueller-Navelet dijets
y Δ
0 1 2 3 4 5 6 7 8 9
1 /C2 C 0 0.2 0.4 0.6 0.8 1
DATA Sherpa 1.4 Cascade 2 BFKL NLL+
-1 Ldt = 5 pb
∫
= 7 TeV, s CMS Preliminary,> 35 GeV, |y| < 4.7 T
P
Mueller-Navelet dijets
y Δ
0 1 2 3 4 5 6 7 8 9
2 /C3 C 0.4 0.5 0.6 0.7 0.8 0.9 1 1.1 DATA Pythia 6 Z2 Pythia 8 4C Herwig++ 2.5
-1 Ldt = 5 pb
∫
= 7 TeV, s CMS Preliminary,> 35 GeV, |y| < 4.7 T
P
Mueller-Navelet dijets
y Δ
0 1 2 3 4 5 6 7 8 9
2 /C3 C 0 0.2 0.4 0.6 0.8 1
DATA Sherpa 1.4 Cascade 2 BFKL NLL+
-1 Ldt = 5 pb
∫
= 7 TeV, s CMS Preliminary,> 35 GeV, |y| < 4.7 T
P
Mueller-Navelet dijets