Published by Faculty of Science, Kaduna State University
Identifying Recovery Patterns from Resource Usage Data of Cluster Systems
IDENTIFYING RECOVERY PATTERNS FROM RESOURCE USAGE
DATA OF CLUSTER SYSTEMS
Nentawe Gurumdimma 1, Gideon Dadik Bibu2, Desmond Bala Bisandu3, Mammuan Titus Alams4
1,2,3,4Department of Computer Science, University of Jos, Nigeria
Authors Email Addresses: [email protected], [email protected], [email protected], [email protected]
ABSTRACT
Failure of Cluster Systems has proven to be of adverse effect and it can be costly. System administrators have employed divide and conquer approach to diagnosing the root-cause of such failure in order to take corrective or preventive measures. Most times, event logs are the source of the information about the failures. Events that characterized failures are then noted and categorized as causes of failure. However, not all the ’causative’ events lead to eventual failure, as some faults sequence experience recovery. Such sequences or patterns constitute challenge to system administrators and failure prediction tools as they add to false positives. Their presence are always predicted as “failure causing“, while in reality, they will not. In order to detect such recovery patterns of events from failure patterns, we proposed a novel approach that utilizes resource usage data of cluster systems to identify recovery and failure sequences. We further propose an online detection approach to the same problem. We experiment our approach on data from Ranger Supercomputer System and the results are positive.
Keywords: Change point detection; resource usage data; recovery sequence; detection; large-scale HPC systems
INTRODUCTION
In cluster systems, faults observed may not always lead to a system failure. However, whenever it does, such failure is costly, due to system downtime. In order t to have a glimpse at the cause these failures, system administrators most times rely on the logs produced by these systems. Also, these logs are useful in inferring the root causes of such failures and for taking corrective or preventive measures. In Oliner and Aiken, (2011), the authors pointed out that in reality, there exists no description of a correct system. This is true as so many components are involved and system administrators are probably unaware of some happenings within the system, sometimes, until a problem is noticed. Root cause analysis has been employed to trace causes of such failures, most times from the logs. Work by Gainaru et al., (2011; 2012) characterized some of these faults based on frequency of occurrence using signal processing. They came up with a good way of identifying patterns of these faults from error messages/logs where they are either classified as silent, noisy or periodic signals. The characterization gives an insight to how some failures behave. The presence of certain error message types characterizes some particular failures. That is, their presence is an indication of imminent failure. Some of these errors result in spurious logging of messages. For example, a network failure could result in spurious logging of “communication failed” events. Some failures may behave differently in terms of the symptomatic messages logged. Another example is memory
problem; it can be characterized by chatty error messages. The anticipated failure as a result of these faults and errors may eventually not occur. This happens for network fault if a recovery is completed Chuah et al., (2010; 2011), likewise memory errors which may be corrected by error correcting code (ECC), even though, from the event logs, there is every indication that these faults will result in failure (Makanju et al., 2010a); Gainaru et al., 2012) Most times, it is very difficult for system administrators to know if such faults would eventually lead to the failure or not. Previous work Gurumdimma et al., (2015) on detecting faults using logs has shown that this problem increases detection false positives.
In this work, we want to identify those sequences which, from its patterns of events are indicative of failure, but, however, do not end up causing any failure. This work is similar to the work in Gurumdimma and Jhumka, (2017), however, in this, we further propose an online method of identifying these recovery patterns. We refer to these patterns as recovery sequences while those that end in failure as failure sequences. Event logs or error messages do not provide sufficient insight to deduce if such sequences end up in failure or not. Additional information may be required. We propose a novel approach based on change point detection that detects such sequences using resource usage data. Our detection approach demonstrates that re-source usage/utilization data can be useful in identifying recovery sequences with fmeasure of 64% when applied on resource usage data of Ranger Supercomputer System.
The contributions of this paper are as follows: (1) We propose a new way of utilizing Resource usage/utilization data to identify recovery sequences among other failure sequences. (2) We propose a new method that employs change point detection (CPD) to detect points of anomalous resource usage within the sequence to detect recovery sequence and highlights the effectiveness and the limitations of this method. (3) We proposed an online approach to detecting recovery patterns.
The rest of the paper is organized as follows: .We give an overview of related work from this field in Section II, Section III present an overview of the Ranger supercomputer and the resource usage data used. Section IV presents the methodology employed, discusses how we transform our data then we explain change point detection and the detection algorithm. We proceed to explain how we performed our experiments, the metrics used for evaluation and then discuss the results in Section V and conclude in Section VI.
Fu
ll L
en
gt
h Rese
ar
ch
Identifying Recovery Patterns from Resource Usage Data of Cluster Systems Related Work
Gainaru et al., (2012) effectively used signal processing method to analyses systems behaviour, considering the events as signals. They are able to characterize events and show that normal and faulty behaviours are different for different event types. They, however, dis-covered that some failure behaviour is similar to those that are not, an example is memory errors which behaves just as failure only that it is eventually corrected by ECC. They used the event logs to perform this analysis. In our approach, we focus more on the resource usage data since form the event logs, normal and failure events can have similar behaviour. We employ an unsupervised detection method to identify abnormal change in the use of the resources in the system. Other works that use signal processing approach includes (Giffin et al., 2002; Gao et al., 2004; Mutz et al., 2006; Oliner et al., 2008; Oliner and Aiken, 2011). The work of Oliner and Aiken, (2011) established system components that affect an unusual behaviour or anomaly in system. The approach converted log entries into real-valued functions of time called “anomaly signals”. This measurement encodes deviation from the expected behaviour. The approach provides an understanding to how component interaction can point to and used for detecting system problems. Converting the logs into anomaly signals requires an understanding of normal system. This is one problem because it is difficult to obtain the normal behaviour in most cases. Our approach is different as it does not require converting the data into already known anomaly signals using resource usage data.
Another method which combines both event logs and resource usage data to detect causes of failure is presented in Chuah et al., (2013) and Niyazi et al., (2017). The former combine both event logs and usage logs to diagnose root-cause of some intermittent faults. Applying statistical correlations, they found out that events correlated to” soft lockup failures are indeed responsible for those failures. The later model of the system behavior is in such a way that the performance is monitored online (Amanda, 2012). We use similar resource usage data; however, we seek to see those sequences that, even though, highly correlated with failures, will not end in failure. Our methods can also be used for detecting faults in systems. In Gupta et al., (2017), a survey failure in HPC systems was done. The work looked at different systems and performed failure analysis of those systems. Their findings corroborated that of approaches explained earlier.
Other approaches that leverage information content of logs to find alerts in systems are (Oliner and Stearley, 2007; Oliner et al., 2008; Makanju et al., 2010a; Makanju et al., 2010b). In formativeness of logs are captured with the notion called ”Nodeinfo”. It obtains the informativeness of a node-hour by using the log entropy weighing scheme for node term weights. Our previous work Gurumdimma et al., (2015) on detection of failure patterns relied only on the entropy and behaviour of nodes and similar sequences to characterize a failure sequence. As mentioned earlier, these approaches are reported to contain false positives due the normal sequences that behave just as abnormal ones (Wayne, 2000; Liang et al., 2006). We believe that resource usage data will contain more accurate state of the system in terms of how resources are used when the system is normal or abnormal (Xu et al., 2009; Xiaoyu et al., 2012). Therefore, we employ a detection method that relies on change point detection
and capture how these resources are used to detect recovery sequences. In this work, we further proposed an online approach to detecting the recovery patterns.
SYSTEM AND DATA
This section details the cluster system we focus on in our research. We subsequently explain the data (resource usage data), its structure and how it is obtained.
A. Ranger Supercomputer
A cluster system contains a set of nodes, jobs or tasks, production time, job scheduler and sets of software components (e.g. parallel file system). The job scheduler allocates jobs to nodes to execute within a certain production time, and all the components involved write messages to a writing container. This is a common model for most of the cluster vendors like Ranger, Cray, IBM etc. We explain the Ranger Supercomputer of Texas Advance Computing Centre for our case study.
The Ranger supercomputer Hammond et al., (2010) is a cluster consisting of 4,048 nodes of which 3,936 are compute nodes and 78 are Lustre File-system nodes. These nodes are connected via a high-speed Infiniband network. Each node generates its own log messages which are all sent to central logging system. Each node of a Ranger supercomputer runs a Linux Operating System kernel. Also, each node maintains its synchronization clock and the Sun Grid Engine powers its job scheduling process and resource management (Zhiling et al., 2010).
Ranger supercomputer runs a Lustre file storage system. Lustre file-system is an object-based high performance network file system that performs excellently for high throughput I/O tasks. It is a widely utilized file system in the supercomputing world. The file system is made up of:
i Meta -Data Server (MDS) that stores information like
permissions, file names, directories etc. The MDS equally manages file requests from lustre clients.
ii Object Storage Server (OSS) which provides file I/O
services. It also treats network requests from lustre clients. iii Lustre Clients: The lustre clients includes visualization
nodes, computational nodes, login nodes running the lustre paving way for file system monitoring.
The Ranger supercomputer runs TACC stats Hammond, (2011), I/O performance monitoring software. It monitors and records the resource usage by jobs on each node. The software runs on each node and the data collected on each of the nodes are logged centrally and synchronized.
B. Resource Usage Data
Resource usage data are collected by TACC stats Hammond, (2011) at Texas Advanced Computing Center (TACC). Basically, it is a job-oriented and logically structured version of the conventional Sysstat system performance monitor. TACC stats record the hardware performance monitoring data, Lustre file-system operation counts and InfiniBand device usage. The resource usage data col-lector is executed on every node and is mostly executed both at the beginning and end of a job via the batch scheduler or periodically via cron (Oliner et al., 2010).
Each stats file is self-explanatory and it contains a multi-line
Identifying Recovery Patterns from Resource Usage Data of Cluster Systems
header, a schema descriptor and one or more record groups. Each stats file is identified by a header which contains the version of TACC stats, the name of the host and its uptime in seconds. An example of a stats file header is shown, for clarity:
$tacc_stats 1.0.2
$hostname i101-101.ranger.tacc.utexas.edu $uname Linux x86_64 2.6.18-194.32.1.el5 _TACC #18 SMP
Mon Mar 14 22:24:19 CDT 2011 $uptime 4753669
A schema descriptor for Lustre network usage parameters is seen below:
!lnet tx_msgs,E rx_msgs,E rx_msgs_dropped, E tx_bytes,E,U=B rx_bytes E,U=B ... lnet - 90604803 95213763 1068 808972316287 4589346402748 ...
A schema descriptor has the character! Followed by the type, and followed by a space separated list of elements or counters. Each counter consists of a key name such as tx msgs which is followed by a comma-separated list of options. These options include: (1) E meaning that the counter is an event counter, (2) C signifying that the value is a control register and not a counter, (3) W =< BIT S > means that the counter is < BIT S > wide (32-bits or 64-bits), and (4) U =< ST R > signifying that the value is in units specified by < ST R > (e.g.: U=B where B stands for Bytes.). From the schema descriptor above, lnet - 90604802 gives records of the number of messages transmitted in the Lustre network.
TACC stats is open sourced and can be downloaded1 and
installed on Linux-based clusters. A list of the counters is shown in Table I.
METHODOLOGY
A. Methodology Overview
Resource utilization data or usage data contains how much resources are being used by a particular job on a https://github.com/TACC/tacc stats
Table I: List of 96 Elements of Resource Usage Data
Type Element Quantity
read bytes, write bytes, direct read, direct write, dirty pages hits,
Lustre dirty pages misses, ioctl, open, close,
mmap, seek, fsync, setattr, truncate, 23
/work
flock, getattr, statfs,alloc node, setxattr, getxattr, listxattr, removexattr, inode permission
read bytes, write bytes, direct read, direct write, dirty pages hits,
Lustre
dirty pages misses, ioctl, open, close,
mmap, seek, fsync, setattr, truncate, 23
/share
flock, getattr, statfs, alloc node, setxattr, getxattr, listxattr, removexattr, inode permission
read bytes, write bytes, direct read, direct write, dirty pages hits,
Lustre dirty pages misses, ioctl, open, close,
mmap, seek, fsync, setattr, truncate, 23
/scratch
flock, getattr, statfs, alloc node, setxattr, getxattr, listxattr, removexattr, inode permission
Lustre tx msgs, rx msgs, rx msgs
dr op pe d,
6
/networ
k tx bytes, rx bytes, rx bytes
dro pp ed
pgpgin, pgpgout, pswpin, pswpout, pgalloc normal, pgfree, pgactivate, pgdeactivate, pgfault,
Virtual pgmajfault pgrefill normal,
pgsteal normal, pgscan kswapd normal, 21
memor
y
pgscan direct normal, pginodesteal, slabs scanned,kswapd steal,
kswapd inodesteal,
pageoutrun, allocstall pgrotated
particular node. This data could provide us with what is happening within the system regarding how resources are being utilized (Berrocal et al., 2014). For example, a high or low usage of memory or network resources or a sudden change in page swap rate could point to an abnormal behaviour which may lead to failure. In essence, an abnormal use of resources is a pointer to imminent failure (Xiang et al., 2011).
We conjecture that a system which experienced a successful recovery from network error or memory error corrected by ECC may behave differently in its resource usage. Even though error messages may not provide a clear indication that failure will eventually occur, resource usage data within such time could provide a hint. Usage data within such time window could show unusual use/utilization, however, may eventually be normal if it does not end in failure due to successful recovery. Normal behaviour towards time of expected failure could point to successful recovery.
In this work, we detail steps taken to identify sequences with successful recovery from error by detecting points of unusual or abnormal change within the sequence of resource utilization data for which failure is expected or has occurred. We utilized the idea of change point detection (CPD) to perform this. But before then, the data is first transformed to a format that can be used easily by the algorithm.
B. Data Transformation
Resource Usage data as earlier explained contains how much resources are used on a particular node as captured by different resource counters (see Table I). Each counter captures the amount of resources they are associated with. For example, a network counter (rx mgs dropped) captures the amount of messages dropped by a particular node.
Hence a line of logged usage data contains all the counters and their usage values captured within certain period. Let us call these
Identifying Recovery Patterns from Resource Usage Data of Cluster Systems
lines of logged usage data as events, ei. These events are streams of time series data. For the purpose of our research, we capture these events within given time window, tw, called subsequence, xi. A sequence, S = x1, x2, …, xn, is then a stream
of subsequences as illustrated in Figure 1. It is worth noting here that the choice of tw may be dependent on the time to failure of a
fault and component. A reasonable small time is chosen to avoid capturing different usage patterns within a subsequence and also big enough for such subsequence to be informative.
S= {e1, e2, e3, e4, …, en-2, en-1, en}
x1 x2 xn
Figure 1: Sequence of resource usage data
We extract each xi as a vector of the sum of resource usage for
each counter. For example, given subsequence x1, with counter tx
bytes: 267, read bytes: 302, etc, then the vector x1= [267 302 ...].
Hence, the amount of resources used on nodes ni in
subsequence xi are summed up for each counter. These values
are then scaled to values between 0 and 1, forming a probability distribution. This is because in our change point detection algorithm, it accepts the data as probability distribution and this also becomes easier to handle and explained. We then construct a matrix of the sequence where the subsequence forms row vectors. Hence, given k number of counters and n subsequences, the matrix M is as given in Figure 2.
Figure 2: Data matrix M with n subsequences of S, where xn;k is
the value of counter k in subsequence n.
From the matrix M, a vector representing S is formed by summing the values of each counter in a subsequence divided by the number of counters. That is, subsequence x1 = xi, 1 + xi, 2 + … + xi, k divided by k (counter size). This is done for all the n
subsequences. Hence, the vector forms the input to the detection algorithm.
C. Change Point Detection
The objective of anomaly detection is to find a data point that behaves differently from others. The anomalousness now depends on the field of application where among many other data points, is a rare behaviour. Change Point Detection (CPD) (Liu et al., 2013) and Amanda, (2012) is an anomaly detection method where it detects ”drastic change” observed from a sequence distribution. These points of drastic change are possible anomalies. Two classes of CPD are commonly used depending on the problem; they are: Real-time change-point detection (Liu et al., 2013) and Retrospective change-point detection. The former
deal with detecting real-time changes in applications, a good example is responses in robots. The later deals with applications with longer response time and deals with retrospective data (Lakhina et al., 2005).
In this work, we employ retrospective CPD to detect sudden changes in the utilization of resources by a super-computer system. Such sudden changes points to abnormal behaviour in the system. For example, sudden peak in memory or network resources usage could signal presence of faults and/or errors.
Why CPD approach? Resource usage data are collected and logged as streams of time series data which is formed by the probability distributions of the resources used on a node by running jobs. Therefore, the level at which resources are utilized may vary with time and this changes can be captured using CPD. This is our motivation for using change point detection. We will discuss briefly two Retrospective CPD approaches we employed in our work.
1) Cumulative Sum Change-Point Detection: Cumulative
Sum (CuSUM) CPD approach Wayne, (2000) and Amanda, (2012), is based on the fact that sudden change in parameter corresponds to a change in the expected value of log-likelihood ratio. From the name, it tracks the cumulative sums of the differences between the values and the average. At points where the values are above average, the cumulative sum steadily increases. Therefore this method involves finding the mean and its difference with observation values.
Given S = x1, x2, …, xn, (see Figure 1), we first initialize the
cumulative sum, cS0 = 0 and obtain the mean of S (the row
vectors), given as x,
cSi+1 = cSi + (xi+1 - x) (1)
for all i = 1… n.
Abrupt change points are those points with cSi values above
threshold th.
2) Divergence-Based Dissimilarity Measure: In this
approach, a dissimilarity measure is introduced. We used Kullback Divergence (KLD) measure (Liu et al., 2013; Sandhan et al., 2013, Bisandu et al., 2018).
The Kullback Divergence of two sequence distributions x and y (for simplicity, we assume x = xi and y = xi+1) is given by:
where i is the index of probability values of vectors x and y.
Figure 3 shows the CPD charts of sequences that end in failure and one that recover. Clearly form the chart, we noticed that low values change points for the recovery sequences as time progresses towards failure. This is low compared to failure sequence. This gives us an idea of how these two sequences
Identifying Recovery Patterns from Resource Usage Data of Cluster Systems
could behave based on how the resources are being used (during failure, recovery). We utilized this for our detection algorithm explained in the next section.
Figure 3: Graph showing detection performance (F-measure) of both CPD methods used
D. Detection of Recovery Sequences
We detect multiple change points within a failure sequence. We conjecture that sequences that eventually end in failure are likely to contain change points and/or a sustain presence of such points leading up to time of failure. Meanwhile, sequences that eventually experience recovery may not contained many change points or sustained change points leading up to expected time of failure. These sequences may be characterized by relatively normal resource utilization if there is a successful recovery from
faults. Given observations of usage data xi within a sequence S,
that is, S = x1; x2; :::; xn where observations, xi, are made within a
time window and time of occurrence of xi, tx1 < tx2 < … < txn .
Then, we conjecture that for any failure sequence s, as the time tends towards time of failure, abnormal use of the resources can be noticed throughout the sequence and it is likely to be sustained across tx1 to txn. However, a recovery sequence will likely
experience normal behaviour or normal resource usage eventually. This implies that it may likely contain less change points as it approaches predicted failure time.
Algorithm 1: Sequence Detection
1: procedure DETECT(S; th)
2: cp = null . keeps the list of points above
threshold
3: xi 2 S . vectors (subsequences) of S
4: for i = 1 to jSj 1 do 5: p(xi) =CPD(xi; xi+1)
6: if (p(xi) >= th then . th is change point
threshold
7: add point (i) to list of change points (cp)
8: end if
9: end for
10: if (if there are more than a point i greater than
midpoint) then
11: return Failure
12: else
13: return Recovery
14: end if
15: end procedure
end
From Algorithm 1, we detect multiple change points within the sequence. We keep the points which are seen as change points for the sequence. The sequence with change points occurring beyond the midpoint of the sequence will likely end in failure as we earlier explained.
E. Online Detection of Recovery Sequences
Online approach to identifying recovery patterns
In this section, we propose an approach for an online detection of recovery patterns. The advantages of having the online version cannot be overemphasized. It saves system administrators from having to activate failure recovery or mitigation processes.
The resource usage logs are periodically accessed as they are logged for analysis. When a failure is predicted to occur, failure recovery detection can be activated. In the algorithm, the sequence of events is accessed within a given time; normal approach for change point detection is applied on the first two time windows accessed. Subsequent time subsequences are then captured as they are logged and compared with previous ones. A significant deviation from the previous ones signifies a change in the pattern. However, we hypothesis that a failure pattern should consistently show similar pattern, any deviation may indicate a recovery. The approach is shown in Algorithm 2.
Algorithm 2: Online Detection
1: procedure DETECT
2: x1=Obtain first data with specified time window
3: x1 =transform(x1)
4: x2 =Subsequent data within given time window
5: x2 =transform(x2) . Convert to matrix
6: cp =CPD(x1; x2)
7: for i = 1 to n do
8: xi = Obtain next data
9: cpi =CPD(x2; xi)
10: Ri = jcpi cpj
11: if (Ri > ) then
12: Suspicions + +
Identifying Recovery Patterns from Resource Usage Data of Cluster Systems
13: end if
14: if Suspicious >= 1 then
15: return Recovery
16: else
17: return Failure
18: end if
19:
end
EXPERIMENTS AND RESULTS
The aim of this research is to develop a methodology to detect sequences that recovered from faults and did not end in failure in Ranger supercomputer system. To achieve this aim, we utilized the resource usage data of Ranger not the error logs. Our approach is then evaluated through experiments conducted on the resource usage data of the Ranger Supercomputer from the Texas Advanced Computing Center (TACC) at the University of Texas at Austin2 (Lee et al., 2013).
As earlier explained in Section III, the resource usage data were collected using TACC Stats Hammond et al., (2010) that takes snapshots of utilization data of the 96 counters, this is done in ten-minute interval . Jobs generate their resource usage data on a particular node, which are then logged to the file system. The data are logged by each node through a centralized message logging system. The logs are combined and interleaved in time (Xu et al., 2008).
We evaluate the approach on four weeks of resource us-age data (32GB). These data were collected for the month of March 2012. We extracted the 96 elements or counters from the resource usage data as seen in Table I. From this data, we extracted failure sequences that have been established by the experts. From the data, more failure actually took place within the first and second week of March 2012 with few occurring in the third and fourth weeks. Among these failure sequences, are those that eventually did not end up in failure, but experienced recovery. Note that, the event/error logs was used by the experts to determine failure sequences based on the root-case analysis they did. We only extracted the corresponding resource usage data within the same time established as failure sequences from the error logs. We had a total of 660 sequences of which 182 are real failure sequences and 72 recovery sequences, the remaining are normal sequences.
A. Evaluation Metrics
We employ the widely used sensitivity, specificity and fmeasure metric to evaluate the approach. Sensitivity, also called true positive rate or recall measures the actual proportion of correctly detected recovery sequences to the total number of sequences as expressed in Equation 3. Specificity, or true negative rate, measures the proportion of complete failure sequences which are detected as recovery sequences among all faulty sequences as seen in Equation 4. Fmeasure here is synonymous with the usual fmeasure in information retrieval; however, in this case, it is the harmonic mean of sensitivity and specificity (see Equation 5).
Since neither of sensitivity or specificity can be discussed in isolation, fmeasure which combines the two providing us with balanced detection accuracy is used.
B. Results
In the experiments, we evaluate our approach under various detection threshold values. The values of detection threshold, th is varied to obtain better value for both sensitivity and specificity. We show results and discuss for the two CPD methods (CuSUM, KLD) used.
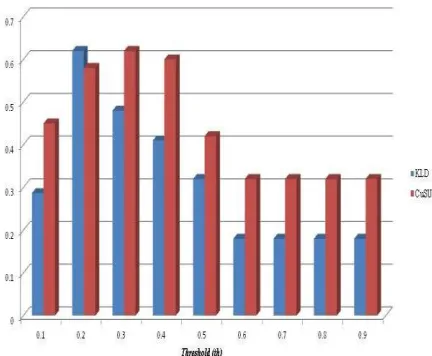
From the results seen in Figure 4 for using CuSUM approach, the true positive rate (sensitivity) performs low at th = 0.1; 0.2. It consistently increased (reaching a maximum sensitivity of about 90%) as the value of th is increased. This shows that the more we increase the value (th) for which we decide if a point is indeed a change point or not, the better the detection of the recovery sequences. It achieved a highest sensitivity at th = 0.7, which remain constant for higher values of th. Likewise, the specificity is highest at lower values of th as expected and reduces from 70% to 20% at th = 0.6 and remains so for higher values. These results demonstrate that we can achieve good detection of recovery sequences when we use CuSUM change point detection method. However, it is much better if we can achieve better results with less false positives and false negatives. For this approach (CuSUM), a better result (fmeasure) is obtained at threshold th = 0.3 as seen in Figure 6. It achieved about 63% detection.
Figure 4: Result showing accuracy of detecting recovery sequences among failure sequences using Cumulative Sum change point detection and varying values of detection threshold,
th.
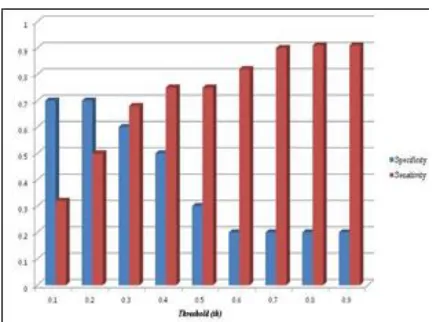
Similarly, using KLD method (see Figure 5), the results are similar to CuSUM. A highest sensitivity of about 84% is observed when
Identifying Recovery Patterns from Resource Usage Data of Cluster Systems
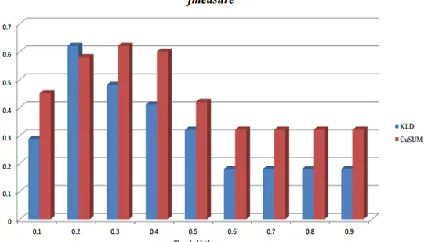
th = 0.5 and more. The specificity on the other hand, decreases with increase in th. The lowest specificity (10%) is obtained from th = 0.6 and remained so for higher values. Comparatively, CuSUM seems to slightly perform better over all the thresholds used. However, looking at the fmeasure in Figure 6, KLD performed high with detection of 64% at th = 0.2. This result is almost similar with the CuSUM approach (1% difference), the only difference is that they are achieved at different detection thresholds.
Figure 5: Results showing accuracy of detecting recovery sequences among failure sequences using KLD change point detection, and varying values of detection threshold, th.
Figure 6: Result showing fmeasure of detecting recovery sequences among failure sequences at varying values of detection threshold, th.
Based on these results, it is very possible to achieve a good detection of faulty sequences which did not end in failure (recovery sequences) from usage data. Even though, this is not the best performance expected, however, it is a good starting point for exploring the use of resource utilization data of cluster systems to detection both failure sequences and recovery
sequences applying change pointthe online approach, the data is
collected within some time window as the system logs them. These failure patterns are identified on the fly as data about the usage of resources are collected. Hence the result of the offline version can be similar with the online version. An issue we envisage is that the time of execution of the algorithms might differ.
Conclusion
We proposed an approach for recovery sequence detection in large-scale distributed systems. The approach makes use of resource usage data to detect the recovery sequence among other failure sequences. The method leverages the fact that unusual use of resources by the systems could point to impending failure, to detect recovery patterns. Change point detection is employed to determine the points of anomaly within a sequence. These points of anomalous behaviour points to a recovery or failure sequence. We proposed a detection algorithm based on these parameters to determine if a faulty will eventually recover or end in failure. We further proposed an online version of the approach. We evaluated our methodology on the resource usage data from the Ranger supercomputer and the results has shown to detect recovery sequences with good accuracy. It achieved an fmeasure of 64%.
As a future work, we intend to investigate the performance of this methodology on data from different cluster systems.
Acknowledgments
We thank the Texas Advanced Computing Center (TACC) for providing the Ranger message logs.
REFERENCES
Amanda, S., 2012. A review of anomaly detection with focus on changepoint detection (Master’s Thesis). Department of Mathematics , Swiss Federal Institute of Technology Zurich. Berrocal, E., Li, Y., Wallace, S., Papka, M.E., Zhiling, L., 2014.
Exploring void search for fault detection on extreme scale systems, in: Cluster Computing (CLUSTER), 2014 IEEE
International Conference On. pp. 1–9.
https://doi.org/10.1109/CLUSTER.2014.6968757
Bisandu, D.B., Prasad, R. and Liman, M.M. 2018. Clustering
news articles using efficient similarity measure and
N-grams, Int. J. Knowledge Engineering and Data
Mining,Vol. 5, No. 4, pp.333–348.
Chuah, E., Arshad, J., Sai, N., HammonD, J., Browne, J.C., Barth, B., 2013. Linking Resource Usage Anomalies with System Failures from Cluster Log Data, in: Reliable Distributed Systems (SRDS), 2013 IEEE 32nd International Symposium On. pp. 111–120. https://doi.org/10.1109/SRDS.2013.20 Chuah, E., Lee, G., Tjhi, W., Kuo, S., Hung, T., Hammond, J.,
Minyard, T., Browne, J.C., 2011. Establishing Hypothesis for Recurrent System Failures from Cluster Log Files, in: Proceedings of the 2011 IEEE Ninth International Conference on Dependable, Autonomic and Secure Computing, DASC ’11. IEEE Computer Society, Washington, DC, USA, pp. 15–22.
Chuah, E., Shyh-hao, K., Hiew, P., Tjhi, W.C., Lee, G., Hammond, J., Michalewicz, M.T., Hung, T., Browne, J.C., 2010. Diagnosing the root-causes of failures from cluster log files, in: 2010 International Conference High Performance Computing (HiPC). pp. 1–10.
Gainaru, A., Cappello, F., Snir, M., Kramer, W., 2012. Fault Prediction Under the Microscope: A Closer Look into HPC Systems, in: Proceedings of the International Conference on High Performance Computing, Networking, Storage and Analysis, SC ’12. IEEE Computer Society Press, Salt Lake City, Utah, pp. 77:1–77:11.
Gainaru, A., Cappello, F., Trausan-Matu, S., B. Kramer, 2011. Event Log Mining Tool for Large Scale HPC Systems, in: Proceedings of the 17th International Conference on Parallel
Identifying Recovery Patterns from Resource Usage Data of Cluster Systems
Processing - Volume Part I, Euro-Par’11. Springer-Verlag, Bordeaux, France, pp. 52–64.
Gao, D., Reiter, K.M., Song, D., 2004. Gray-box Extraction of Execution Graphs for Anomaly Detection, in: Proceedings of the 11th ACM Conference on Computer and Communications Security, CCS ’04. ACM, Washington DC,
USA, pp. 318–329.
https://doi.org/10.1145/1030083.1030126
Giffin, T.J., Jha, S., Miller, P.B., 2002. Detecting Manipulated Remote Call Streams, in: Proceedings of the 11th USENIX Security Symposium. USENIX Association, Berkeley, CA, USA, pp. 61–79.
Gupta, S., Patel, T., Engelmann, C., Tiwari, D., 2017. Failures in Large Scale Systems: Long-term Measurement, Analysis, and Implications, in: Proceedings of the International Conference for High Performance Computing, Networking, Storage and Analysis, SC ’17. ACM, New York, NY, USA, pp. 44:1–44:12. https://doi.org/10.1145/3126908.3126937 Gurumdimma, N., Jhumka, A., 2017. Detection of Recovery
Patterns in Cluster Systems Using Resource Usage Data, in: 2017 IEEE 22nd Pacific Rim International Symposium on
Dependable Computing (PRDC). pp. 58–67.
https://doi.org/10.1109/PRDC.2017.17
Gurumdimma, N., Jhumka, A., Liakata, M., Chuah, E., Brwone, J., 2015. Towards Detecting Patterns in Failure Logs of Large-Scale Distributed Systems, in: Parallel & Distributed Processing Symposium Workshops (IPDPSW), IEEE International. IEEE.
Hammond, J., 2011. Tacc_stats: I/o performance monitoring for the intransigent, in: In Invited Keynote for the 3rd IASDS Workshop.
Hammond, L.J., Minyard, T., Browne, J., 2010. End-to-end framework for fault management for open source clusters: Ranger, in: Proceedings of the 2010 TeraGrid Conference, TG ’10. ACM, Pittsburgh, Pennsylvania, pp. 9:1–9:6. Lakhina, A., Crovella, M., Diot, C., 2005. Mining Anomalies Using
Traffic Feature Distributions. SIGCOMM Comput. Commun. Rev. 35, 217–228. https://doi.org/10.1145/1090191.1080118 Lee, Y., Yeh, Y., Wang, F.Y., 2013. Anomaly Detection via Online Oversampling Principal Component Analysis. Knowl. Data
Eng. IEEE Trans. On 25, 1460–1470.
https://doi.org/10.1109/TKDE.2012.99
Liang, Y., Zhang, Y., Jette, M., Anand, S., Sahoo, R., 2006. BlueGene/L Failure Analysis and Prediction Models, in: Dependable Systems and Networks, 2006. DSN 2006.
International Conference On. pp. 425–434.
https://doi.org/10.1109/DSN.2006.18
Liu, S., Yamada, M., Collier, N., Sugiyama, M., 2013. Change-point Detection in Time-series Data by Relative Density-ratio
Estimation. Neural Netw 43, 72–83.
https://doi.org/10.1016/j.neunet.2013.01.012
Makanju, A., Adetokunbo, A.O., Zincir-Heywood, N.A., Milios, E.E., 2010a. An Evaluation of Entropy Based Approaches to Alert Detection in High Performance Cluster Logs, in: Proceedings of the 7th International Conference on Quantitative Evaluation of SysTems(QEST). IEEE, Williamsburg, USA.
Makanju, A., Adetokunbo, A.O., Zincir-Heywood, N.A., Milios, E.E., 2010b. Fast Entropy Based Alert Detection in Supercomputer Logs, in: PFARM ’10: Proceedings of the 2nd DSN Workshop on Proactive Failure Avoidance,
Recovery and Maintenance (PFARM). IEEE, Chicago, USA. Mutz, D., Valeur, F., Vigna, G., C. Kruegel, 2006. Anomalous
System Call Detection. ACM Trans Inf Syst Secur 9, 61–93. https://doi.org/10.1145/1127345.1127348
Niyazi, S., Varun, C., Abani, P.K., 2017. Tracking System Behavior from Resource Usage Data, in: 2017 IEEE International Conference on Cluster Computing, CLUSTER 2017, Honolulu, HI, USA, September 5-8, 2017. pp. 410– 418. https://doi.org/10.1109/CLUSTER.2017.70
Oliner, A., Stearley, J., 2007. What Supercomputers Say: A Study of Five System Logs, in: International Conference on Dependable Systems and Networks, 2007. DSN ’07. 37th Annual IEEE/IFIP. pp. 575–584.
Oliner, A.J., Aiken, A., 2011. Online detection of multi-component interactions in production systems, in: Dependable Systems Networks (DSN), 2011 IEEE/IFIP 41st International
Conference On. pp. 49–60.
https://doi.org/10.1109/DSN.2011.5958206
Oliner, J.A., Aiken, A., Stearley, J., 2008. Alert detection in system logs, in: Data Mining, 2008. ICDM’08. Eighth IEEE International Conference On. IEEE, pp. 959–964.
Oliner, J.A., Kulkarni, V.A., Aiken, A., 2010. Using correlated surprise to infer shared influence, in: Dependable Systems and Networks (DSN), 2010 IEEE/IFIP International
Conference On. pp. 191–200.
https://doi.org/10.1109/DSN.2010.5544921
Sandhan, T., Srivastava, T., Sethi, A., Jin, C.Y., 2013. Unsupervised learning approach for abnormal event detection in surveillance video by revealing infrequent patterns, in: Image and Vision Computing New Zealand (IVCNZ), 2013 28th International Conference Of. pp. 494– 499. https://doi.org/10.1109/IVCNZ.2013.6727064
Wayne, T.A., 2000. Change-Point Analysis: A Powerful New Tool For Detecting Changes.
Xiang, R., Huaimin, W., Dianxi, S., Zhenbang, C., Hua, C., Qi, Z., Tingtao, S., 2011. Identifying faults in large-scale distributed systems by filtering noisy error logs, in: Dependable Systems and Networks Workshops (DSN-W), 2011 IEEE/IFIP 41st International Conference On. pp. 140–145. https://doi.org/10.1109/DSNW.2011.5958800
Xiaoyu, F., Rui, R., Jianfeng, Z., Wei, Z., Zhen, J., Gang, L., 2012. LogMaster: Mining Event Correlations in Logs of Large-Scale Cluster Systems, in: Reliable Distributed Systems (SRDS), 2012 IEEE 31st Symposium On. pp. 71–80. https://doi.org/10.1109/SRDS.2012.40
Xu, W., Huang, L., Fox, A., Patterson, D., Jordan, I.M., 2009. Detecting large-scale system problems by mining console logs, in: Proceedings of the ACM SIGOPS 22nd Symposium on Operating Systems Principles, SOSP ’09. ACM, Big Sky, Montana, USA, pp. 117–132.
Xu, W., Huang, L., Fox, A., Patterson, D., Jordan, M., 2008. Mining console logs for large-scale system problem detection, in: Workshop on Tackling Computer Problems with Machine Learning Techniques (SysML), San Diego, CA.
Zhiling, L., Ziming, Z., Yawei, L., 2010. Toward Automated Anomaly Identification in Large-Scale Systems. Parallel Distrib. Syst. IEEE Trans. On 21, 174–187.