Available online on 25.08.2019 at http://jddtonline.info
Journal of Drug Delivery and Therapeutics
Open Access to Pharmaceutical and Medical Research© 2011-18, publisher and licensee JDDT, This is an Open Access article which permits unrestricted non-commercial use, provided the original work is properly cited
Open Access
Research Article
Formulation Development and Evaluation of Floating Microsphere of
Acyclovir
Shweta Jalodiya
1*, M.K. Gupta
1and Neetesh K. Jain
21 Department of Pharmaceutics, Oriental University, Indore -India
2 University Institute of Pharmacy, Oriental University, Indore -India
ABSTRACT
The guanine derivative antiviral drug acyclovir (ACV) is one of the oldest molecules laying successful market until date, being commercially available in various dosage forms for oral, topical and parenteral administrations. Clinical application of this drug is superior to new antiviral agents due to its potential values such as suppression of recurrence, safety profile, minimal drug interactions and being inexpensive. ACV is slightly water soluble, less permeable and poorly bioavailable, yet more potential antiviral molecule. The present study involves preparation and evaluation of floating microspheres using ACV as a model drug for improving the drug bioavailability by prolongation of gastric retention time. Ethyl cellulose, hydroxyl propyl methyl cellulose microspheres loaded with ACV were prepared by solvent diffusion evaporation method. The microspheres had smooth surfaces with free-flowing and good-packing properties. The yield of the microspheres (F1-F6) was range from 62.23±0.85 to73.32±0.65% and ethyl cellulose microspheres entrapped the maximum amount of the drug. Scanning electron microscopy confirmed their hollow structures with sizes in 198.3 nm. The prepared microspheres (F3) exhibited prolonged drug release and percentage buoyancy was found to 76.65±0.52. The formulated batches were evaluated for percentage yield, particle size measurement, flow properties, percent entrapment efficiency, swelling studies. The formulations were subjected to stability studies and In-vitro release and release kinetics data was subjected to different dissolution models. It was concluded that developed floating microspheres of ACV offers a suitable and practical approach for prolonged release of drug over an extended period of time and thus oral bioavailability, efficacy and patient compliance is improved.
Keywords: Acyclovir, Solvent diffusion evaporation method, Ethyl cellulose, Hydroxyl propyl methyl cellulose
Article Info:Received 24 June 2019; Review Completed 09 Aug 2019; Accepted 11 Aug 2019; Available online 25 August 2019 Cite this article as:
Jalodiya S, Gupta MK,Jain NK, Formulation Development and Evaluation of Floating Microsphere of Acyclovir, Journal of
Drug Delivery and Therapeutics. 2019; 9(4-s):967-973 http://dx.doi.org/10.22270/jddt.v9i4-s.3698
*Address for Correspondence:
Shweta Jalodiya, Department of Pharmaceutics, Oriental University, Indore –India
INTRODUCTION
Oral rout of administration is the most convenient and widely used method of drug administration and the development of stomach specific oral controlled-release drug delivery systems is a challenging job due to the variation of pH in different segments of the gastrointestinal tract, the fluctuation in gastric emptying time and the difficulty of localizing an oral delivery system in a selected region of the gastrointestinal tract. Rapid gastrointestinal transit can prevent the absorption of complete drug in the absorption zone and reduce the efficacy of the administered dose since the majority of drugs are absorbed in stomach or the upper part of small intestine [1,2]. To overcome the above discussed issues, many types of oral controlled drug delivery systems having prolonged gastric residence times have been reported such as: floating drug dosage systems (FDDS) [3-7],
swelling or expanding system[8], mucoadhesive
also have the potential to distribute widely over a large area in the stomach and small intestine, thus yielding a more predictable drug release by suppressing the effect of many variables in the gastrointestinal environment. As multiple unit dosage forms consist of many small units, less risk of dosage dumping is expected [23]. Acyclovir [9-(2-hydroxyethoxymethyl)guanine; Zovirax] is a widely used antiviral drug for treating infectious diseases, such as genital herpes, chicken pox, varicella zoster infections, and herpes keratitis caused by herpes simplex virus. Oral absorption of acyclovir is highly variable, with an average bioavailability of 20–26.7% in humans [24-26]. Moreover, due to its short halflife (t1/2) of approximately 2.5 h, repeated administration of high-dose acyclovir is usually required to achieve therapeutic efficacy. Floating microspheres are one of the multiparticulate delivery system and are prepared to obtain prolonged or controlled drug delivery to improve bioavailability and to target drug to specific sites. Microspheres can also offer advantages like limiting fluctuation within therapeutic range, reducing site effects, decreasing dosing frequency and improving patient compliance [27].
MATERIAL AND METHODS
MaterialAcyclovir was obtained as a gift sample from Macleods Pharmaceuticals, Mumbai. Dichloromethane, ethanol and isopropyl alcohol were purchased from E. Merck (India) Ltd., Mumbai. Ethyl cellulose, hydroxyl propyl methyl cellulose was purchased from Loba Chem. Pvt. Ltd, Mumbai. Double
distilled water was prepared freshly and used whenever required. All the chemicals used in this work were of analytical grade.
Methods
Determination of λ max of ACV
Accurately weighed 10 mg of drug was dissolved in 10 ml of 0.1 N HCl solutions in 10 ml of volumetric flask. The resulted solution 1000µg/ml and from this solution 1 ml pipette out and transfer into 10 ml volumetric flask and volume make up with 0.1 N HCl solution prepare suitable dilution to make it to a concentration range of 5-25μg/ml. The spectrum of this solution was run in 200-400 nm range in U.V.
spectrophotometer (Labindia-3000+). A graph of
concentration Vs absorbance was plotted.
Preparation of floating microsphere of ACV
Floating microspheres loaded with acyclovirwere prepared
using solvent diffusion-evaporation method using HPMC and EC in different ratio like 1:0.5, 1:1.5, 1:2 w/w. Drug and polymer in proportion of drug and polymers were dissolved in 1:2 mixture of solvent system of ethanol and dichloromethane. This clear solution was poured slowly in a thin stream into the aqueous solution of 1% polyvinyl alcohol. The emulsion was continuously stirred for 3 h at a speed of 500 rpm at 27±2°C. The floating microspheres were
collected by decantation, while the non-floating
microspheres were discarded. The microspheres were dried overnight at 40±2°C and stored in desicator. The compositions of the formulations were shown in Table 1.
Table 1 Formulations of the floating microspheres of ACV
Sr. No Formulation Code Acyclovir (mg) HPMC
(mg)
EC (mg)
1. F1 100 100 50
2. F2 100 100 150
3. F3 100 100 200
4. F4 100 100 100
5. F5 100 150 100
6. F6 100 200 100
Evaluation of microspheres
Microscopic Observation of prepared Microsphere
An optical microscope (cippon, Japan) with a camera attachment (Minolta) was used to observe the shape of the prepared microsphere formulation.
Percentage Yield
The prepared microspheres with a size range of 1μm to 1000μm were collected and weighed from different formulations. The measured weight was divided by the total amount of all non-volatile components which were used for the preparation of the microspheres.
Drug Entrapment
The various formulations of the floating microspheres were subjected for drug content. 10 mg of floating microspheres from all batches were accurately weighed and crushed. The
powder of microspheres were dissolved in 10 ml 0.1 N HCl and centrifuge at 1000 rpm. This supernatant solution is than filtered through whatmann filter paper No. 44. After filtration, from this solution 0.1 ml was taken out and diluted up to 10 ml with 0.1 N HCl. The percentage drug entrapment was calculated using calibration curve method
Floating behavior
Ten milligrams of the floating microspheres were placed in 0.1 N HCl (100 ml). The mixture was stirred at 100 rpm in a magnetic stirrer. After 10 h, the layer of buoyant microsphere was pipetted and separated by filtration. Particles in the sinking particulate layer were separated by filtration. Particles of both types were dried in desiccators until a constant weight was obtained. Both the fractions of microspheres were weighed and buoyancy was determined by the weight ratio of floating particles to the sum of floating and sinking particles.
Measurement of mean particle size
The mean size of the microspheres was determined by Photo Correlation Spectroscopy (PCS) on a submicron particle size analyzer (Malvern Instruments) at a scattering angle of 90°. A sample (0.5mg) of the microspheres suspended in 5 ml of distilled water was used for the measurement
Determination of zeta potential
The zeta potential of the drug-loaded microspheres was measured on a zeta sizer (Malvern Instruments) by determining the electrophoretic mobility in a micro electrophoresis flow cell. All the samples were measured in water at 25°C in triplicate.
In-vitro Release Studies
The drug release rate from floating microspheres was carried out using the USP type II (Electro Lab.) dissolution paddle assembly. A weighed amount of floating microspheres equivalent to 100 mg drug were dispersed in 900 ml of 0.1 N HCI (pH=1.2) maintained at 37 ± 0.5°C and stirred at 55rpm. One ml sample was withdrawn at predetermined intervals and filtered and equal volume of dissolution medium was replaced in the vessel after each withdrawal to maintain sink condition. The collected samples analyzed spectrophotometrically at 242 nm to determine the concentration of drug present in the dissolution medium [28,29].
Drug release kinetic data analysis
Several kinetic models have been proposed to describe the release characteristics of a drug from matrix. The following three equations are commonly used, because of their simplicity and applicability. Equation 1, the zero-order model equation (Plotted as cumulative percentage of drug released vs time); Equation 2, Higuchi’s square-root equation (Plotted as cumulative percentage of drug released vs square root of time); and Equation 3, the Korsemeyer-Peppas equation (Plotted as Log cumulative percentage of drug released vs Log time).
To study the release kinetics of Famotidinefrom the Floating microspheres the release data was fitted to these three equations
Zero order equation: When a graph of the cumulative
percentage of the drug released from the matrix against time is plotted, zero order release is linear in such a plot, indicating that the release rate is independent of concentration.
Qt = k0.t ……… (1)
Where Qt is the percentage of drug released at time t and k0 is
the release rate constant;
First order
equation:-In (100-Qt) = In 100- kI.t ……….. (2)
Where kI is the release rate constant;
Higuchi’s equation (Wagner, 1969):-
Qt = kH.t1/2 ……….. (3)
Where KH is the Higuchi release rate constant
Korsemeyer-Peppas:-
The curves plotted may have different slopes, and hence it becomes difficult to exactly pin-point which curve follows perfect zero order release kinetics. Therefore, to confirm the kinetics of drug release, data were also analyzed using Korsemeyer’s equation.
Qt/Q∞ = kKP.tn
Where Qt/ Q∞ is the fraction of drug released at time t, kKPa
constant compromising the structural and geometric characteristics of the device and n is the release exponent. The slope of the linear curve gives the ‘n’ value. Peppas stated that the above equation could adequately describe the release of solutes from slabs, spheres, cylinders and discs, regardless of the release mechanism. The value of ‘n’ gives an indication of the release mechanism. When n = 1, the release rate is independent of time (typical zero order release / case II transport); n = 0.5 for Fickian release (diffusion/ case I transport); and when 0.5 < n < 1, anomalous (non-Fickian or coupled diffusion/ relaxation) are implicated. Lastly, when n > 1.0 super case II transport is
apparent. ‘n’ is the slope value of log Mt/M∞ versus log time
curve [30-32].
Stability studies
Stability studies were carried out with optimized formulation which was stored for a period of 45 days at 4±1°C, RT and 40±1°C.
RESULTS AND DISCUSSION
The λ max of ACV was found to be 242 nm by using U.V.
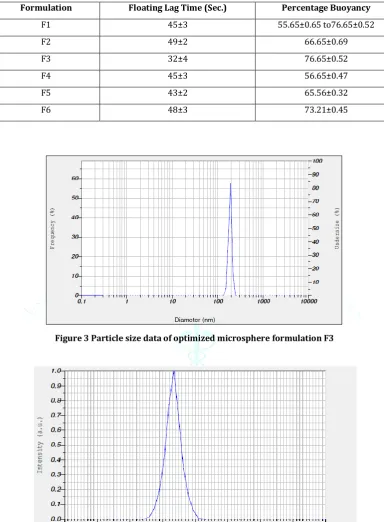
spectrophotometer (Labindia-3000+) in linearity range 5-25 µg/ml Fig.1, 2. The floating microspheres of ACV were prepared by solvent diffusion-evaporation method. Percentage yield of different formulation was determined by weighing the microspheres after drying. The percentage yield of different formulation was in range of 62.23±0.85 to73.32±0.65% Table 2. The maximum percentage yield was found in formulation F3, 73.32±0.65 as compare to all formulation. The drug entrapment efficacies of different formulations were in range of 62.23±0.54 to75.56±0.23 %w/w. The maximum percentage drug entrapment was found in formulation F3 (75.56±0.23 % w/w) Table 3. To assess the floating properties, the microspheres were placed in 0.1N hydrochloric acid. The microspheres floated for prolonged time over the surface of the dissolution medium without any apparent gelation. Buoyancy percentage of the microspheres was in the range of 55.65±0.65 to76.65±0.52. The nature of the polymer influenced the floating behaviour of the microspheres Table 4. The maximum percentage yield, drug entrapment, percentage buoyancy and floating lag time was found to be formulation F3 in floating microsphere. The optimized formulation of F3 was subjected to further studies. The mean size of the microspheres was determined by photo correlation spectroscopy (PCS) on a submicron particle size analyzer (Horiba Instruments) at a scattering angle of 90°.The results of measurement of mean particle size of optimized formulation F3 of floating microsphere was found to be 198.3nm Fig. 3. Results of zeta potential of optimized formulation F4 of floating microsphere was found
Figure 1 UV spectra of pure drug (ACV)
Figure 2 Calibration curve of ACV in 0.1 N HCl at 242 nm
Table 2 Percentage yield for different formulation
Formulation Percentage Yield
F1 69.98±0.98
F2 70.12±0.95
F3 73.32±0.65
F4 65.56±0.58
F5 62.23±0.85
F6 66.56±0.32
Table 3 Drug entrapment for different formulations
Formulation Drug entrapment (% w/w) of prepared microsphere
F1 65.56±0.95
F2 69.98±0.65
F3 75.56±0.23
F4 62.23±0.54
F5 59.98±0.52
F6 63.32±0.45
Table 4 Floating lag time and percentage buoyancy of floating microsphere
Formulation Floating Lag Time (Sec.) Percentage Buoyancy
F1 45±3 55.65±0.65 to76.65±0.52
F2 49±2 66.65±0.69
F3 32±4 76.65±0.52
F4 45±3 56.65±0.47
F5 43±2 65.56±0.32
F6 48±3 73.21±0.45
Figure 3 Particle size data of optimized microsphere formulation F3
Figure 4 Zeta potential data of floating microsphere F3
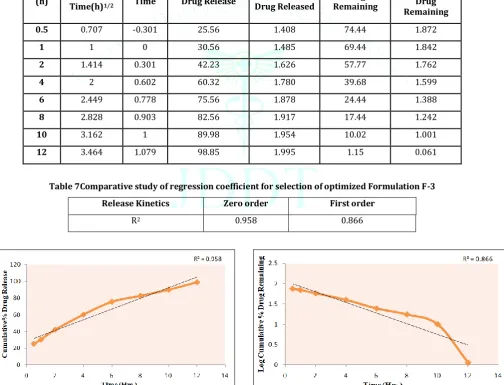
The drug release from floating microspheres was found to be
98.85 % at the end of 12 h for F3 Table 5. The In vitro drug
release data of the optimized formulation was subjected to goodness of fit test by linear regression analysis according to zero order and first order kinetic equation, in order to determine the mechanism of drug release. When the regression coefficient values were compared, it was observed that an ‘r’ value of microsphere was maximum zero order i.e 0.958 hence indicating drug releases from
formulations was found to follow zero order for floating
Table 5 Release study data of formulation F1-F6
Time Percentage Drug Release
(hr) F1 F2 F3 F4 F5 F6 29.98
0.5 33.25 30.25 25.56 29.98 20.23 15.56 39.98
1 46.65 41.25 30.56 39.98 26.65 23.32 46.65
2 59.98 52.36 42.23 46.65 31.25 33.32 63.32
4 73.23 69.98 60.32 63.32 46.65 45.56 80.56
6 89.98 85.56 75.56 80.56 53.32 51.48 92.23
8 99.23 90.23 82.56 92.23 63.32 56.65 99.23
10 - 99.89 89.98 99.23 72.23 65.56 -
12 - - 98.85 - 85.56 73.32 29.98
Table 6 Release Kinetics of optimized formulation of microsphere F-3
Time (h)
Square Root of
Time(h)1/2
Log
Time Cumulative% Drug Release
Log Cumulative % Drug Released
Cumulative % Drug Remaining
Log Cumulative %
Drug Remaining
0.5 0.707 -0.301 25.56 1.408 74.44 1.872
1 1 0 30.56 1.485 69.44 1.842
2 1.414 0.301 42.23 1.626 57.77 1.762
4 2 0.602 60.32 1.780 39.68 1.599
6 2.449 0.778 75.56 1.878 24.44 1.388
8 2.828 0.903 82.56 1.917 17.44 1.242
10 3.162 1 89.98 1.954 10.02 1.001
12 3.464 1.079 98.85 1.995 1.15 0.061
Table 7Comparative study of regression coefficient for selection of optimized Formulation F-3
Release Kinetics Zero order First order
R2 0.958 0.866
Figure 5 Zero order release kinetics Figure 6 First order release kinetics
CONCLUSION
In vitro data obtained for floating microspheres of ACV showed excellent floatability, good buoyancy and prolonged drug release. Microspheres of different size and drug content
REFERENCES
1. Kaushik K, C haurasia D, Chaurasia H, Mishra SK, Bhardwaj P.
Development and characterization of floating alginate beads for gastroretentive drug delivery system. Acta Pharma Sci 2011; 53(4): 551-562.
2. Tadros MI. Controlled-release effervescent floating matrix
tablets of ciprofloxacin hydrochloride: development, optimization and in vitro-in vivo evaluation in healthy human volunteers. Eur J Pharm Biopharm 2010; 74(2): 332-339.
3. Baumgartner S, Kristl J, Vrecer F, Vodopivec P, Zorko B.
Optimisation of floating matrix tablets and evaluation of their gastric residence time. Int J Pharm 2000; 195(1-2): 125-135.
4. Bulgarelli E, Forni F, Bernabei MT. Effect of matrix
composition and process conditions on casein-gelatin beads floating properties. Int J Pharm 2000; 198(2): 157-165.
5. Davoudi ET, Noordin MI, Kadivar A, Kamalidehghan B, Farjam
AS, Javar HA. Preparation and characterization of a gastric floating dosage form of capecitabine. Biomed Res Int 2013; doi: 10.1155/2013/495319.
6. Singh BN, Kim KH. Floating drug delivery systems: an
approach to oral controlled drug delivery via gastric retention. J Control Release 2000; 63(3): 235-259.
7. Garg R, Gupta G. Progress in controlled gastroretentive
delivery systems. Trop J Pharm Res 2008; 7(3): 1055-1066.
8. Chen J, Park K. Synthesis of fast-swelling, superporous sucrose
hydrogels. Carbohyd Polym 2000; 41(3): 259-268.
9. Shaikh R, Singh TRR, Garland MJ, W oolfson AD, Donnelly RF.
Mucoadhesive drug delivery systems. J Pharm Bioallied Sci 2011; 3(1): 89-100.
10. Boddupalli BM, Mohammed ZNK, Nath RA, Banji D.
Mucoadhesive drug delivery system: an overview. J Adv Pharm Technol Res 2010; 1(4): 381-387.
11. Kedzierewicz F, Thouvenot P, Lemut J, Etienne A, H offman M,
Maincent P. Evaluation of peroral silicone dosage forms in hymans by gamma-scintigraphy. J Control Release 1999; 58(2): 195-205.
12. Rouge N, Allémann E, Gex-Fabry M, Balant L, Cole ET, Buri P,
et al. Comparative pharmacokinetic study of a floating multiple-unit capsule, a high density multiple-unit capsule and an immediate-release tablet containing 25 mg atenolol. Pharm Acta Helv 1998; 73(2): 81-87.
13. Prajapati PH, Nakum VV, Patel CN. Formulation and
evaluation of floating matrix tablet of stavudine. Int J Pharm Investig 2012; 2(2): 83-89.
14. Chaturvedi K, Umadevi S, Vaghani S. Floating matrix dosage
form for propranolol hydrochloride based on gas formation technique: development and in vitro evaluation. Sci Pharm 2010; 78(4): 927-939.
15. Murata Y, Sasaki N, Miyamoto E, Kawashima S. U se of floating
alginate gel beads for stomach-specific drug delivery. Eur J Pharm Biopharm 2000; 50(2): 221-226.
16. Jagtap YM, Bhujbal RK, Ranade AN, Ranpise NS. Effect of
various polymers concentrations on physicochemical properties of floating microspheres. Indian J Pharm Sci 2012; 74(6): 512-520.
17. Jain AK, Jain CP, Tanwar YS, Naruka PS. Formulation,
characterization and in vitro evaluation of floating
microspheres of famotidine as a gastro retentive dosage form. Asian J Pharm 2009; 3(3): 222-226.
18. El-Kamel AH, Sokar MS, Al Gamal SS, Naggar VF. Preparation
and evaluation of ketoprofen floating oral delivery system. Int J Pharm 2001; 220(1-2): 13-21.
19. El-Kamel AH, Sokar MS, Al Gamal SS, Naggar VF. Development
of floating microspheres to improve oral bioavailability of cefpodoxime proxetil. Int J Pharma 2001; 220: 13-21.
20. Wakde PH , K asliwal RH , Mane SB. Design and fabrication of
gastroretentive bilayer floating tablet of propronolol HCl using natural polymer. Int J Pharm Sci Res 2013; 4(12): 4715-4728.
21. Pandya N, P andya M, Bhaskar VH. Preparation and in vitro
characterization of porous carrier-based glipizide floating microspheres for gastric delivery. J Young Pharm 2011; 3(2): 97-104.
22. Jagdale SC, Agavekar AJ, Pandya SV, Kuchekar BS, Chabukswar
AR. Formulation and evaluation of gastroretentive drug delivery system of propranolol hydrochloride. AAPS PharmSciTech 2009; 10(3): 1071-1079.
23. Hussain MN, M asum MAA, Akhter S, Sharmin F, Reza MS.
Formulation and evaluation of gastro retentive floating tablets of simvastatin using hydrophilic rate retardant. Bangladesh Pharm J 2012; 15(2): 119-126.
24. de Miranda P, Blum MR. Pharmacokinetics of acyclovir after
intravenous and oral administration. J Antimicrob Chemother. 1983; 12 Suppl B:29–37.
25. Steingrimsdottir H, Gruber A, Palm C, Grimfors G, Kalin M,
Eksborg S. Bioavailability of aciclovir after oral administration of aciclovir and its prodrug valaciclovir to patients with leukopenia after chemotherapy. Antimicrob Agents Chemother. 2000; 44(1):207–9. PMID: 10602752
26. Bras AP, Sitar DS, Aoki FY. Comparative bioavailability of
acyclovir from oral valacyclovir and acyclovir in patients treated for recurrent genital herpes simplex virus infection. Can J Clin Pharmacol. 2001; 8 (4):207–11. PMID: 11743593
27. Haznedar S, Dortunc B. Preparation and in vitro evaluation of
eudragit microspheres containing acetazolamide. Int J Pharm 2004; 269(1): 131-140.
28. Tanwar Y S, Naruka P S, Ojha G R. Development and
evaluation of floating microspheres of verapamil
hydrochloride. Brazilian Journal of Pharmaceutical Sciences vol. 43, n. 4, out./dez., 2007, 529-534.
29. Deepa MK, Karthikeyan M. Cefpodoxime Proxetil Floating
Microsphere: Formulation and In vitro Evaluation. Iran J Pharm Sci 2009; 5(2):69-72.
30. Brahamankar DM, Jaiswal SB. Biopharmaceutics and
pharmacokinetics e a treatise, pharmacokinetics: basic consideration. 2nd ed. Vallabh Prakashan; 2009. pp. 240e3.
31. Higuchi T. Mechanism of sustained action medication,
theoretical analysis of rate of release of solid drugs dispersed in solid matrices. J Pharm Sci 1963; 52:1145e9.
32. Korsmeyer RW, Gumy R, Doelker E, Buri P, Peppas NA.