Gene
Expression
Changes
in
Normal
Hematopoietic
Cells
Jack
M.
Lionberger
1
and
Derek
L.
Stirewalt
2
1
Dr.
Jack
M.
Lionberger
MD/PhD
is
an
Acting
Instructor
at
the
Fred
Hutchinson
Cancer
Research
Center
and
the
University
of
Washington.
His
research
interests
include
hematopoietic
stem
cell
biology
and
the
influences
of
aging
on
stem
cell dysfunction
in
the
elderly.
Email:
2
Dr. Derek L. Stirewalt MD is an Assistant
Member
at
the
Fred
Hutchinson Cancer
Research
Center and Assistant Professor at the University of Washington Medical School. His research
interests
include
the
study
of
gene
expression
changes
in
normal
and
malignant
hematopoietic cells and the development of high‐throughput assays expression assays.
Email:
Derek L. Stirewalt, MD
Assistant Member
Genetics and Genomics
Clinical Division
D5-112, FHCRC
1100 Fairview Ave N Seattle, WA 98109
ABSTRACT
The
complexity
of
the
healthy
hematopoietic
system
is
immense,
and
as
such,
one
must
understand
the
biology
driving
normal
hematopoietic
expression
profiles
when
designing
experiments
and
interpreting
expression
data
that
involves
normal
cells.
This
chapter
seeks
to
present
an
organized
approach
to
the
use
and
interpretation
of
gene
profiling
in
normal
hematopoiesis
and
broadly
illustrates
the
challenges
of
selecting
appropriate controls for high‐throughput expression studies.
List of keywords: Hematopoiesis, microarrays, cDNA, transcriptome, proteome, cytokine,
interleukin, malignancy, genome, epigenome, differentiation, polymorphism, aging, somatic mutation,
pharmacogenetics, post‐translational modification, stem cell.
INTRODUCTION
As discussed in other chapters, malignancies demonstrate significant “disease‐specific”
expression changes compared to normal hematopoiesis. However, these findings must be interpreted
with caution and in full view of critical differences between normal and diseased cellular biology.1‐3
Several fundamental issues (outlined below) must be addressed to effectively design experiments and to
appropriately interpret results.
What are the characteristics of “normal” hematopoiesis? Hematopoietic cells must constantly
recognize a wide variety of internal and external signals in order to maintain a balanced yet flexible
blood system. Consequentially, normal hematopoietic cells will often display widely divergent
transcription profiles depending upon their environmental cues and immediate surroundings. For
example, a hematopoietic system undergoing the stress of an acute hemorrhage will present a markedly
different molecular expression signature than one in homeostasis.4 Likewise, hematopoietic stem cells
(HSCs) from a 65 year‐old smoking male on multiple medications are likely very different from healthy
newborn HSCs, despite a shared immunophenotype.5 Therefore, unrecognized biological variables
within the subject may be responsible for expression changes that can be inappropriately ascribed to
pathologic conditions. For this chapter, normal hematopoiesis will be defined as any non‐malignant
state. Although too broad for many comparisons, this definition highlights the absolute necessity to
acknowledge and control for “normal” biological factors that may cause inter‐individual variation in
expression data.
A similar but distinct issue relates to the heterogeneity of cells within the hematopoietic system.
What are the appropriate populations of cells for comparisons between normal and diseased states?
The answer to this question will profoundly impact the biological and technical aspects of an
experiment. To illustrate this point, consider that “normal” CD34+/CD38‐ and CD34+/38+ cells have
overlapping yet unique expression signatures,6,7 and similar differentiation specific expression signatures
have been found in leukemic blasts.8 Therefore, if one compares the expression profiles between
relatively homogenous CD34‐positive AML blasts and heterogeneous normal bone marrow samples,
with the disease phenotype. However, upon further investigation, it becomes clear that many of the
“AML‐specific” expression changes may be secondary to lineage‐specific variations in the trascriptome.3
To further complicate matters, many hematopoietic malignancies inappropriately express a variety of
differentiation markers, making precise determination of the optimal comparison population a
challenge.9 Due to the lack of an absolutely correct choice, the appropriate control will depend on the
intellectual bias, available resources, and specific goals of the investigator.
How do investigators inadvertently change the biology of cells? Cells require extensive handling
prior to most expression profiling studies, and many times, the normal and diseased populations
undergo different processing. For example, leukemic samples obtained from large cooperative groups
are frequently shipped from outside institutions, resulting in a delay of processing, while normal
samples are often obtained and processed locally. In many cases, studies use frozen samples,
introducing another potential variable that can impact expression.3 Processing, thawing, and other
typical laboratory manipulations impact the biology and expression profiles of normal and abnormal
cells.10 Together, these factors may introduce uncontrolled or unknown methodologic biases that can
lead to erroneous findings and decrease the experimental power to detect true biological differences.
A firm grasp of the biology governing normal hematopoiesis is essential to the study of the
molecular aspects of hematopoietic diseases. This chapter focuses on expression profiles of normal cells
and factors that alter expression in these cells. It is intended to provide a framework to facilitate the
reader’s evaluation of studies that focus on gene profiles of normal hematopoietic cells, or use them as
a point of comparison. In general, the term “expression” will refer to either mRNA or protein expression
in order to illustrate the concept in its broadest sense. When appropriate, the authors will clarify the
type of expression by specifically referring to either mRNA or protein expression. Obviously, a
comprehensive review of any specific topic regarding the transcriptome, its regulation, or translated
products is beyond the scope this chapter. Additional concepts and details are available in the cited
references and reviews.
Chapter
Goals:
•
Outline
the
current
understanding
of
gene
expression
in
normal
hematopoietic
cells.
•
Provide
a
basic
understanding
of
the
factors
that
govern
the
normal
hematopoietic
transcriptome.
•
Explore
the
impact
of
intra
‐
individual,
inter
‐
individual
and
environmental
factors
on
gene
expression.
•
Discuss
the
pitfalls
of
current
approaches
examining
normal
hematopoietic
gene
expression.
FIGURE 1 TO BE INSERTED HERE.
Intrinsic and extrinsic factors that control and alter expression profiles are broadly considered in
this section, starting with the genome and working outward to the environment (Figure 2). It is
incorrect to derive from this structured description that the regulators of expression function
independently of one another, and in fact, considerable cross‐talk and coordination occurs between
them.
FIGURE 2 TO BE INSERTED HERE
Impact of Genomic Changes on Expression
For years, investigators have been aware of genetic divergence across populations and among
family members, which is demonstrated by inter‐individual differences in behavioral and physical
attributes. Historically, the genome was modeled as rigidly static after conception, and monozygotic
twins were expected to share an exact genetic unity. This assumption has recently been shattered by
studies using high resolution genomic arrays.11,12 Unexpected levels of copy number variation (CNV)
between monozygotic twins provide support for a model of sub‐chromosomal genetic divergence after
the splitting of the embryo, indicating that the normal genome may be more dynamic than once
appreciated.13 An even more dramatic example of post‐conception genomic divergence has recently
been described in mammals. Microsatellite mutations in mice occur with sufficient frequency during
early organogenesis that the genetic variability can be used to model the developmental relationship of
different tissues within the animal.14
To further complicate matters, an individual’s genome continues to change ex utero, probably as
a result of the intrinsic aging processes and environmental factors.15 For example, non‐allelic
homologous recombination naturally increases as a function of normal aging in humans, and studies
reveal increased DNA damage in the hematopoietic cells from older animals in the absence of malignant
disease.16,17 If these genetic changes affect critical regulatory sequences within the gene, then
transcription, translation, and post‐translational modifications could be altered and result in a modified
phenotype. The effect or significance of incidental age‐related acquired genomic variation on gene
expression is unclear; however, there is an effort to better describe the degree of genetic variation in
humans and identify the factors that cause genetic changes within normal cells.18 Until we have a better
understanding of the mechanisms governing genetic variation across individuals and acquired genetic
alterations within individuals, studies comparing normal and diseased states must be interpreted
cautiously. A real possibility exists to misinterpret genetic “lesions” or expression changes in the
diseased population that actually represent normal divergence.13
Epigenetic Regulation of Expression
Epigenetic factors regulate gene expression.19,20 For example, methylation of cytosines
modulates transcription factor binding at critical promoter sequences of some genes, thereby altering
expression.5,20 As with the genomic variability discussed above, methylation states are dynamic.21
Genes that govern methylation indirectly control the expression of an even larger number of genes.22
Regulators of methylation vary with the cell cycle, overall health of the cell, and differentiation stage.5,21
radiation and tobacco smoke), and drugs (e.g., 5‐azacytidine) impact the methylation states in
hematopoietic cells, providing another level of transcriptome modification and regulation.5,20
Chromatin scaffolding houses the genome and is an epigenetic regulator of transcription.20,23
Chromatin is composed of proteins, primarily histones, which actively organize the genome, engaging
and regulating transcriptional machinery.24,25 A variety of genes, conditions, and mechanisms dictate
the dynamic and plastic nature of chromatin structure.26 For example, histone acetylation/deacetylation
plays a critical role in modifying chromatin configuration and impacts transcription.27
Role of Transcription Factors in Gene Expression
Nuclear proteins bind to transcription factor binding sites (TFBS) that lie within promoter
regions and initiate synthesis of RNA.28 There are probably 100s – 1000s of transcription factors
expressed at any one time in normal and malignant cells, and transcription factor may have thousands
of binding sites and control hundreds of genes.28 For example, TP53 (a tumor suppressor gene and
transcription factor) binds to over 500 loci,29 while MYC may have 10,000 – 20,000 unique TFBS within
the genome.30 Furthermore, transcription factors can have multiple isoforms that have different
affinities to the TFBS and produce opposing biological effects.31
Numerous context‐dependent genetic and epigenetic components influence the function of a
transcription factors. The complexity of the system is challenging to model because transcription factors
can be directly involved in expression of genes at multiple levels. For example, IKAROS family zinc finger
1 (IKZF1) promotes transcription, recruitment and modification of other transcription factors, and
influences chromatin remodeling.32 The interactions between the genome, primary sequence
methylation, chromatin structure, and thousands of transcription factors set the stage for a versatile and
adaptable transcriptome, which is capable of simultaneously maintaining homeostasis yet has the
capacity to rapidly respond in times of stress.
The Changing Transcriptome
There are numerous components to the transcriptome: messenger (m)RNA, ribosomal (r)RNA,
transfer (t)RNA, and the recently described non‐coding (nc)RNA,33,34 and each of these components play
a critical role in regulating protein expression. mRNA transcripts are perhaps the most studied of all the
different transcriptional components. After transcription, pre‐mRNA products undergo post‐
transcriptional modifications and are eventually processed into mature mRNA transcripts. These mature
mRNA transcripts form the template for translation and thus, directly regulate protein expression. Due
to their pivotal role in regulating this expression, the levels of mRNAs are tightly regulated via timely
expression, maintenance, and degradation. The inherent instability of mRNA can work against accurate
assessment of transcript levels, introducing a potential experimental pitfall that may be difficult to
control for on a gene by gene basis.
For many years the biological activity of ncRNAs was unrecognized, and they were thought to
arise from non‐specific transcriptional activity or as the by‐product of normal RNA processing. Interest
conserved across species and that some ncRNAs have functional activity.33 Functional experiments
demonstrated that these simple but eloquent gene products (i.e. microRNAs, or miRNA) provide a
versatile method for controlling expression by binding and modulating the stability of mRNA and/or its
translation.35‐38 The expression of many miRNAs (e.g., miR‐181) fluxuate during hematopoiesis,
consistent with recent studies demonstrating a critical role for these transcripts in normal differentiation
programs.35,36,39 Other ncRNAs may serve as a physical linkers between RNA‐binding proteins (e.g.,
translocation in liposarcoma, TLS) and DNA promoter sequences. In this model, the ncRNAs cause an
allosteric change within the RNA‐binding protein, which, in turn, promotes the association of other
transcriptional proteins and represses promoter activity.40 Although ncRNAs are sometimes expressed
at very low levels, they may still have profound biological effects. Additionally, recent data suggest that
ncRNA species have greater variety than the mRNA transcripts in the cell, although further
characterization is required.34 Even if only half of the projected ncRNAs are functional, they add yet
another level of complexity to the biological equation that has not been encountered since the
discovery of the genome.
The Vast and Varied Proteome
Analogous to the transcriptome, the proteome is the sum of all translation products, and is the
point at which genetic changes become relevant to the biology of the cell. Proteins are responsible for
adaptation, metabolism, and survival. The modern biologist must model real‐time non‐linear behavior
of subcellular signal transduction pathways, microcompartments, and organelles that have critical
spaciotemporal associations with diverse cellular apparatuses, ion gradients, cytoskeletons,
carbohydrates, etc. Compared to the leviathan effort needed to sequence the human genome, the work
required to comprehensively model the proteome is vastly greater because not all protein
characteristics are encoded by genomic elements. Post‐translational modifications (PTMs) can activate,
modulate, and/or terminate the function of a protein, while the intracellular context of a protein can
profoundly alter the cell phenotype.41,42 The four‐dimensional model of the biology mediated by
proteins is described by the field of proteomics with subclassifications of data referred to by novel terms
including the “interactome”43 or the “metabalome,”44,45 and recently extended to include the important
concept of carbohydrate modification of proteins called the “glycome.”46 Experimental approaches to
these diverse fields require specialized techniques and software that are beyond the scope of this
chapter, and the reader is referred to the many excellent reviews for additional information.
A common application of proteomics is the screening of candidate pharmacologic molecules
prior to animal studies.47 Thousands of potential agents can be screened for specific interactions with
key biologically active proteins. Candidate molecules that pass the first in vitro tests move forward to
the next round, while molecules with presumed deleterious effects, demonstrated by specific affinities,
are eliminated. If the underlying interaction is misunderstood, potentially beneficial may be overlooked
and potentially dangerous compounds may be inappropriately advanced. There is optimism about using
a similar in vitro approach to predict a patient’s response to therapy in a burgeoning discipline of
The field of proteomics is in its infancy, but has already demonstrated utility. Nevertheless,
current challenges include isolation of specific cell sources and managing the vast amount of
information generated. An additional critical component is the need to define appropriate thresholds to
delineate the biological relevance of a protein‐protein interaction. This challenging issue may vary for
each target because protein interactions are not binary, and both non‐specific and low‐affinity binding
can be biologically significant.
Regulation of Expression via Cell Membrane Proteins
Communication between hematopoietic cells and the microenvironment occurs through
receptors embedded in the plasma membrane. These receptors may function to anchor the cell to a
niche49‐52 and often provide critical points of contact for internal cytoplasmic stuctures.53,54 Receptors
are pivotal to the biology of the cell and often define a cell’s identity, differentiation stage, and disease
state (i.e., “normal” vs. “abnormal”).9,55 Membrane‐associated receptors and integrins are numerous,
and their role in hematopoiesis is a field of investigation under constant flux that has regularly been
reviewed in detail.51,56‐70 We will briefly highlight major points of interest for several of the most studied
receptors below and in Table 1.
Receptor tyrosine kinases (RTKs) and cytokine receptors (CKRs) are classes of proteins that play
critical roles in hematopoietic biology and are expressed on normal hematopoietic cells (Table 1). RTKs
contain intrinsic kinases that drive intracellular signaling activity and are divided into more than 20
subclasses.71 The RTK subclass III (the PDGFR family) is the best‐studied in normal and abnormal
hematopoiesis, and is composed of 5 homologous members (CSF1R, FLT3, KIT, PDGFRA, and PDGFRB).71‐
73 The shared structure includes: five extracellular immunoglobulin‐like domains (EMD), a
transmembrane domain (TMD), juxtamembrane domain (JMD), two intracellular tyrosine kinase
domains (TKD), and a hydrophilic insertion/linker domain between the TKDs (KID).72,73 Compared to
RTKs, CKRs do not have intrinsic tyrosine kinase activity and must recruit kinases to initiate intracellular
signaling. Two classical examples of hematopoietic CKRs include CSF2R (GM‐CSF receptor) and CSF3R
(G‐CSF receptor).59 At the plasma membrane, the extracellular domains of RTKs and CKRs bind specific
cytokines or growth factors (Table 1).72 Ligand binding induces conformational changes that in turn
either activate intrinsic kinase activity (RTK only) or recruit cytoplasmic kinases to initiate diverse signal
transduction pathways. Therefore, the membrane receptor expression pattern of a specific cell dictates
ligand binding and, ultimately, defines the cell responses to the repertoire of ligands in its environment.
The Notch and WNT families of receptors initiate intracellular signals that have been
increasingly implicated in normal and abnormal hematopoiesis. Notch signaling plays an active role in
tissue homeostasis, with initially studies first describing its role in embryonic development.65,74,75 In
humans, Delta‐like and/or Jagged ligands bind to four Notch receptors, and studies suggest that Notch
activation may to play some role in HSCs maintenance and/or expansion.51,65 In fact, recent work has
found that Notch activation can be utilized to expand primitive HSCs for transplantation.76 However, it
remains unclear if Notch is required for perpetual maintenance of these cells.65,74,75 WNT signaling may
also play some role in promoting the expansion of primitive HSCs and has been implicated in HSCs self‐
how membrane receptors influence hematopoiesis, many aspects of these receptors’ biology remains
unknown, highlighting the need for additional studies.
TABLE 1 TO BE INSERTED HERE
METHODS TO EXAMINE THE REGULATORS OF EXPRESSION AND EXPRESSION
Since the completion of the human genome project, there has been an explosion of novel
platforms to examine genomic, epigenetic, and expression changes in hematopoietic cells (Table 2).
Current genomic technologies have the capacity to examine millions of single nucleotide polymorphisms
(SNPs) and acquired mutations using relatively little starting material,77,78 and these assays have already
been found to be extremely useful for identifying nucleotide changes, uniparental disomy (UDP), and
loss of heterogeneity (LOH) in both normal and diseased states.79 As this technology evolves, array‐
based SNP and comparative genomic hybridization platforms will enable researcher to study the genetic
variability in hematopoietic cells with increasing precision and genomic coverage. Recently, high‐
throughput full genome sequencing (FGS), or whole genome sequencing (WGS), has become a reality,
with novel pyrosequencing technologies able to sequence > 400 – 600 Megabases in 10 hours.80 Using
this technology, investigators have sequenced the entire genome for selected subsets of human cells,
including malignant blasts from an AML patient with normal cytogenetics.81,82 These cutting edge
technologies have rapidly advanced our understanding of how genomic changes impact expression,
identifying thousands of new polymorphisms and promoter loci.78,83,84
Currently, there are a number of different techniques to examine DNA methylation and histone
marks – two major epigenetic mechanisms for controlling transcription. DNA methylation changes were
first examined using restriction enzyme digest/PCR assays. The key to this approach is the use of
“methylation specific” restriction enzymes that cleave unmethylated alleles but fail to digest methylated
alleles.85 Gene‐specific PCR primers can be developed that flank the digestion site and amplify only the
protected, methylated DNA sequences. Using this method, investigators first demonstrated that the G‐
SCF promoter displays different methylation states in granulocytes (hypomethylated, expressed) and
lymphocytes (hypermethylated, not expressed).86 One major limitation of this technique is that only
sequences with a methylation‐specific restriction enzyme sites can be assessed. The discovery that
bisulfite treatment of DNA converts unmethylated cytosines to uracil provided a major advancement in
the development of more comprehensive, high‐throughput techniques to examine global DNA
methylation patterns.87 By changing the DNA sequence, investigators were able to design primers or
hybridization probes that differentially target non‐modified (methylated) and modified (unmethylated)
sequences, leading to the development of global methylation arrays.87‐89 Currently, there are a number
of techniques that can be used to examine the relationship of chromatin structure and genes, but the
workhorse of these investigations is the chromatin immunoprecipitation (CHiP) assay.90 With CHiP
assays, chromatin is precipitated with an antibody, and the pellet is interrogated by a variety of
throughput CHiP arrays are becoming increasingly more comprehensive and popular in the research
community.91 Together, these novel techniques provide a powerful set of tools to characterize the
multitude of epigenetic changes in hematopoietic cells.
High‐throughput technology for examining mRNA, or total RNA, expression has been in use for
over a decade.92,93 The first arrays examined expression of a limited number of genes, using relatively
simple platforms, but the technology quickly proved to be a powerful tool of characterizing diseases and
interrogating the molecular biology of cells.94 With refinements in RNA array technology, there has
been a dramatic increase in the number of targets that can be evaluated – with the current arrays
displaying the capacity to examine more than 45,000 transcripts and 35,000 unique genes.95 As the
importance of non‐coding RNAs (discussed elsewhere in this and other chapters) became known,36,38
arrays were developed to specifically examine transcription of miRNAs.96 Investigators have also
adapted the high‐throughput “deep sequencing” techniques used in FGS to the transcriptome,
identifying novel isoforms and alternative splice variants, suggesting that 92% of genes may undergo
alternative splicing.82 Capitalizing on these data, more sophisticated microarrays are being developed
that will allow researchers to discriminate between isoforms and quantify alternative splicing.97,98
At the level of the proteome, the most basic question is whether or not a protein is present
within a cell or in a comparison of cell lysates. Two‐dimensional protein electrophoresis (2DPE), based
on separation of proteins first by isoelectic point and then by denaturation electrophoresis, provided the
first insight into differential protein expression in a holistic fashion.99 Antibodies remain the most typical
approach for specific identification of proteins and are used in a variety of applications, including ELISA
assays, western blotting, affinity chromatography, and immunoprecipitation. Some antibodies have
been raised to specific activation or phosphorylation states of proteins, allowing a modicum of
functional data.100 However, mass spectrometry (MS) does not necessarily require specific antibodies to
identify proteins or peptides; rather MS relies upon ionization of peptides into charged particles that can
be characterized after passing them through electric or magnetic fields.101,102 Another major strength of
MS is the ability to detect PTMs on peptide fragments, and the technique is versatile enough to use
many sources of materials.103,104 Thus, MS has been increasingly adapted to provide specific protein
identification and high throughput analyses of the proteome.104 However, maintaining a system to
simultaneously investigate the biological context of a range of protein interactions during manipulation
will require creative approaches and sophisticated experimental design.102,103 Examples of the tools
used to evaluate the proteome are listed in Table 2, but experimental approaches to interrogating the
proteome are diverse and manifold.
Although these techniques may hold the key to unlocking the biological mysteries of normal and
abnormal hematopoietic cells, high‐throughput platforms have significant limitations. Importantly, they
can only provide “snapshots” of the genetic, epigenetic, and expression changes that occur over time.
Therefore, momentary events (cell processing, target isolation and enzyme efficiencies) directly impact
the cells and the data.3,10 Consequentially, quality controls are essential for proper analyses and
interpretation of the results. In addition, most of these platforms have a finite number of potential
targets that can be examined, potentially missing critical genetic, epigenetic, and/or expression changes.
technology and creating a need for special statistical methods of normalizing, analyzing, and interpreting
the data.105,106
TABLE 2 TO BE INSERTED HERE
DIFFERENTIATION PROGRAMS AND THE TRANSCRIPTOME
The hematopoietic system is amazing in its complexity, flexibility, precision, and capacity. Aging
alone does not exhaust the normal hematopoietic system, nor does recurring hemorrhage or chronic
and repetitive infections. In addition, under normal circumstances all terminal cellular lineages are
precisely maintained without excess. This is particularly impressive because the disparate internal and
external regulation within each compartment independently act on a shared population of primordial
cells. The activities of the hematopoietic system can be artificially separated into different functions: i)
maintenance of the stem cell pool; ii) cell fate/lineage decision making; iii) expansion of daughter cells;
and iv) feedback regulation from the terminal functional cells. Collectively, these and other tasks are
highly regulated by expression changes within the cells to secure maintenance of the hematopoietic
system and dictate differentiation of hematopoietic cells. Examples of differentiation regulation that
broadly illustrate these complex mechanisms follow below, starting at global transcriptional assessment
of HSCs and proceeding to specific examples of expression changes that control differentiation.
One of the greatest challenges in the study of the normal hematopoietic system is
characterization of the pluripotent stem cell. This cell compartment has two mutually exclusive roles:
either to commit to proliferation and generate functional circulating cells, or to maintain “stem‐ness” as
an undifferentiated normal stem cell.107,108 The cells that make this decision are exceedingly rare,
currently do not have an absolute marker of identity, and therefore, can only truly be identified by
transplantation experiments demonstrating successful engraftment of enriched cell populations.109
Clonal stem cell experiments are possible in mice, but even in this system approaches are limited to
evaluation of mature stem cell progeny and retrospective extrapolation. An ideal experiment to define
the expression changes associated with critical HSC decisions would involve sequential array assessment
of a pure population of HSCs over time and as the cells respond to specific ligand challenges.
By comparing neuronal, hematopoietic and embryonic stem cell transcriptomes, investigators
have identified a cadre of transcripts common to maintaining “stem‐ness”, as well as expression
signatures of individual stem cell groups.110,111 The Ivanova group further subdivided populations into
Long Term HSC (LT‐HSC), Short Term HSC (ST‐HCS), Lineage Committed Progenitors (LCP), and mature
blood cells. Each of these hematopoietic subpopulations had an overrepresentation of specific signaling
ligands, receptors, and adhesion molecules. The most primitive LT‐HSC notably expressed several
critical genes Wnt10A, Erg, Hegfl, Bmp8a, and Agpt, many of which had previously been recognized as
playing a critical role in maintenance or proliferation of the primitive HSC compartment.110 In addition,
the studies found that primitive HSCs may simultaneously express ligand/receptor pairs (e.g.,
Wnt10A/Frizzled and Agpt/Tek), suggesting autonomous regulation of some signaling pathways may be
occurring in HSCs.110 The same studies found that the HOX family displayed differential expression
differentiation, were expressed primarily in cells retaining stem‐ness (LT‐HSC), while Hoxb4 and Hoxa9,
both of which are associated with the cell expansion, were expressed in more differentiated,
proliferative populations.110 However, when data from the two above‐mentioned publications were
compared by a third party, the degree of concordance between the studies regarding the transcripts
common to stem cells was low.112,113 The published exchange of opinions on this data (the primary
papers, the counter analysis, and the rebuttal) are well worth reading as a primer regarding the complex
issues involved in expression profiling and the application of this technology to rare cells.112‐114
Other investigators have returned to similar target populations as isolation techniques,
definitions of cell populations, and microarrays have improved. Using improved arrays, Fosberg et al.
confirmed some of the LT‐HSC transcriptome elements of previous authors (e.g.,ROBO4 and Slit‐like2
ligand receptor pair) and the general trend of the preservation of “stem‐ness” genes in earlier cells
(Hoxa5 and Hoxb5), with proliferation genes arising in more mature forms (Hoxa9).115 However,
intriguing new elements were also described (e.g., previously undescribed adherens junctional complex
proteins, like Esam1), suggesting novel elements of HSC biology.115
Array RNA data and the transcriptome only tell the beginning of the story. Translated proteins
are responsible for much of the functional biology governing differentiation, and these regulatory
proteins may have unique and overlapping functions. For example, CRE binding protein (CBP) and p300
have a significant amount of structural homology, and both proteins play very active roles in chromatin
remodeling, suggesting a potential functional redundancy.116,117 In fact, CBP and p300 proteins both
harbor the “KIX” domain, which is a binding site for the transcriptional factors CREB and c‐myb.
However, site‐directed mutagenesis studies reveal that mutations in the KIX domain of the two genes
produced distinct functional responses. Mice with a CBP‐KIX mutation displayed no significant
alterations in hematopoiesis, while the mice harboring the same KIX mutation in p300 had multilineage
abnormalities.118 This study stands in contrast to the effect seen by a frank single knockout of each
gene, in which a more dramatic disruption of hematopoiesis was seen in the CBP knockout.119 Certainly,
experimental technique variation, specificity of the mutants, and/or the mouse strains in each
experiment may have a role in the discordant results; alternatively, each protein may have a distinct
function in HSC biology that will be elucidated with further investigation. Consistent with this assertion
is the data provided by a third study, which found distinct roles for the two proteins, with CBP
influencing HSC renewal and p300 influencing differentiation.120 Interestingly, when the p300 double‐
knockout HSCs were transplanted into WT animals, the differentiation defect was overcome, suggesting
the intriguing possibility that the p300‐deficient phenotype is influenced by the stroma rather than a
HSC autonomous mechanism.120 Given the wide range of roles that CBP and p300 play in the cell, it is
perhaps not surprising that distinct facets of their biological roles are evident in different experimental
systems. This example underscores the complexity of the functional response of even relatively
homologous proteins and how subtle changes in the environment may dramatically change impact their
effect.
As a cell moves through differentiation, innate programs are activated within cells at immature
stages maintain lineage commitment via positive and negative feedback loops. Transcriptional factor
to maintain the decision. For example, GATA‐1 and PU.1 are expressed and promote differentiation in
the erythroid and megakaryocytic lineages, respectively. Furthermore, each protein drives a positive
feedback loop for its own expression, and a negative feedback loop for the expression of the other
transcription factor.121,122 These types of complex and tightly regulated programs help to prevent
inappropriate expression of genes at the wrong stage of differentiation.
As previously described ligands and their receptors orchestrate a complex symphony of self‐
renewal, proliferation, and differentiation during hematopoiesis (Table 1). Cells express a unique set of
receptors and ligands at specific points of in the differentiation process, at times forming auto/paracrine
feedback loops. A recent study carefully evaluated the FLT3/FLT3LG system in CD34+ cells, an important
pathway in undifferentiated hematopoietic cells, and showed that FLT3 receptor and ligand were both
produced. Additionally, the a FLT3 receptor inhibitor (lesaurtinib) promoted upregulation of both the
ligand and receptor, suggesting autonomous regulation.123 In another microarray based study, human
CD34+ cells expressed multiple different cytokines (e.g., VEGF, HGF, IGF1, IL16, TGFB1, and TPO).124 This
study correlated mRNA expression with protein production and biological function, and addressed some
of the potential difficulties in modeling gene profiling assessment in the form of microarrays.125
EFFECTS OF AGING ON HEMATOPOIETIC EXPRESSION
The hematopoietic system undergoes a number of significant functional and anatomic changes
with age. Overall, there is a diminution of the immune and growth factor responsiveness.126‐130
Furthermore, the incidence of most hematopoietic diseases (e.g., anemia, malignancies) dramatically
increases with age.131 Currently, it is unclear exactly what biological factors are responsible for the age‐
related changes in the hematopoietic system. Genetic and epigenetic changes within hematopoietic
progenitor/stem cells (HPCs/HSCs) and their progeny definitely increase over the life of an organism.108
For example, HSCs from older mice display a marked reduction in their capacity to repair DNA damage,
and this deficiency leads to decreased self‐renewal, increased apoptosis, diminished capacity to
maintain normal hematopoiesis, and “functional exhaustion”.16,132 Despite these findings (or perhaps
due to this dysfunction) older mice have an increased number of HSCs, although these cells demonstrate
reduced repopulating potential and a propensity towards myeloid skewing.108,133‐135 Together, these
findings strongly support the conclusion that aging expands one or more pools of dysfunctional
HPCs/HSCs that limit the hematopoietic system response, especially in times of stress. Since DNA repair
processes are disrupted with aging, DNA damage accumulates in the cells of older adults. Like many
other cancers, multiple genetic, epigenetic, and/or transcriptional events are required to transform
normal hematopoietic progenitor/stem cells.136‐139 Therefore, dysfunctional HPCs/HSCs may acquire the
necessary and sufficient transforming events over time, leading to the development of hematopoietic
malignancies and explaining the increased incidence of hematopoietic malignancies in older adults.16 If
so, the characterization of the nature and identity of ARECs may provide insight into the biology of
normal aging and the development of age‐associated diseases such as cancer.
Both genetic and epigenetic mechanisms are involved in generating specific age‐related
expression changes (ARECs) in hematopoietic cells. Werner syndrome is an extensively studied
functions as a DNA helicase and exonuclease, aiding normal recombination and repair.142 The common
WRN mutations result in a truncated protein that lacks appropriate and necessary nuclear
localization,143 and the subsequent decrease of WRN activity leads to the accumulation of genetic
damage, genetic instability, premature aging, and cancer.142 It is unclear whether the decrease in WRN
expression and/or its activity plays a role in “normal” hematopoietic aging; however, expression profiles
in fibroblasts of Werner syndrome patients and older adults reveal a set of common ARECs as compared
to young healthy controls.144 In addition, WRN activity is lost in a number of age‐related diseases,
including several malignancies.145,146 Taken together, these data suggest that Werner syndrome may be
a reasonable model for “normal” aging and the development of age‐related disease.144
Some ARECs may directly facilitate the transformation process (T‐ARECs). We recently
examined the ARECs in human and murine HPCs/HSCs and found that interferon regulatory factor 8
(IRF8) displayed robust ARECs with in human CD34+ cells, murine long‐term repopulating HSCs (LTR‐
HSCs), and human T‐cells.147 In all three hematopoietic cell types, IRF8 expression decreased with aging.
Previously, IRF8 insufficiency has been associated with the development of hematopoietic malignancies
in murine models,148,149 and many human hematopoietic malignancies (AML, CML, MDS) display
decreased IRF8 expression.150‐152 These results suggest that IRF8 insufficiency with aging may facilitate
transformation, but additional studies will be required to confirm these results and to identify potential
other T‐ARECs, if they exist.
In an interesting twist, some ARECs appear to play a role preventing the development of age‐
related diseases such as cancer. For example, cyclin‐dependent kinase inhibitor 2A (CDKN2A, a.k.a.,
p16INK4a) is a tumor suppressor gene that regulates the cell cycle,153 and loss of CDKN2A function is
associated with hematopoietic malignancies, most notably acute lymphoblastic leukemia.154,155
However, numerous studies have found that CDKN2A expression increases in an age‐dependent manner
in most tissues, including the hematopoietic system.133,156,157 TP53, another tumor suppressor gene, also
displays a similar paradoxical expression pattern in aging and malignant transformation. Like CDKN2A,
loss of TP53 activity promotes the development of hematopoietic malignancies,158‐161 and in mice, a
“hyperactive” TP53 phenotype has been found to protect against cancer development. However, these
same mice displayed a 20% reduction in life‐span as compared to their TP53 wild‐type counterparts, and
in fact, the TP53 hyperactive mice prematurely develop classic signs of aging (e.g., osteoporosis and
tissue atrophy).162 Furthermore, genetic polymorphisms in TP53 that modulate its expression have been
found to be associated with age‐related conditions and altered human survival curves.163,164 For
example, subjects with the TP5372‐Pro/Pro genotype (associated with a reduced TP53 apoptotic potential
and activity) have an increased risk of cancer (2.54 fold, P = 0.007), but they also have a 41% increased
overall survival (P = 0.032) when compared to TP5372‐Arg/Arg carriers.164 These controversial results
suggest that increased TP53 activity may protect against cancer at a cost of longevity. A more recent
study found the apparent TP5372‐Pro/Pro benefit may be more related to improvements in survival after
the diagnosis of life‐threatening diseases than an actual decrease in the “aging” process per
se.108,163,165,166 Taken together, these and other studies suggest a delicate, evolving balance between the
need for cell survival and an increased susceptibility for transformation as we age. In this model, DNA
transformation. Unfortunately, this protection comes at a price, namely, an age‐related decline in the
ability to replenish the tissues and cellular exhaustion of organ systems. If P‐ARECs are lost due to
genetic or epigenetic events, aging cells may more readily acquire necessary and sufficient transforming
hits that lead to development of malignant clones (Figure 3).
New advancements in microarray design and labeling techniques have reduced the quantity of
starting material necessary to detect ARECs. Most investigations have examined either non‐
hematopoietic tissue (e.g., fibroblasts, muscle, brain) or murine‐derived hematopoietic cells. Chambers
et al. identified approximately 3100 ARECs in murine HSCs. These investigators found an age‐dependent
down‐regulation of genes involved in chromatin remodeling and maintenance of genomic integrity,
while there was a concomitant increase in the expression of genes associated with stress responses,
inflammation, and protein aggregation.135 Rossi et al. examined a slightly less differentiated population
of murine LTR‐HSCs, and this study found marked ARECs for genes associated with myeloid
development, which may provide some insight into the age‐associated myeloid skewing.167
Furthermore, older LTR‐HSCs also displayed increased expression of some genes that have previously
been recognized as being involved in leukemic transformation.167 Due to the limited capacity to obtain
highly purified populations of human HSCs, there have been relatively few studies examining ARECs in
human hematopoietic progenitor cells. We recently found a number of genes with ARECs in human
CD34+ and CD34+/38‐ cells, some of which also displayed similar ARECs in murine HSCs from other
studies.147 Prall et al. has also examined ARECs in a limited number of human CD34+ cells.168 These
studies identified three genes with major ARECs: KU‐antigen 70 kD (KU70), microsomal glutathione S‐
transferase 1 (MGST1), and BCL2‐interacting killer (BIK).168 The relatively small numbers of samples
used in each of these studies limit the power to identify significant ARECs and assess potential inter‐
individual variations in expression. Additionally, even the most highly purified populations of cells are
probably composed of relatively heterogeneous subpopulations. Thus, many apparent ARECs may
merely reflect the inability to select and examine truly identical cell populations in young and older
adults.
FACTORS IMPACTING HEMATOPOIETIC EXPRESSION
Hematopoietic cells are constantly receiving, sending, and managing signals that are integral to
the control of normal hematopoiesis. Key issues assigned to the hematopoietic microenvironment (i.e.
“niche”) are the maintenance and protection of the HSC pool, regulation of mitogenic signals, and
oversight of appropriate differentiation. The importance of the microenvironment is illustrated in the
case of an ablative transplantation. Immediately after transplantation, HSCs rapidly “home” to the
appropriate hematopoietic niches within the bone marrow microenvironment.169 There are numerous
factors that contribute to the homing nature of HSCs, some of which are cell‐dependent, while others
are microenvironment‐dependent. For example, primitive hematopoietic progenitors express calcium‐
sensing receptor (CaR) molecules. These CaRs detect and act upon subtle differences in calcium
gradients and control the homing of HSCs to the appropriate stem cell niches.170
At a macroscopic level, the hematopoietic system must respond to environmental stressors such
directly impact the expression profile of normal hematopoietic cells.5 Radiation exposure is one of the
most extensively studied environmental exposures. Numerous studies indicate that even low doses of
radiation promote expression changes in normal hematopoietic cells.171‐175 Many radiation‐induced
expression changes involve genes that control cell cycle and DNA‐repair pathways, with p53 signaling
being the classical example,175,176 and even low doses of radiation have been found to induce expression
of CDKN1A (a.k.a., CIP1, p21), DDB2, and XPC, all of which play direct or indirect roles in the p53
signaling pathway.177 The fact that such low doses of radiation exposure can induce significant
expression changes may be directly relevant to expression studies of normal and abnormal
hematopoietic cells. For example, at least one study has found that airline pilots have a relative
increase frequency of number of chromosomal translocations in their peripheral blood cells, and
retrospective analyses suggest that flight attendants may have a slightly higher risk of certain
cancers.178,179
Investigators have also examined the effect of toxins, such as tobacco smoke, metal fumes, and
bacterial endotoxins, on gene expression in human hematopoietic cells.180‐182 Tobacco smoke inhalation
clearly induces the expression of numerous genes in peripheral blood cells.183‐185 Specifically, smoking
promotes expression changes associated with the inflammatory response (increased CCR2 and IL1β),
carcinogen metabolism (increased CYP1B1), oxidative stress responses (increased SOD2), and
apoptosis/cell cycle (increased CDKN2B).183,184 Physical displacement of populations of cells (for
instance, due to local toxic damage/death or inflammatory cell recruitment) may be responsible for
some of these expression changes; however, even in studies that carefully controlled for “cell
population shifts,” there continues to be smoking‐related expression changes.185,186 These molecular
changes certainly seem appropriate in light of data that indicate increased inflammation and DNA‐
damage within peripheral blood cells from tobacco smokers.187,188
A critical environmental factor, often overlooked in expression studies, is medications.
Approximately 80% of people over the age of 18 take at least one medication each week, and the
number of medications taken per individual increases with age, with 23% of women over the age of 65
years taking at least 5 medications.189 It is unknown how most medications impact the transcriptome in
hematopoietic cells from healthy volunteers or patients. To complicate the matter further, recent
studies reveal that some disorders may be associated with reproducible expression changes in the
hematopoietic system, despite the absence of a known abnormal hematopoietic phenotype. For
example, characteristic “abnormal” expression signatures in hematopoietic cells have now been
identified for depression, bipolar disease, and psychosis.190 In the case of depression, drugs such as
selective serotonin uptake inhibitors (SSRIs) decrease expression of serotonin transportors,191 and in
fact, may reverse the underlying “abnormal” expression profile in the peripheral blood.190 Likewise,
patients with bipolar disease or schizophrenia display increased transcription of dopamine D3 receptor
(DRD3) in peripheral lymphocytes that also reverts back to near normal levels after treatment with anti‐
psychotic medications.190
Expression in normal hematopoietic cells is a tightly controlled and poorly understood process,
which is impacted by numerous factors including intrinsic changes within the cell (e.g., age) and
environmental exposures (toxins, ligands, etc.). In addition, these expression responses must be
overlaid upon the inherent genetic variation in the population. In order to better understand the
interactions of genetics and environment on the hematopoietic organ, there is a crucial need for a more
precise and detailed characterization of normal hematopoietic subpopulations. This includes the
development of techniques to identify and isolate the most primitive hematopoietic stem cells.
Advancements in the field of single‐cell capture methods, as well as methods to perform wholesale
genetic analyses on ever‐lower amounts of DNA, RNA, and protein, hold considerable promise. In
addition, there is a profound need to better understand how the micro‐ and macro‐environment are
controlling hematopoiesis. It is difficult to imagine that an isolated hematopoietic cell in culture has a
similar or identical biological response as that same cell in the blood or bone marrow niche. In the future
one can imagine that the study of peripheral blood gene expression will tell us much about disease
propensity, potential treatment response and toxicity, and perhaps be a “canary” of environmental
insult.
FIGURES
Figure 1: Factors To Be Considered When Examining Expression in Normal Cells- Figure illustrates a selection of the many factors influencing expression changes in normal and malignant hematopoietic cells.
Physical Manipulation of Normal Cells
Type of Platform Used for Studies
Differentiation Stage of Normal
Cells Exogenous Factors
Affecting Normal Cells Definition Of “Normal” Cells Inter-individual Biological Differences Cell Expression Physical Manipulation of Normal Cells
Physical Manipulation of Normal Cells
Type of Platform Used for Studies
Type of Platform Used for Studies
Differentiation Stage of Normal
Cells Differentiation Stage of Normal
Cells Exogenous Factors
Affecting Normal Cells
Exogenous Factors Affecting Normal
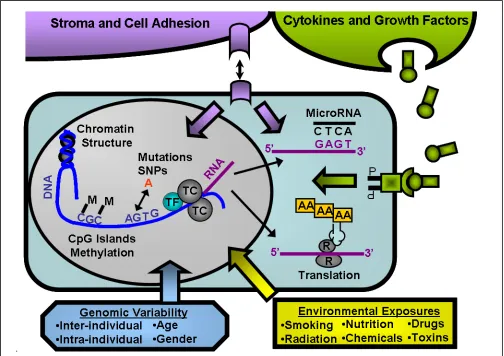
Figure 2: Intracellular and Extracellular Modulators of Gene Expression in Normal Hematopoietic Cells- Figure shows a simplified illustration of the complex nature of expression in normal hematopoietic cells. Multiple exogenous factors, such as adhesion molecules (purple), cytokines/growth factors (green) and environmental exposures (yellow) are constantly impacting the expression signature. Chromatin structure controls the accessibility of transcription factors (TF, light blue) and the transcription complex (TC, gray) to the DNA. Methylation of CpG islands in promoter regions and other parts of the gene also limit the ability of TF and TC to bind to the DNA. Once RNA is made, it migrates outside of the nucleus, where other post-transcriptional regulators, such as microRNAs (black sequence), influence the expression and ability of the RNA to be translated. In addition, it is here that many of the critical post-translational modifications occur (not shown).
Young Older
Pre-Malignant Malignant
Young Older
Pre-Malignant Malignant
Table 1. Type of Membrane Bound Receptors on Hematopoietic Cells.
Receptor Ligand
Name Symbol Alias Family Name Symbol Alias
Receptor Tyrosine Kinase (RTK). All 5 members of RTK family.57,71-73 Ligand
v-kit Hardy-Zuckerman 4 feline sarcoma viral oncogene homolog
KIT CD117, C-KIT PDGFR, RTK III KIT ligand KITLG SCF, KL-1
Platelet-derived growth factor
receptor, alpha192 PDGFRA CD140A PDGFR, RTK III Platelet-derived growth factor, alpha PDGFA
Platelet-derived growth factor
receptor, beta192 PDGFRB CD140B PDGFR, RTK III Platelet-derived growth factor, beta PDGFB SIS, SSV
FMS-related tyrosine kinase 3192 FLT3 CD135, FLK2 PDGFR, RTK III FLT3 ligand FLT3LG FL
Colony stimulating factor 1 receptor CSF1R CD115, FMS PDGFR, RTK III Colony stimulating factor (macrophage)
CSF1 MCSF
Cytokine Receptors (CKRs). Selected set of CKRs involved in hematopoiesis.58,59,193 Ligand
Colony stimulating factor 2 receptor, composed of two different subunits194,195 CSF2RA, Unique to CSFR CD116, GMCSFR Cytokine Receptor Superfamily, Type 1, CKR I
Colony stimulating factor (granulocyte
-macrophage)
CSF2 GMCSF
CSF2RB, Common also to IL3 and IL5 receptors
CD131, IL3RB, IL5RB
Colony stimulating factor 3 receptor CSF3R CD114, GCSFR CKR I Colony stimulating factor
(granulocyte) CSF3 GCSF
Erythropoietin receptor EPOR --- CKR I Erythropoietin EPO ---
Myeloproliferative leukemia virus oncogene
MPL CD110, TPOR CKR I Thrombopoietin THPO TPO
Interleukin receptors (Most interleukin receptors but not IL10 or IL 20) IL2RA, IL2RB, IL2RG, IL3RA, IL6R respectively CD25, CD122, CD132, CD123, CD126 respectively
CKR I Interleukin 2, Interleukin 3, Interleukin 6
IL2, IL3, and IL6 bind to their appropriate receptors.
Interferon receptors, IL10, and IL20 IFNAR1,IFNAR2, IFNGR1,IFNGR2
IFNGR1 (CD119)
CKR 2 Interferon alpha, interferon beta, interferon gamma
IFNA and IFNB bind IFNAR1/2; IFNG binds IFNGR1/2
Protein Tyrosine Phosphatatases Receptors (PTPRs). Selected members from 38 classical
PTPRs.60,61 Ligand
Protein tyrosine phosphatase,
receptor type, C
PTPRC CD45, LCA Receptor Type I Specific ligands are not well characterized for PTPRs. Many PTPRs interact and regulate other molecules/receptors in the cell membrane or are involved in cell-cell and cell-matrix interactions. There is also a separate class of non-receptor protein tyrosine phosphatases (PTPNs). Protein tyrosine phosphatase,
receptor type, F
PTPRF LAR Receptor Type II
TGF-β Superfamily of Receptors62,196 Ligand
Transforming growth factor Beta Receptor I
TGFBR1 ALK5 Type 1 Receptors Numerous ligands that bind to the various combinations of receptors. In most cases, a type 1 receptor will pair with a type 2 receptor to form the functioning receptor complex. Some ligands include TGFβ1, TGFβ2, TGFβ3, activin βA, activin βB, activin βC, nodal, BMP2 - 7, GDFs, and AMH.
Specific activin receptor-like kinases (ACVRL) and activin receptors (ACVR) ACVRL1, ACVR1, ACVR1B, ACVR1C ALK1, ALK2, ALK4, ALK7 respectively
Type 1 Receptors
Bone morphogenetic protein
receptors (BMPR) BMPR1A, BMPR1B ALK3, ALK6 respectively Type 1 Receptors
Transforming growth factor Beta
Receptor I TGFBR2 TGFβRII Type 2 Receptors
Activin receptors (ACVR) ACVR2,
Bone morphogenetic protein receptors 2
BMPR2 BMPRII Type 2 Receptors
Anti-Mullerian hormone receptor 2 AMHR2 MISRII Type 2 Receptors
TNF Receptors (Selected members from more than 29 different TNF receptors)63,64 Ligand
Tumor necrosis factor receptor 1 TNFR1 CD120a --- Both TNF (a.k.a. TNFA, TNF-α) and TNFB can bind to either receptor.
Tumor necrosis factor receptor 2 TNFR2 CD120b --- Tumor necrosis factor receptor,
superfamily 10A
TNFRSF10A CD261, DR4,
TRAILR1
--- Tumor necrosis factor ligand superfamily, member 10 (aka TNF-related apoptosis- inducing ligand, TRAIL) binds to both receptors.
Tumor necrosis factor receptor, superfamily 10B
TNFRSF10B CD262, DR5,
TRAILR2
---
Notch Receptors51,65,197 Ligand
Notch homolog, 1 - 4 NOTCH1- NOTCH4
--- Type 1
Transmembrane Receptors
Delta-like family of ligands (DLL1, DLL3, DLL4) and Jagged family (JAG1, JAG2) bind Notch
Receptors.65
Wingless-type MMTV integration site family members (WNT) Receptors66,198 Ligand
Frizzled homolog, 1 - 10199,200 FZD1 - FZD10, --- G-Protein-coupled
Receptors, Class 6
FZD and LRP combine to form a receptor complex that binds to Wingless-type MMTV integration site family members (WNTs)
Low density lipoprotein
receptor-related protein, 5 and 6201 LRP5 and LRP6 LRP5 (a.k.a., BMND1, EVR1);
LRP6 (a.k.a., ADCAD2)
---
CXC Chemokine Receptors (Selected members from the 6 known CXCRs)67 Ligand
CXC chemokine receptor 4 CXCR4 CD184, Fusin G-Protein-coupled Receptors, Class 1, Subfamily A2
Binds C-X-C motif ligands, 12; CXCL12
CXC chemokine receptor 5 CXCR5 CD185, Burkitts
lymphoma receptor 1
Binds C-X-C motif ligands, 15; CXCL15
Chemokine Receptors (Selected members from the 10 known CCRs)68 Ligand
Chemokine receptor 1 CCR1 CD191 G-Protein-coupled
Receptors, Class 1, Subfamily A1
Binds C-C motif ligands, 3 or 5; CCL3, CCL5
Chemokine receptor 2 CCR2 CD192 Binds C-C motif ligands, 2; CCL2
Table 2: Tools for Gene Profiling
Assessing Genomic Changes:
Genomic Throughput Resolution Material
Required
Limitations Data Provided
Pyrosequencing High Primary Sequence DNA,
nanograms
Expense Complete Sequence
SNP Arrays High Up to 1 million SNPs per
Genome
DNA, nanograms
Expense SNP variation, CNV, LOH
PCR/Sequencing Moderate-low Primary Sequence DNA,
picograms
Limited number of genes
Sequence between primers
Epigenetics Throughput Max Resolution Material
Required
Limitations Data Provided
Methylation Arrays High Increasing DNA,
nanograms
Requires sequence modifications
Methylation at CpG islands
Methylation-specific PCR Low Specific target sequence DNA, nanograms
Requires sequence modifications
Methylation at CpG islands
Methylation-specific Restriction Enzyme Protection PCR Assays
Low Specific target sequence DNA, nanograms
Requires methylation be at restriction site
Methylation at restriction enzyme cutting sites
CHiP-on-chip Assay High > 200,000 specific DNA and/or promoter sequences
Cells, ≥ 10,000
Antibody quality and technically challenging
DNA sites of histone binding and type of histone
Assessing Transcriptome Changes:
Transcription Throughput Max Resolution Material
Required
Limitations Data Provided
Whole transcriptome sequencing High Primary sequence RNA, nanograms
Cost All transcript isoforms
RNA and microRNA arrays High > 20,000 transcripts and/or genes
RNA, micro - nanograms
Cost, miss genes or isoforms not included on array
Quantitative expression of transcripts included on the array
RT/PCR amplification Moderate Selected gene RNA,
picograms
Not useful for discovery studies
Quantitative expression