Published online June 30, 2014 (http://www.sciencepublishinggroup.com/j/ijssn) doi: 10.11648/j.ijssn.20140202.11
Comparative performance of forwarding protocols based
on detection probability and search angle in a Multi-hop
CDMA wireless sensor networks
Uma Datta
1, Sumit Kundu
21Electronics & Instrumentation Dept., CSIR-CMERI, Durgapur, India 2Dept. of ECE, National Institute of Technology Durgapur, Durgapur, India
Email address:
[email protected] (U. Datta), [email protected] (S. Kundu)
To cite this article:
Uma Datta, Sumit Kundu. Comparative Performance of Forwarding Protocols Based on Detection Probability and Search Angle in a Multi-hop CDMA Wireless Sensor Networks.International Journal of Sensors and Sensor Networks. Vol. 2, No. 2, 2014, pp. 14-25. doi: 10.11648/j.ijssn.20140202.11
Abstract:
Energy conservation is one of the most important issues in wireless ad hoc and sensor networks, where nodes are likely to rely on limited battery power. Many new algorithms have been proposed for the problem of routing data in sensor networks. In this paper, we propose a new forwarding technique where nodes are placed in a random fashion maintaining a minimum distance between any two nodes and study its performance on a multi-hop CDMA wireless sensor network (WSN). a new routing protocol where selection of intermediate node is based on a metric combining detection probability and maximum forwarding distance towards the sink is proposed to reduce retransmissions in a wireless channel impaired by path loss and shadow fading. We provide a detail description of the routing scheme based on the proposed concept and report on its energy and latency performance using end-to-end ARQ between source and final destination. Performance of this scheme is compared with an existing search angle based protocol, called nearest neighbor based forwarding, where an intermediate node in the route selects the nearest node within a sector angle, considered as search angle, towards the direction of the destination as the next hop. Lifetime of network in both cases is compared. Further, all parameters are estimated by incorporating error control scheme as applicable to WSN and compared with simple ARQ scheme. A solution for packet size optimization is introduced such that the effect of multi hop routing by varying different parameters are captured. Optimization solution is formalized by using different objective functions, i.e., packet throughput, energy efficiency, and resource utilization.Keywords:
Multi-Hop Communication, Forwarding Protocol, Search Angle, Route Diversity, Packet Size Optimization, Node Lifetime1. Introduction
In wireless sensor networks energy conservation is one of the key technical challenges. It is necessary to devise networking schemes which make judicious use of limited energy resources without compromising the network connectivity and the ability to deliver data reliably to the intended destination. Many new algorithms have been proposed for the problem of routing data in sensor networks. Almost all of the routing protocols can be classified as data-centric, hierarchical or location-based although there are few distinct ones based on network flow or QoS awareness [1]. Data-centric protocols are query-based and depend on the naming of desired data, which helps in eliminating many redundant transmissions.
angle in such scheme. Geographic–information-based forwarding (GIF) is an efficient scheme for finding the appropriate relay node for next hop utilizing the location information while avoiding a large number of control packets during route discovery. The routing scheme where selection of next relay node is based on maximum advanced distance, to minimize the number of hops from the source to the destination node, is described in [3], ignoring the unreliability of wireless channel. Consequently, performance may degrade substantially over a bad channel and consumes more energy for successful reception of a packet due to increase in number of retransmissions. An effective approach for the reduction of unnecessary retransmission due to propagation impairment is to choose the next hop relay node that is in good channel condition. An efficient advancement metric (EAM) is proposed in [4], considering the forwarding distance and the probability of successful packet transmission in a wireless channel situation within a specified region, defined by (Rf,φ/2)to
) 2 / ,
(Rf −φ , as shown in Fig.1. However, in a wireless channel impaired by path loss and shadow fading, a new routing protocol where selection of intermediate node is based on a metric combining detection probability following [6], and maximum forwarding distance towards the final destination may provide another solution where reduction of unnecessary retransmission due to propagation impairment may be possible.
Figure 1. Scenario of a source node and the potential relay nodes in Channel Aware Geographic Informed Forwarding (CAGIF) protocol [4].
Given that the sensors have limited energy, buffer space, and other resources, different MAC protocols are being developed by several researchers. To handle a large number of nodes, where a number of nodes simultaneously and asynchronously access a channel, CDMA is a good choice as a MAC protocol [7, 8, 9]. CDMA has been widely used in cellular networks where power control is required to combat the near-far problem. As WSN are operated without any central infrastructure and all nodes are battery operated with simple transceivers, it is difficult to achieve perfect power control. CDMA has been advocated for WSN in [7, 8], where distribution of interference power in randomly distributed nodes is discussed. BER and energy consumption in CDMA WSN multi-hop communication with fixed hop length is studied in [10] using infinite automatic repeat request (ARQ) with CRC. Above analyses of multi hop communication do not include any routing
topology for the selection of neighboring nodes until it reaches the destination.
Framework as proposed in [2, 3, 4], where the positions of the nodes are random, are more realistic sensor network scenarios. In this paper, considering random placement of nodes, we are proposing one new routing protocol where selection of intermediate node is based on a metric combining probability of detection of neighbors considering a maximum forwarding range in shadowed environment [6] and maximum advanced distance towards the final destination. We are analyzing the performances of CDMA based WSNs using the proposed routing protocol and compare with the routing protocol as proposed in [2] considering the same wireless channel environment.
ARQ and forward error correction (FEC) are the key error control strategies in wireless sensor networks. Hybrid ARQ (HARQ) scheme, incorporating both retransmission and FEC, is another approach to minimize energy[11,12]. Proper combination of ARQ and FEC using different retransmission strategies needs investigation for minimization of energy. For example, hop by hop error detection and correction scheme using error control code results in higher energy consumption at every node, especially due to significant energy consumption for decoding which reduces network life time in turn. However, if decoding is considered only at the sink which is not energy constrained, power consumptions at intermediate nodes may be reduced significantly. This technique may be investigated in designing an efficient wireless sensor network.
Further, the determination of optimal packet size is important parameters for energy constrained and delay sensitive WSN. A cross layer solution for packet size optimization is presented in [13], where cross layer effects of multi hop routing, the broadcast nature of wireless channel using carrier sense mechanism, and the effects of error control techniques are captured. Such analysis may be extended in context of designing an efficient CDMA based multi hop WSN.
In the present paper, our contributions are as follows: 1. A new forwarding protocol in a random WSN, keeping a minimum distance between any two nodes as in [8], is proposed and simulated on MATLAB; which captures preselected probability of detection and maximum forwarding distance towards the final destination and, considering path loss and log normal shadow fading.
2. We apply this protocol on a CDMA based WSN for performance evaluation. An analytical framework has been developed to model the MAI and NI at each hop to evaluate link BERs followed by average route BER between the sink and the source.
3. An appropriate model has been used to evaluate the energy consumption and delay for successful delivery of a packet from a source node to sink in multi hop using end-to-end ARQ and HARQ type I (HARQ-I) scheme using BCH coding, where decoding is done only at sink.
the model where selection of next hop neighboring node is based on the nearest node within a sector of angle (θ) towards the direction of the destination as proposed in [2] considering same wireless channel condition having same reference distance between source and destination as in the proposed protocol.
5. Impact of different network parameters like node density, search angle, probability of detection on energy consumption, delay are analyzed and compared using the schemes.
6. Network lifetime, which is defined as the time to the first node failure in the path [2], is evaluated in each case and compared.
7. Packet size optimization is formalized by using three different objective functions, i.e., packet throughput, energy efficiency, and resource utilization.
The remainder of the paper is organized as follows: The system model for the existing search angle based and the proposed protocol is presented in section 2. Section 3 presents our analytical approach to evaluate the end-to-end BER, energy consumption, delay, and node/network lifetime. Cross layer solution for packet optimization is discussed in section 4. Results based on our developed frame work are presented in Section 5. Finally we conclude in Section 6.
2. Network Model and Problem Description
In this section, we describe the wireless sensor network model using two forwarding protocols and the basic assumptions considered in the paper.
A. Routing Protocol Based on Search Angle
We consider a routing scheme following [2], where each intermediate node in a multi-hop route selects the nearest node within a sector of angle 'θ' towards the direction of the destination as the next hop as shown in Fig.2. Let ‘W ’ be a random variable denoting the distance to the nearest neighbor (as indicated by rR in earlier chapters) in a two dimensional Poisson node distribution.
Figure 2. Multi-hop route between the source and the destination in a random topology following nearest neighbor based routing protocol [2].
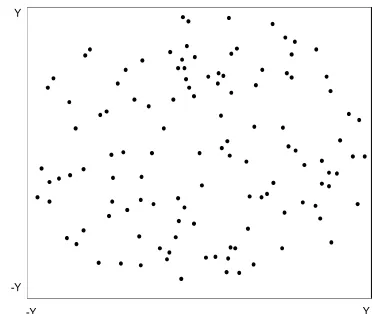
For a fixed node spatial density with large'N', the CDF of the distance to the nearest neighbor within a sector angle of 'θ' in a torus, as expressed in [2] is appropriately modified in context of our network scenario, as shown in Fig.3 where we incorporate a minimum distance ( r0 ) parameter as:
Y -Y
-Y Y
Figure 3. Network with random distribution of sensor nodes.
otherwise. 0
1 1 ) (
0 2 / ) ( )
(
2 0 =
≤ ≤ −
=
> =
− r w Y
e Y w w
F
r w W
sθ
ρ θ
(1)
The number of hops depends on the node density of the network, search angle 'θ' and distance between the source and destination. In our analysis we consider an average number of hops to evaluate the performance of WSN. The average number of hops on a route depends on the value of search angle (θ) and is estimated as [Panichpapiboon, 2006; Panichpapiboon, 2004]:
] cos [ ⋅ ς
=
W E
Z
nrand (2)
where Z is the average length of the reference path between a source and destination node. Here E[W⋅cosς] is the average projected hop length and Z can be represented by
)] 2 1 ln( 2 [
3 + +
=Y
Z (3)
In our analysis, we assume that each hop deviates with respect to the reference path, by an angle ς, where ς is uniformly distributed in the interval between (θ/2,−θ/2) as shown in Fig.1. Following [2], average projected hop length E[Wcosς]is expressed by:
] [cos ] [ ] cos
[W
ς
EW Eς
E = ⋅ (4) For large network area, following [14], it can be shown that in our case, E[W]≈ π/(2ρSθ)+r0 , and
) 2 / sin( ) / 2 ( ]
[cosς ≈ θ ⋅ θ
E
Thus, we obtain the average number of hops as:
) 2 / sin( ) / 2 ( ) ) 2 /( (
)] 2 1 ln( 2 [ 3
0 θ θ
θ ρ
π + ⋅ ⋅ + + =
r Y n
S
B. Forwarding Protocol Based on Probability of Detection:
We propose an algorithm for the selection of next hop neighbors as intermediate nodes for the multi-hop path between source node and the final destination i.e. sink node. We consider a network architecture as shown in Fig.2, where nodes are randomly distributed keeping minimum distance between any two nodes, equal to r0 . We are
focusing on a circular region of radius Z, as stated by (3), to keep the reference distance between the source and sink almost same (equal to Z ) in both cases, i.e. the proposed scheme and nearest neighbor based scheme, for performance comparison. Sink is considered to be at the centre and sources are at the periphery. Other nodes are considered only as intermediate relay nodes. Channel conditions, i.e. path loss and shadowing are assumed to be fixed at a particular level throughout the network. The proposed algorithm of the routing protocol, considering path loss and shadowing in the wireless channel, is simulated on MATLAB platform through following steps:
i) Locations of all nodes are assumed to be known. Node at the centre is considered as sink and nodes at the periphery region are considered as sources. Other nodes are considered only as intermediate relay nodes. Once a source node has a packet to send, selection of intermediate relay nodes to send the packet from source to the destination i.e. the sink is governed by the following steps:
ii) Channel conditions, i.e. path loss (β ), and shadowing ( σ ) are assumed to be fixed at a particular level. Considering a maximum forwarding distance and standard deviation of shadowing, average sensing distance,R , is evaluated using Table I as in [Tsai, 2008]. Next, following [Tsai, 2008], probability of detection of all other nodes in the network from the designated source node is estimated as:
(
(, ))
(10 log10( (, )/ ))det σ
β r in R
Q n i r
P R
R
⋅ ⋅
= (6)
where rR(i,n)is the distance between the transmitter and the ‘n-th’ node for i-th hop. Initially for the source node,
i=1.
iii) Amongst all nodes, the relaying node, i.e. the receiver for the present hop, is selected as the one who simultaneously satisfies the following conditions:
Having probability of detection greater than or equal to a preselected value, (Pdet)sel, i.e. Pdet
(
rR(i,n))
>=(Pdet)sel at that channel condition, closest to the destination, i.e. the sink, and towards the sink.iv) The selected relay node of the present hop will become the transmitter for the next hop. The relay node for the next hop, i.e. i=2, is found following same approaches of steps (ii) and (iii). This is repeated until the packet reaches the final destination through multi-hop transmission.
v) All hop distances for the selected relay nodes, i.e. )
, (i m
rR , where mis the selected node in i -th hop are
calculated from known locations, with i=1, 2, ----H, for H number of hops.
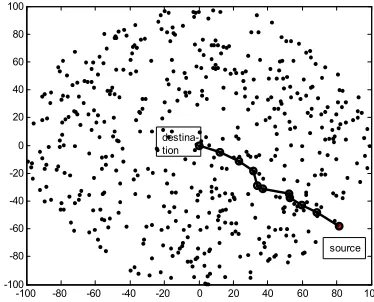
Selection of intermediate nodes based on MATLAB simulation is shown in Fig.4.
-100 -80 -60 -40 -20 0 20 40 60 80 100 -100
-80 -60 -40 -20 0 20 40 60 80 100
source
destina-tion
Figure 4. Possible multi-hop route between source and destination in a random topology following the proposed protocol.
C. MAC Protocol and Transmission Scheme
Here we consider CDMA-based MAC protocol. In this present work we assume two routing protocols separately, where a node can identify its intended neighbor, governed by the routing protocols as described above, ensures the data flow from source to sink in multihop. For example in Fig.5, destination node, i.e. sink, D is receiving information from the source nodes S, S1, S2, S3 etc., via multi-hop communication using digital relays, as employed in any regenerative systems. Relays regenerate the received signal and then transmit the same with power control to the next hop. As we are considering a CDMA sensor network, any node can transmit to its nearest next neighbor node at any time, so that source information finally reaches at the destination D. At a particular instant, considering two protocols separately, we assume that nodes (f,h,i), (d,e,h,i), (j,k,l), (a,b,c) are used as intermediate nodes to route the information from source nodes S, S1, S2 ,S3 respectively to the sink, i.e. the destination D. Here we consider that each transceiver is having a receive threshold Pr . Each transmitter adjusts its transmission power so as to achieve a given level of received power (Pr) at its intended receiver. Accordingly the transmit power depends upon the distance between the transmitter and the receiver pair (rR(i)), and the statistics of shadowing. Several concurrent nodes those are sending their information to any intermediate relay node on the path, e.g. ‘h’ within the area πrR2would cause MAI at ‘h’. The concurrent transmitted signal power generated by the source/relay nodes situated within the interference range
I
Figure 5. Signal flow at a particular instant in multi-hop communication
3. Analysis of Route BER, Energy
Consumption, Delay, and Lifetime
We assume an average H number of hops between a source node and the destination node, or sink, i.e.
rand n
H= , as determined by (5). Channel conditions are assumed to be same for all the hops from source to sink.
3.1. Estimation of Interference Power
Following [10], the mean value of the collected interference power η′ from an interfering node (i.e. d is transmitting signal to it’s intended receiver e) to any desired receiver (i.e. h):
+ + − + = ′ 2 σ m 2 σ m 2 σ m 2 de R de R 2 de S de S 2 Sdh dh S .e .e η.e
η (7)
η
can be found out as in [8] as:(
)(
)
(
)
(
)(
)
RR I I I R P r r r r r r r r r r γ α α α α α α α = − − − − −
= +− −+ − − 2
0 2 2 0 2 2 2 0 2 2 0 2 2 0 2 R 4 4P
η (8)
where mSde , mRde are the mean and
σ
Sde ,σ
Rde are thestandard deviation of shadowing ( Sde ) and pce ( Rde )
respectively for an arbitrary path de . Further αis the path loss exponent 2<α<6 and mSdh , σSdhare the mean and standard deviation of shadowing of the path ddh between the nodes dandh.
3.2. Number of Potential Interfering Neighbors
Under the Poisson approximation, for very large number of nodes (N) and very small area of interference region compared to the total area (A), the expected numbers of nodes within the receiving and interference range of the receiver are [8]
) -r π(r
c1=ρS I2 R2 (9)
2 2 SπrR
c =ρ (10)
where ρS is the node density, rI is the interference distance equal to 2rR . Activity factors determine the number of active nodes at any instant in the two layers contributing MAI and NI, which are fractions of c1 and
2
c as given in (9) and (10).
3.3. Estimation of Average Route BER, Energy Consumption and Latency
With direct sequence BPSK of spreading bandwidthBW, and for constant received signal power levels with power control error, following [10, 16], the mean probability of error at any hop can be approximated by:
= = BW I R e P Q E Q P b R R b e 2 2 χ
( )
ψφ Qe
BW e P R e P Q R b R R =
= 2 (11)
We estimate average BER for each hop individually as each hop, having average distance of rRifor i-th hop, will have different number of interferers. Next we estimate the average route BER considering an average number of ‘H=nrand’ hops. The route BER for H hops, without any error correction mechanism applied at the intermediate relay nodes, is expressed by the relation [14],
∏
=
−
−
=
H i i H e eP
P
1 ) (1
1
)
(
(12)where (i)
e
P is the mean probability of error at i-th hop. Further nf bits/packet is considered in forward transmission of information and nbbits/packet for NACK /ACK with an assumption of instantaneous error free reception of NACK/ACK. Assuming perfect error detection of a CRC code and infinite retransmissions, ARQ and HARQ-I mechanisms are used for error correction. In the present schemes, the packet is checked only at destination (D) for error control; retransmissions of the packet are requested to source (S), with a NACK coming back from D to S via the same multi-hop path till the packet is received correctly. Considering the sink is not an energy constrained node, two schemes of error control are proposed:
Scheme I: Error control is based on simple ARQ, i.e. the packet from source consists of nf bits message including CRC, and overhead (β bits) is transmitted and is checked at sink only for correctness. It sends a retransmission request to the source for an entirely new retransmission in case of receipt of erroneous packet.
(HARQ-I), where the packet from source consisting of
BCH
ℓ bits including f
n bits message, and encoding bits for one bit error correction capability using BCH coding is transmitted. At sink, the packet is decoded. It discards erroneous packets (when errors remain after BCH decoding), sends a retransmission request to the source for an entirely new retransmission. Retransmissions take place at the same code rate until the packet is correctly decoded.
Scheme I
Average end-to-end packet error level for H hops is
f e n H H f P
P ) 1 (1 ( ) )
( = − − (13)
where (Pe)His given in (12). Let successful delivery of a packet from source to destination is occurred at n th number of retransmissions. Average number of retransmissions for successful delivery of a packet [17]:
(
f H)
ARQ P
N) 1/1 ( )
( = − (14)
The energy Eb required to communicate one bit of information from source to sink through H-hop communication i.e. end-to-end delivery [18]:
b H
i
r ti
b P P R
E ( )/
1
∑
=
+
= (15)
where Rbis the data rate, Pti is the mean of transmitted power for i-th hop of length rRi, and is represented by [10]:
+ + −
=
R Ri 2 2ti 2 2
.
r
P
P
de R de R de S de S m me
e
σ σα (16)
We have included the energy consumption due to start-up transients of transceivers while calculating the energy consumption for data communication. It is observed that start-up energy consumed in the transmitter / receiver varies approximately from 10 micro Joule to 45 micro Joule [19], [20]. Assuming average start-up energy from sleep mode to either transmit/receive mode is equal to 10 micro Joule, the energy consumed per packet from source to sink, i.e. single loop transmission of information from source to sink via H hops, with ACK/NACK from sink to source via multi-hop is:
H
n
E
n
E
E
b f b bARQ
pkt
)
10
10
.
(
=
+
+
×
−3 (17)We assume that each node will be wake up, either in transmit or receive mode, from sleep state and will remain in the active state, without going to sleep state, until the information is received correctly at sink. Since on the average, each packet requires (N)ARQ number of retransmissions from source to destination for successful delivery, average energy consumed by a packet through
multi-hop communication of H hops is:
H n E n E N
EavARQ=( )ARQ.( b f + b b)+10×10−3. (18)
Energy consumed only by the message in single transmission, i.e. the effective energy
H R
n P P
E f b
H
i
r ti ARQ
eff (( ( ) ( ))/ 10 10 .
3 1 − = × + − ⋅ +
=
∑
β (19)where β is the number of overhead bits.
Average packet delay for successful transmission of packet is obtained as [21]:
b f ARQ ARQ
av N n R
D =( ) . / (20)
Now we describe the scheme incorporating HARQ-I using BCH coding.
Scheme II
The packet error rate (PER) for the scheme as in [11] is:
i H i H t i BCH BCH I
HARQ i Pe Pe
PER − = − − − =
∑
ℓ ℓ ) ) ( 1 .( ) ) (( . 1 ) ( 0 (21) ) ( fBCH = ∂+n
ℓ is the total number of bits to be
transmitted and is the sum of length of frame check sequence ∂, and nfbits as described above.
Average number of retransmissions for successful reception of a packet [17]:
) ) ( 1 /( 1 )
(NBCH= − PERHARQIBCH (22)
In the present case, we assume negligible energy for BCH encoding at source node, and energy consumed at sink is ignored since the sink is not an energy constrained node. With these assumptions, the energy consumed per packet by the source and relay nodes in single loop transmission of information via H hops including start up energy of each node, with ACK/NACK via multi-hop is:
H n
E E
Epkt)BCH b BCH b b 10 10 .
( = ⋅ℓ + ⋅ + × −3 (23)
where Eb is expressed in (15). Average energy required for successful delivery of packet
H n
E E
N
EavBCH =( )BCH.( b⋅ℓBCH + b ⋅ b)+10×10−3. (24)
Average packet delay for successful transmission of packet is obtained as [21]:
b BCH BCH bch
av N R
D =( ) .ℓ / (25)
3.4. Network Lifetime
battery energy denoted by Ebatt and packets are transmitted with average rate λt without queuing. The average energy depleted per second due to transmission and reception is simply λt⋅Epacket, where Epacket =Eav/H is the average energy consumed per node while delivering a packet successfully from source to sink in each scheme. Finally, the total time it takes to completely exhaust the initial battery energy of any node can be written as:
) /( t packet batt E
E ⋅
=
λ
τ
(26)This simple analysis does not take into account the energy consumed when a node is processing packets. Thus, the lifetime of a node will be shorter than what is predicted by our analysis.
4. Packet Size Optimization
Following [13], optimization framework based on end-to-end performance metrics using infinite ARQ between source and sink, as described in scheme I, is formulated. Optimization solution is formulated by using three different objective functions, which highlight different aspect of communication in WSN and can be selected according to the requirements. The two objective functions are defined as [13]:
1. Packet throughput: This function considers the end-to-end packet success rate and the average delay for successful reception of a packet of payload
) ( −β
= f d n
l through multi hop communication.
(
)
ARQav H f f
pktput n P D
U =( −β)⋅1−( ) / (27)
Maximizing this function, by setting ( pktput )=0
d
U dl
d ,
results in optimal packet size Loptpktput that achieve high packet throughput for a particular forwarding protocol and channel condition. After simplification, Loptpktput is expressed by:
(
)
2 ) ( 1 ln
4
2 β β
β −
− −
= H
pktput opt
e
P L
(28)
2. Resource utilization: This function considers both energy consumption and delay for successful reception of a packet, and is expressed by:
(
f H)
d ARQ av ARQ av
res E D l P
U = ⋅ / ⋅1−( ) (29)
where ld =(nf −β)is the message length. Minimizing this
function, by setting ( res)=0 d
U dl
d
, results in optimal
packet size ( Lresopt ), that balances the tradeoff between energy consumption and latency, especially useful for delay sensitive WSN. After simplification, Lresopt is obtained as:
(
)
2 ) ( 1 ln
4
2 β β
β −
− +
= H
res opt
e
P L
(30)
Energy efficiency is another objective function, which may be considered for optimization. Considering successful reception of a packet from source to sink, energy efficiency is expressed by:
ARQ av ARQ eff
E
E
/
=
ξ
(31)Maximizing this function results in optimal packet size, that achieves high energy efficiency.
However, considering startup energy, closed form solution of optimized packet length using energy efficiency
ξ is not straight forward to obtain. We evaluate it with the help of simulation under such startup energy included case.
5. Results
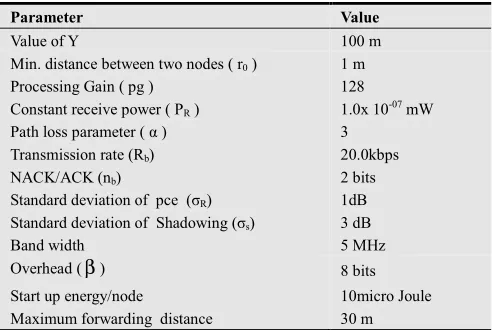
Same channel condition and average reference distance between source and sink are considered for both schemes. Parameters used in present analysis, based on semi-analytic method, are given in Table 1.
Table 1. Parameters used in the analysis.
Parameter Value
Value of Y 100 m
Min. distance between two nodes ( r0 ) 1 m
Processing Gain ( pg ) 128
Constant receive power ( PR ) 1.0x 10-07 mW
Path loss parameter ( α ) 3 Transmission rate (Rb) 20.0kbps
NACK/ACK (nb) 2 bits
Standard deviation of pce (σR) 1dB
Standard deviation of Shadowing (σs) 3 dB
Band width 5 MHz
Overhead (β) 8 bits
Start up energy/node 10micro Joule Maximum forwarding distance 30 m
by using (1) and (5) for search angle based protocol. The procedure adopted for the evaluation of link BER, followed by route BER and average route BER for the estimation of different QoS parameters, using the two forwarding protocols, are described below:
(A): Forwarding protocol based on search angle with nearest neighbor:
1. Average number of hops between source and destination nrandis calculated by using (5) for a particular search angle (θ), and reference distance as expressed by (3), considering Y=100m.
2. Average hop distances (rRi) are estimated using (1), by generating nrand number of random variables.
3. Link BER at each hop is evaluated using (11), followed by route BER for that θ using (12). Energy consumption at each link for transfer of fixed length information for a single realization of source to destination path is estimated.
4. Average route BER and route energy consumption for sending a fixed length information from source and receiving at sink through multi hop for a particular
θ
is obtained by computing arithmetic average of large number of realizations of route BER and route energy consumption. 5. Average delay for sending information from source to sink, node lifetime, and objective functions, like packet throughput, energy efficiency, and resource utilization are evaluated by using the value of average route BER and average route energy consumption using end to end ARQ.6. Parameters like node lifetime, delay for successful reception of information from source to sink are also estimated using end to end HARQ-I using BCH coding.
(B): Forwarding protocol based on probability of detection with maximum advancement:
Same channel condition and average reference distance between source and sink as previous protocol are considered. Under the proposed protocol, all link distances i.e.rRis’ are estimated after selection of intermediate relay nodes by the developed algorithm as described in section 2. Next the QoS parameters, e.g. node lifetime, delay are evaluated by similar method as in scheme A.
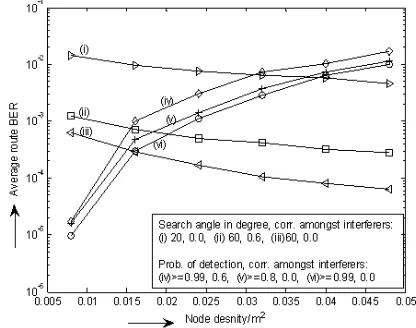
Fig.6 compares the variation of average route BER with node densities under two different protocols. Impact of search angles (θ) of nearest neighbor based protocol, and probabilities of detection with maximum sensing distance of 30m on proposed protocol are shown considering different correlation amongst interferers only. In case of nearest neighbor based protocol, increase in node density or search angle improves the link BER as described earlier. This in turn results in reduction in average route BER with node density or θ (curves i and iii). In case of channel sensitive forwarding protocol, higher probability of detection reduces distance of next hop neighbor for a fixed channel condition, which results in improved link BER followed by lower route BER (curves v and vi). With increase in node density, keeping probability of detection fixed at a level, number of interferers increases, which in turn increases the average route BER. Thus the proposed
channel sensitive forwarding protocol may outperform the other in some cases and choice of search angle plays an important role. Increase in correlation amongst interferers results in increase in link BER followed by increase in average route BER under both the protocols (curve ii, iii and curve iv, vi).
Figure 6. Variation of average route BER with node density and correlation amongst interferers under two different forwarding protocols.
Figure 7. Variation of average energy consumption/node for successful transmission of packet with node density under two different forwarding protocols.
Figure 8. Variation of average node lifetime with node density for two different forwarding protocols under E2E ARQ transmission.
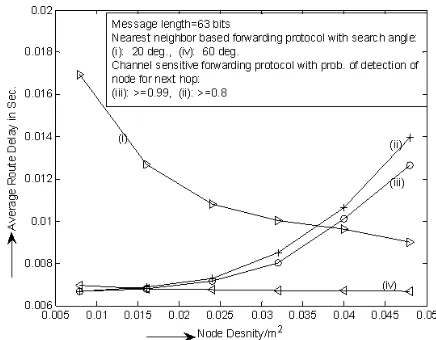
Fig.9 compares the variation of end to end (E2E) delay/latency with node densities under two forwarding protocols for successful transmission of a packet of length 63 bits using ARQ. Using nearest neighbor based forwarding protocol, average route BER improves with increase in node density as well as increase in search angle. Thus average delay of the network decreases with increase in θ or node density due to reduction in number of retransmissions (curves i, iv) under such protocol. However, in case of channel sensitive protocol, with increase in node density at a fixed probability of detection, as well as decrease in probability of detection keeping node density fixed; number of interferers increases, which increases delay (curves ii, iii) due to increased number of retransmissions.
Figure 9. Variation of average route delay with node density for two different forwarding protocols.
Fig.10 depicts and compares the variation of packet throughput (Upktput), as derived in (28) using end to end ARQ, with packet lengths under two different forwarding protocols for a fixed node density 0.016/m2. At low packet length region, low packet throughput is due to overhead, which is comparable with the packet length. At high packet length region, packet throughput decreases due to degradation in PER. This decrease is significant in case of low search angle, i.e. 20 degree, (curve vi) or low probability of detection, i.e. Pdet ≥0.6, (curve v). It is due to higher number of interferers, associated with higher hop length which occurs under the two cases as mentioned above, i.e. low θ, as well as lowPdet. With increase in
search angle or detection probability, route PER for a fixed packet length improves due to improved route BER. Subsequently, delay for successful delivery of packet decreases and packet throughput increases as in Fig.10. The optimized packet lengths (Loptpktput), as observed from the curves, for different search angles and detection probabilities, match approximately with those obtained directly by using (28), as shown in table 2.
Table 2. Optimized packet length using packet throughput for different search angles, probabilities of detection; node density 0.016/m2
Routing protocol based on search angle Routing protocol based on probability of detection
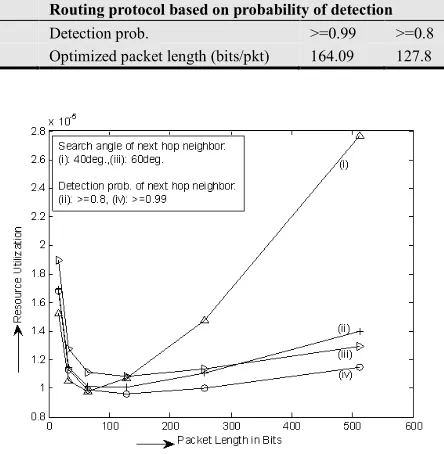
Search angle 400. 600 Detection prob. >=0.99 >=0.8
Optimized packet length (bits/pkt) 69.59 141.69 Optimized packet length (bits/pkt) 164.09 127.8
Fig.11 shows the variation of resource utilization (Ures), as in (30), with packet length under two different forwarding protocols for a fixed node density 0.016/m2, considering start up energy at each node. At low packet length region, Uresis significantly high due to reasonable size of overhead, which is comparable with the message length. At high packet length region, due to increase in number of retransmission,Uresincreases slowly. In case of low search angle, the rate of increase is appreciably high (curve i) due to high link distance and associated high BER. It is observed that there exists an optimum packet length, depending on the network condition, which yields minimum resource utilization beyond which resource utilization increases due to significant increase in route PER. The optimized packet lengths (Lresopt), as observed from the curves via semi-analytic approach match with those obtained numerically by using (30), as shown in table 3.
Figure 11. Variation of resource utilization with packet lengths for two different forwarding protocols.
Table 3. Optimized packet length using resource utilization for different search angles, probabilities of detection; node density 0.016/m2
Routing protocol based on search angle Routing protocol based on probability of detection
Search angle 400 600 Detection prob. >=0.99 >=0.8
Optimized packet length (bits/pkt) 65.82 137.80 Optimized packet length (bits/pkt) 160.18 123.92
Fig. 12 depicts the variation of energy efficiency, as expressed in (31), with packet length for a fixed node density 0.016/m2, under several values of search angle and detection probability using the two forwarding protocols. With high search angle or high Pdet, insignificant decrease in energy efficiency with packet length is observed (curve i and ii). It is due to the lesser energy consumption for communication as compared with the energy consumption in case of higher hop length associated with lower Pdet and lower search angle (curve iii, iv).
Figure 12. Variation of energy efficiency with packet lengths for two different forwarding protocols.
Figure 13. Variation of average lifetime with node densities for different error control schemes under two forwarding protocols.
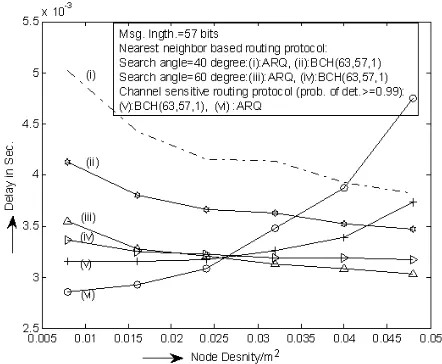
Fig.14 compares the variation of average route delay with node densities under two different forwarding protocols. Cases based on infinite ARQ of 57 bit packet and a BCH (63,57,1) coded packet based HARQ-I are considered for both the forwarding protocols. In case of channel aware protocol withPdet≥0.99, ARQ outperforms the other scheme at low node density, i.e. low interference region. However at high node density region, BCH coding shows better performance. It is seen that using nearest neighbor based forwarding protocol with search angles 40 degree, where average hop distance is high, BCH coding outperforms ARQ scheme over all node densities. Further, with increase in search angle (θ) as well as node density, average route BER improves under nearest node based routing. In this condition, incorporation of HARQ-I at sink may lead to increase in delay due to transmission of extra overhead (curve iii and iv).
Figure 14. Variation of average delay for successful transmission of a packet with node densities for different error control schemes under two forwarding protocols.
6. Conclusions
In this paper, using a semi-analytical model, the end-to-end performance in terms of average Route BER, average node lifetime, delay in successful reception of packetized data from source to sink via multi hop is estimated using a new channel aware forwarding protocol, where selection of intermediate relay nodes for multi hop operation is based on the probability of detection combined with maximum advanced distance with respect to the destination. The performance is compared with the nearest neighbor based forwarding protocol, where intermediate relay nodes is selected as the nearest node within a sector of angle (θ ) towards the direction of destination. Variation of energy consumption/node and node/network lifetime with node density is lower in case of channel aware protocol than nearest neighbor based protocol. Packet throughput, energy efficiency, and resource utilization metric are also compared for the two protocols. Optimum packet length which yields best packet throughput, energy efficiency, and resource utilization are indicated under two protocols. Best packet throughput is obtained with lower link distance. Best resource utilization within a range of packet length is observed with nearest neighbor based protocol with high search angle and channel aware based protocol with high probability of detection, i.e. with lower link distance. Considering start up energy, high energy efficiency is observed at low packet length region, where packet error rate is minimum, which results decrease in average number of retransmissions followed by lower average energy consumption for successful transmission of packet. Incorporation of HARQ-I between source and sink provide better performance in terms of increased lifetime and minimum delay in successful transmission of packetized data. Performance using nearest neighbor based protocol with low search angle, e.g. 200, degrades significantly. This study will be useful in selecting efficient forwarding protocol, which is an important step in designing energy efficient along with delay critical CDMA WSN.
References
[1] Akkaya K., and Younis M., “A Survey on Routing Protocols for Wireless Sensor Networks”, Journal on Ad Hoc Networks, Elsevier publication, vol.3, issue 3, May 2005, pp.325-349.
[2] Panichpapiboon, S., Ferrari, G., Tonguz, O.K., “Optimal Transmit Power in Wireless Sensor Network”, IEEE Transactions on Mobile Computing, Vol.5, No. 10, October 2006, pp.-1432-1447.
[4] L. Zhang and Y. Zhang, “Energy-Efficient Cross-Layer Protocol of Channel-Aware Geographic-Informed Forwarding in Wireless Sensor Networks,” IEEE Transactions On Vehicular Technology, vol. 58, no. 6, July 2009, pp. 3040-3052.
[5] Panigrahi B., De S., Panda B.S., and Lan Sun Luk J.D., “Energy-Efficient Greedy Forwarding Protocol for Wireless Sensor Networks”, Proceedings of IEEE Vehicular Technology Conference(vtc 2010- spring), pp.1-5.
[6] Tsai Yuh-Ren, “Sensing Coverage for Randomly Distributed Wireless Sensor Networks in Shadowed Environments”, IEEE Transactions on Vehicular Technology, January 2008, Vol.57, No.1, pp.556-564
[7] Hyunduk Kang, Heonjin Hong, Seokjin Sung, and Kiseon Kim, “Interference and Sink Capacity of Wireless CDMA Sensor Networks with Layered Architecture”, ETRI Journal, Volume 30, Number 1, February 2008, pp.13-20.
[8] De, S., QIAO, C.,. Pados, D. A., Chatterjee, M. and Philip, S. J.,“An Integrated Cross-layer Study of Wireless CDMA Sensor Networks,” IEEE Journal on Selected Areas in Communications, September, Vol.22, No.7, pp. 1271-1285. [9] Muqattash, A. and Krunz , M., " CDMA based MAC
protocol for wireless ad hoc networks", Proceedings of ACM MobiHoc, June, Annapolis, MD, USA, Vol 1, pp 153-164. [10] Datta, U., Sahu, P. K., Kundu, C. and Kundu, S., “Energy
Level Performance of Multihop Wireless Sensor Networks with Correlated Interferers,” Proceedings of the Fifth IEEE International Conference on Industrial and Information Systems (ICIIS-2010), July 29- August 01, 2010, Mangalore, India, pp 35-40.
[11] Zhen, T., Dongfemg, Y. and Quanquan, L.(2008) “Energy Efficiency Analysis of Error Control Schemes in Wireless Sensor networks”, Proceedings in the International Wireless Communication and Mobile Computing Conference, WCMC-2008, pp.401-405.
[12] Mehmet C. Varun, Ian F. Akyiliz, (2009) “ Error Control in Wireless Sensor Networks: A Cross Layer Analysis”, IEEE/
ACM Transactions on Networking, Vol.17, No. 4, August 2009, pp.1186-1199.
[13] Mehmet C. Vuran, Ian F. Akyildiz, “ Cross-layer Packet Size Optimization for Wireless Terrestrial, Underwater, and Underground Sensor Networks”, Proceedings of IEEE INFOCOM 2008, PP.780-788.
[14] Tonguz, O. K. and Ferrari, G. “Adhoc Wireless Networks”, A Communication – Theoretic Perspective, Wiley publication, John Wiley and sons, 2004, England.
[15] Datta, U.and Kundu, S., “Packet Size Optimization for Multi HopCDMA Wireless Sensor Networks with Nearest Neighbors Based Routing”, Proceedings of the Third International Conference on Emerging Applications of Information Technology (EAIT 2012), Nov. 29-Dec. 01, 2012, at Indian Statistical Institute, Kolkata.
[16] Jerez, R., Ruiz-Garcia, M. and Diaz-Estrella, A. (2000) “Effects of Mutipath Fading on BER Statistics in Cellular CDMA Networks with Fast Power Control”, IEEE Communications Letters, November, Vol.4, No.11, pg.-349-35.
[17] Kleinschmidt, J. H., Borelli, W. C. and Pellenz, M. E. (2007) “An Analytical Model for Energy Efficiency of Error
Control Schemes in Sensor Networks” IEEE
Communications Society, ICC 2007 proceedings, pp.3895-3900. Sakhir, M., Ahmed, I., Peng, M. and Wang, W. (2008) “Power Optimal Connectivity and Capacity in Wireless [18] Sensor Network”, 2008 International Conference on
Computer Science and Software Engineering, pp.967-970. [19] “ASH Transceiver Designer’s Guide” RFM-TR1000
Transceiver, November 2001.
[20] “ATMEL Transceiver Designer’s Guide” AT86RF212 Transceiver.
![Figure 1. Scenario of a source node and the potential relay nodes in Channel Aware Geographic Informed Forwarding (CAGIF) protocol [4]](https://thumb-us.123doks.com/thumbv2/123dok_us/8490243.1716327/2.595.84.271.421.522/figure-scenario-potential-channel-geographic-informed-forwarding-protocol.webp)