http://www.sciencepublishinggroup.com/j/jccee doi: 10.11648/j.jccee.20170202.11
Developing a Risk Assessment Model Based on Time Value
of Money and Cost-Benefit Ratio in Construction Projects
Roghaye Mousazade
1, Abbas Mahmoudabadi
21
Department of Civil Engineering, Faculty of Engineering, South Tehran Branch, Islamic Azad University, Tehran, Iran
2
Department of Industrial Engineering, Mehr Astan University, Guilan, Iran
Email address:
[email protected] (R. Mousazade), [email protected] (A. Mahmoudabadi)
To cite this article:
Roghaye Mousazade, Abbas Mahmoudabadi. Developing a Risk Assessment Model Based on Time Value of Money and Cost-Benefit Ratio in Construction Projects. Journal of Civil, Construction and Environmental Engineering. Vol. 2, No. 2, 2017, pp. 34-43.
doi: 10.11648/j.jccee.20170202.11
Received: January 24, 2017; Accepted: February 20, 2017; Published: March 22, 2017
Abstract:
In the present paper, a cost-risk and income-risk evaluation model has been developed in order to evaluate therisks of cost and incomes those may happen in construction projects. Since, it is important to determine risk factors for different activities and stages of various projects; the main aim is to propose an evaluation model for estimating the present value of risks corresponding to costs and incomes of the construction projects. The estimating procedure which has been proposed in this research work is that a project is broken into stages and related activities and the present value of cost and income risks as well as the value of different risk groups are calculated and compared to three pre-defined risk categories. Utilizing the proposed procedure using experimental data gathering for a under construction primary school building shows that the proposed model can help decision makers to determine and assess the risks of cost and incomes over the project activities. In addition, using the proposed procedure helps them to talk about how to deal with those risks to be reduced, accepted or transferred to other project components.
Keywords:
Time, Cost, Risk, Time Value of Money, Cost-Benefit Analysis1. Introduction
Risk is used in many different ways, phrases and words, such as Hazard and Uncertainty. There is perhaps no consistent use of this word but risk can be defined in many fields mainly safety, social activities, business, investment, military, political and etc. Every activity may be characterized by the presence of risk where the riskier activity may happen costlier the consequences if wrong decision has been made [1].
Since, the problem of time and cost overrun are known as common issues in developed and developing countries [2] and construction projects are complex in nature and have many inherent uncertainties, construction projects are considered to have a high level of risk due to numerous stakeholders, long constructing duration and open production system [3]. These uncertainties are not only from the unique nature of the project but also come from the diversity of resources and activities. In addition, external factors have very significant effects on the outcome of a project. Broadly,
these risks can affect on the two basic factors against which the success of a project is usually measured as the schedule time tabling of project and required budget [4]. They usually have extensive durations with varying uncertainties and complex relationships among the participants. Because, the effects of cost and schedule overruns not only influence on the construction industry but on the overall economy as well [5], identifying and analyzing potential risks that could occur on a project as early as possible can enhance successful completion of the project [3].
analysis is the main component of risk management that enables professionals to quantify and analyze risks those may pose potential threats to project performance in terms of cost, quality, safety, and time [7]. Risk management is an operational process comprising definition of sources of uncertainty (risk identification), estimation of the consequences of uncertain events/conditions (risk analysis), generation of response strategies in the light of expected outcomes and, finally, based on the feedback received on actual outcomes and risks, carrying out identification, analysis and response generation steps repetitively throughout the life cycle of an project to ensure that the project objectives are met [8].
Despite its importance to the success of project management, risk management is rarely approached with the same rigor as other project management processes such as scope and scheduling. The process of risk management includes risk identification, risk assessment and risk mitigation in which the risk identification and assessment are the critical procedures for successful projects. Many construction project risk assessment techniques are currently used in construction industry but insufficient attention has been paid by researchers to select a suitable risk assessment model [9].
A deterministic approach to project management in which there are preset parameters of time and cost and decisions are taken based on the independent analysis of time and cost, there is a low likelihood to be successful even if they are interrelated. Therefore, construction projects are typically confronted with delay and additional cost, which reduce the income of company can lead to its bankruptcy. Therefore, a more efficient approach should be taken into account the risk events, uncertainties and resources limitation parameters [10]. Change in project cost or cost growth occur from many factors. Some of these factors are related to each other, and all are associated with some sources of risk. Determining the existence and influence of cost overrun risk factor in construction projects can ultimately lead to better control on project cost estimation and assist in identifying possible solution for avoiding future estimate overrun [11].
Nowadays, production and delivery time, price, risk and quality are considered as the most important competitive advantages in industries. Hence, in the recent years, examining the relationship between competitive advantages in the leading industries and industrialized countries are still under discussion. A large number of companies annually spend large funding on research and development about the most optimum combination of production or the most optimum function and feature of their products and services [12].
In project management, sophisticated monitoring techniques and analytical models are employed for earned value management, utilizing optimization tools and decision support systems, but they are not used for the continuous risk monitoring system. Although some of employed risk management methods focus on advanced mathematical tools, but they leave out either the ownership approach from the
criteria, or the applicability of continuous usage [13]. In other words, a systematic and continuous approach should be utilized to assess and manage risks over the project. It is believed that providing the mathematical context of time-varying application of risk monitoring process will help further clarify the concept of business project risks [13].
Following the above mentioned, a formalized and integrated risk management model based on a value-based risk management approach, that includes the concept of owner’s value and mathematical background of the phenomenon of time-varying risks is necessary to be developed. Based on the vision of existing an algorithm to facilitate continuous risk monitoring, the model should also be able to describe the rather pragmatic phenomenon of the decrease of risk as time passes while the applicability of the process is maintained.
Since, the time value of money is one of the fundamental concepts in engineering economics, reviewing the literature and relevant researches shows that less attention has been paid to the concept of money time value for risk assessment on construction projects regarding to different stages of projects including establishment and incoming stages. So in this paper, a model of cost risk assessment has been developed regarding to considering time value of money for establishment costs and incoming stages of project. The above mentioned view is the main difference between the proposed procedure developed in this paper and the other studies. The present research work is organized into five sections. After introduction, a clear discussion on the proposed procedure is made consisting of the present value of risk and risk assessment followed by proposing a mathematical model on calculating the rate of cost-benefit ratio utilizing the risk assessment and risk group evaluation. The next section discusses more about the specification of case study selected for evaluating the proposed procedure. The content of the last section is organized to briefly discuss what has been done and some notes which have been concluded over the research work.
2. Proposing Procedure
The proposed procedure consists of two main parts of defining and calculating the present value of cost and income risks of the project as well as the benefit-cost ratio, which are described as follow.
2.1. Defining Risk Factors for Cost and Income
activity is obtained by cash-flow equation and finally present value of stage cost risk is the sum of present value of related activities cost risk. All the above notes can be described as below steps:
1. Selecting the construction project.
2. Breaking the project into construction stages based on project properties and activities. It should be defined in term of time means that stages may be defined as annual, seasonal or monthly.
3. Determining activities and their related costs for each stage of the project construction time.
4. Determining risk factors which may lead to cost overrun.
5. Determining the probability of occurrence and severity of impact for each risk factor.
6. Calculating the effect of each risk factor on activity cost by the product of ( × ×
).
7. Calculating the total cost risk for all risk factors on activity as the sum of cost risk (∑ ( ×
× )) .
8. Converting the value of activity cost risk to present value of cost risk using cash flow equations.
9. Calculating the present value of stage cost risk as the sum of cost risks for its related activities.
2.2. Calculating Risk Factors for Cost and Income
In order to determine the present value of construction and operation income risk (risk relevant to income), based on the
staging process discussed in the previous step, the incomes of any stage and income risk factors are determined through filling out a designed questionnaire. To determine the impact of risky factors on the project, income risk is calculated for each factor related to each stage followed by calculating a cumulative income risk for each stage. The present value of incomes risk for each stage is obtained by cash-flow equation. All the above notes can be described as the below steps:
1. Selecting the construction project.
2. Breaking the project into construction stages based on project properties and activities but should be defined in term of time and stages which may be defined as annual, seasonal or monthly.
3. Determining the related income for each stage of the project.
4. Determining risk factors which may lead to income reduction.
5. Determining the probability of occurrence and severity of impact for each risk factor.
6. Calculating the effect of each factor on stage incomes by product of ( × ×
).
7. Calculating the total income risk for all risk factors on a stage as the sum of income risks (∑ ( ×
× )) .
8. Converting the value of stage income risk to present value of income risk using cash flow equations.
Table 1. List of indices, parameters and variables defined for developing the procedure.
Index Parameter Description
I Activity index
J Stage index
m The number of activities in each stage
n The number of project stages
o The number of risk factors for each activity
r Cost risk index
ρ Income risk index
Cij The cost of activity (i) in stage (j)
Bj The income of construction stage (j)
Bt The annual uniform income during operation cycle
Pr
ij The probability of risk (r) related to activity (i) in stage (j)
Sr
ij The severity of risk (r) related to activity (i) in stage (j)
Sρ
j The severity of risk (ρ) related to stage (j)
Pρ
j The probability of risk (ρ) related to stage (j)
Sρ
t The severity of risk (ρ) related to operation cycle (t)
Pρ
t The probability of risk (ρ) related to operation cycle (t)
Cr
ij The cost risk (r) related to activity (i) in stage (j)
Cρ
j The income risk (ρ) related to construction stage (j)
Cρ
t The income risk (ρ) of each operation year
Fij The total value of cost risks related to activity (i) in stage (j)
Pij The present value of cost risks related to activity (i) in stage (j)
Pj The present value of cost risks may happen in stage (j)
Fb
j The total value of income risks related to stage (j)
Pb
j The present value of income risks may happen in stage (j)
At Total income risk of each operation (incoming) year
Pb The present value of total construction income risks
Pb
t The present value of operation income risks
Pb
T Present value of income risks for construction and operation time of project
Figure 1. Procedure leads to determining the present value of stage cost risk.
Figure 2. Procedure leads to determining the present value of stage income risk.
Figures 1 and 2 show all steps defined in the proposed procedure. Parameters and their definition are also summarized in Table 1.
3. Formulating the Proposed Procedure
Formulas and calculations used in the proposed method are presented in detail as below:
a) After dividing the project into (j) stages and determining the (i) an activity of each stage, the cost of activity (i) is defined by Cij in stage (j). Following that risk
factor (r) is defined for each activity in step (4), and the probability of risk (r) related to activity (i) in stage (j) is defined as Prij. The severity of risk (r) related to activity (i) in
stage (j) is also defined by symbol Srij discussed in step (5).
The cost risk (r) corresponding to each activity (i) in stage (j), Crij, is calculated by equation (1) in step (6). Afterward,
in step (7), the total value of cost risks related to activity (i) in stage (j), Fij, is calculated by equation (2). The present
value of cost risks assigned to activity (i) in stage (j) defined as Pij, calculated by equation (4) in step (8). At the final step
(9), the present value of cost risks in stage (j) shown as Pj, is
calculated by equation (5).
The cost risk is used for determining the effect of each risk
factor related to the activity. For this purpose, the activity cost is affected by risk severity and probability, so for each activity the value of cost risk per each factor is calculated by equation (1) where is cost of risk (r) for activity (i) at stage (j), is the severity of risk factor (r), is the probability of risk factor (r) andC is the cost of activity (i) at stage (j).
× !× C (1)
To determine the total effect of cost risk for each activity, total value of cost risks is calculated by equation (2), where
F is the total cost risk of activity (i) at stage (j) and C is the cost risk of activity (i) at stage (j) affected by factor (r).
# ∑, C $ 1, … , ( )& $+ 1, … , ( )& $
-.
1, … , ( ) (2)
In order to convert the value from their real-time occurrence to the beginning time of the project, the cash flow formula is used where P is present value, F is future value,
P F
0 is present-future worth ratio and ir% is interest rate.
# # ⁄#, % , + (3)
By replacing the value of stage cost risks (Fij) in cash flow
calculated by equation (4).
# × # ( ⁄#, % , +) (4) The present value of cost risks for each stage is the sum of the present value of the activities of that stage and defined by equation (5). A sequence of using the above parameters is tabulated in Table 2.
∑3
-. ∀+ 1, … , ∈ ) (5)
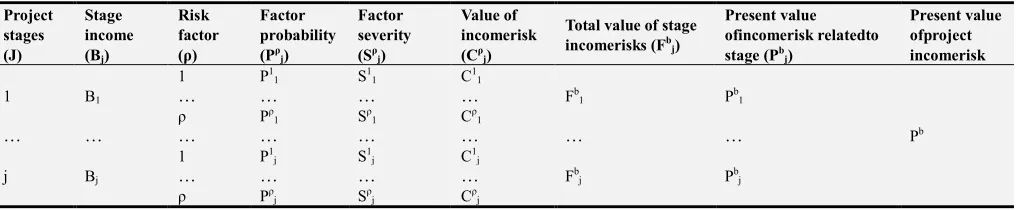
b) After dividing the project into (j) stages, the income of
stage (j) is defined by Bj. Following that (ρ) risk factors is
defined for each stage in step (4). The probability of risk (ρ) related to stage (j) is defined as Pρj and the severity of risk (ρ)
related to stage (j), is also defined by symbol Sρj in step (5).
The income risk (ρ) corresponding to each stage (j), Cρj, is
calculated by equation (6) in step (6). Afterward, in step (7), the total value of income risks related to stage (j), Fbj, is
calculated by equation (7). At the final step the present value of income risks assigned to stage (j) defined as Pbj, calculated
by equation (9) in step (8).
Table 2. Determine the present value of project cost risk.
Project stages (J)
Stage activities (I)
Activity cost (Cij)
risk factor (r)
Factor probability (Prij)
Factor severity (Srij)
value of cost risk (Crij)
Total value of activity cost risks (Fij)
present value of activity cost risks (Pij)
Present Value ofCost Risk relatedto Stage (Pj)
1
1 C11
1 P1
11 S111 C111
F11 P11
P1
… … … …
r Pr11 Sr11 Cr11
… … … … … …
i Ci1
1 P1
i1 S1i1 C1i1
Fi1 Pi1
… … … …
r Pr
i1 Sri1 Cri1
… … … … … … … …
j
1 C1j
1 P11j S11j C11j
F1j P1j
Pj
… … … …
r Pr
1j Sr1j Cr1j
… … … … … …
i Cij
1 P1
ij S1ij C1ij
Fij Pij
… … … …
r Prij Srij Crij
The income risk is used to determine the effect of each risk factor related to the stage. For this purpose, the stage income is affected by risk severity and probability, so for each stage the value of income risk per each factor is calculated by equation (6) where 4 is income risk (ρ) for stage (j), 4is severity of risk factor (ρ), P4 is the probability of risk factor (ρ) and B is income of stage (j).
4 4
× 6× B (6)
To determine the total effect of income risks for each stage, total value of income risks is calculated by equation (7), where F7 is total income risk of stage (j).
#8= ∑, C4 ∀+ = 1, … , ∈ )& ∀9 = 1, … , ∈ )
4-. (7)
In order to convert the value from their real-time occurrence to the beginning time of the project, the cash flow formula is used where P is present value, F is future value,
P0F is present-future worth ratio, ir% is interest rate.
= # × # ( #, % , +)⁄ (8) By replacing the value of stage income risk (Fbj) in cash
flow formula, the present value of income risks (Pbj) for each
stage is calculated by equation (9).
8 = #8 ( #, % , +) ⁄ (9)
The present value of income risks for construction time of
project is the sum of present values of all stages of the project as calculated by equation (10). A sequence of using the above parameters and equations is tabulated in Table 3.
8 = ∑3 8
-. (10)
The annual uniform income of operation cycle is defined by Bt. Following that, (ρ) risk factors is defined for this cycle on each year in step (4), and the probability of risk (ρ) related to operation cycle is defined as Ptρ. The severity of risk (ρ)
related to cycle (t), is also defined by symbol Stρ in step (5).
The incomes risk (ρ) corresponding to cycle (t), Cρt is
calculated by equation (11) in step (6). Afterward, in step (7), the total value of income risks related to one year, At is
calculated by equation (12). At the final step the present value of income risks assigned to cycle (t) defined as Pbt,
calculated by equation (14) in step (8).
For operation cycle the value of income risk per each factor is calculated by equation (11) where C:ρ is income of risk (ρ) for 1 year, S:ρis severity of risk factor (ρ),P:ρis the probability of risk factor (ρ) and Bt is annual income.
P0F is present-future worth ratio and ir% is interest rate. By replacing the value of one year income risks (At) in cash flow
formula, the present value of operation income risks (Pbt) for
operation cycle is calculated by equation (14). The present value of income risks for construction and operation time of project is defined by equation (15). A sequence of using the above parameters is tabulated in Table 4.
=>= ∑?4-.C:6 (12)
= # ( #, % , +)⁄ & = = ( =, % , +)⁄ (13)
>8 = => ( =, % , )⁄ ( #, % , )⁄ (14)
@8= >8+ 8 (15)
Table 3. Determining the present value of construction income risk. Project stages (J) Stage income (Bj) Risk factor (ρ) Factor probability (Pρj) Factor severity (Sρj) Value of incomerisk (Cρj) Total value of stage incomerisks (Fbj) Present value ofincomerisk relatedto stage (Pbj) Present value ofproject incomerisk 1 B1 1 P1 1 S11 C11 Fb 1 Pb1 Pb … … … … ρ Pρ 1 Sρ1 Cρ1 … … … … … … j Bj 1 P1 j S1j C1j Fb j Pbj … … … … ρ Pρ j Sρj Cρj Table 4. Determine the present value of operation income risk. Operation cycle Uniform operational income risk factor (ρ) Factor probability (Ptρ) Factor severity (Stρ) value of income risk (Cρt) Total value of one stage income risks (A1) Present value of cost risk related to stage (Pbt) t Bt 1 P1 t S1t C1t At Pbt … … … … ρ Pρ t Sρt Cρt
4. Risk Group Evaluation
In order to have an evaluation between different risk categories, risks of construction projects that may be encountered in implementation process divided into three groups of cost risks, national-regional risks and technical ones. Two parameters of the weight (importance) and magnitude (score) of risks are also defined to rate the above risks. For technical and national-regional risks, parameters are independent of time like as the weight of cost risks but the magnitude of cost risk is considered to be variable for different stages. The mentioned amount could be extracted through questionnaires filled out by experts shown in Table 5. The values for technical and national-regional risks are usually fuzzy numbers, but the magnitudes of cost risk are in strict format, so it is necessary to normalize the values for cost risk into closed interval [1-5]. Table 5. Categoriesof risk parameters. Project Stage Risk Categories Cost Risks Technical Risks National-Regional Risks Weight [0-1] Magnitude [0-5] Weight [0-1] Magnitude [1-5] Weight [0-1] Magnitude [1-5] 1 WC MC1 WT MT WN MN 2 MC2 … … j MCj Using the process the cost risk value converts the values to fuzzy forms and the following formulation [equation (16)] is applied: MCD = (EDFEDGHI) (EDGJKFEDGHI)× (5 − 1) + 1 (16)NOP: The fuzzy presenet value (magnitude)for cost risk over the interval h1 − 5i. klm: The lowest amount of present value of stage cost risks over the project time. kpq: The maximum amount of present value of stage cost risks over the project time. The sum of risks related to cost for project (MC) into the interval [1-5], is obtained by equation (17). NC=s∑ tuD I Dvw x y (17)
And in continue, z@ = (N@× {@) (18) Where, VT, is the value of project technical risks; MT, is the
magnitude of project technical risks and WT, is the weight of
z|= (N|× {|) (19) Where, VN, is the value of project national-regional risks;
MN, is the magnitude of project national-regional risks and
WN, is the weight of project national-regional risks.
zO = (NO× WC) (20)
Where, VC, is the value of project cost risks; MC, is the
magnitude of project cost risks, WC, is the weight of project
cost risks. So the total value of project risk is the sum of technical and national-regional risks with the cost risks considering the time value of money as equation (21).
z = ∑~-@,|,Oz~ (21)
Following the above mentioned the rank for each category is determined as equations (22) to (24):
•@€=••€‚× (5 − 1) + 1 (22)
•@ƒ=
•ƒ
•‚× (5 − 1) + 1 (23) •@„=••„‚× (5 − 1) + 1 (24)
Using the rank of risk groups, the importance of the threats posed by the different risk groups can be determined. In this stage decisions about the project cost risk can be made and finally policy makers can talk about how to deal with these risks to reduce, accept or transfer them to others and reduce project cost risks and consequently reduce the project cost.
5. Cost-Benefit Risk Ratio
To compare the income risk of the project to the cost risk, the ratio of income risk to cost risk is calculated. One of the important steps in this calculation is to compare the present
value of these two values. The present value of project cost risk is the sum of the present value of all stages of the project cost risk and is determined by equation (25), while the cost-income risk ratio is determined by equation (26).
… = ∑y 8
-. (25) †‡y‡ˆ > ! ‰~
O,‰> ! ‰~ = Š„‹
ŠŒ (26)
6. Case Study
In order to investigate the effect of the time value of money on the cost risk assessment and ranking risk groups, a case study is carried out by nine experts who are working in the construction management field by utilizing the expert questionnaire shown in appendices A to C. During the case study sessions, the questionnaire is used as a supporting system during the processes of risk identification and assessment. The case study is carried out by using the data of a real construction project of a school construction project in Tehran province, Iran. The case study is composed of three sequential steps. First, the cost and income data, as well as timing of the project were collected. Second, filled out questionnaires provide a cost and income risk factors which may occur in pre-selected construction project. It is required from experts to rank the sub-risks in terms of probability and impacts based on the given data utilizing an interval [1-5] interval Likert scale for risk severity. The set of ten experts and practitioners had been asked to complete them based on their experiences. Results of questionnaires are tabulated in table 6. Using the previously mentioned formula and fuzzy present magnitude of cost risk is calculated and shown in table 7. The other experts were asked to fill out another questionnaire designed for gathering experts’ opinions on the amount and weight of the determined risk groups.
Table 6. The result of cost and income risk questionnaires (Average of expert's opinions in Likert scale).
Cost Risk Factor No. Risk Parameters Mean Income Risk Factor No. Risk Parameters Mean
1 Risk Severity 4.2 1 Risk Severity 4
Risk Probability 0.6 Risk Probability 0.7
2 Risk Severity 3.4 2 Risk Severity 3.2
Risk Probability 0.7 Risk Probability 0.6
3 Risk Severity 3.7 3 Risk Severity 4.1
Risk Probability 0.5 Risk Probability 0.4
4 Risk Severity 4.2 4 Risk Severity 3.9
Risk Probability 0.6 Risk Probability 0.4
5 Risk Severity 2.9 5 Risk Severity 3.6
Risk Probability 0.4 Risk Probability 0.4
6 Risk Severity 3.7 6 Risk Severity 2.7
Risk Probability 0.4 Risk Probability 0.4
7 Risk Severity 3.7 7 Risk Severity 3.2
Risk Probability 0.7 Risk Probability 0.3
8 Risk Severity 3.1 8 Risk Severity 3.8
Risk Probability 0.5 Risk Probability 0.7
9 Risk Severity 3.4 9 Risk Severity 2.9
Risk Probability 0.3 Risk Probability 0.3
10 Risk Severity 2.8
Table 7. Fuzzy present value of magnitude for cost risk.
MC1 MC2 MC3 MC4 MC5 MC6 MC Mean
1 3 5 2.9 2.9 4 3.1
Table 8. The result of the questionnaires risk categories.
Risk categories Magnitude Weight Rate (Likert scale)
Cost Risks 3.1 (Extracted
from table 7) 0.7 3.1
National-Regional Risks 2.9 0.4 2.1
Technical Risks 2.9 0.3 1.8
They helped to make a prioritization of risk groups in accordance with the above process, results are presented in table 8. The project construction period is short and there is no special income in this cycle, so the income risk calculation for this period was omitted and just the present value of income risk for operational cycle of 30 years was calculated. Finally by division of present value of income risk to present value of cost risk (obtained by specified method), the cost-income risk ratio has been obtained equal to 1.9.
7. Summary and Conclusion
This study has been carried out to present a cost risk assessment model considering the time value of money in the calculation of cost and income based risks of construction projects as the special feature of the proposed model. For this purpose, the project was broken down into specific time steps, related activities and risk factors with their parameters. Present value of activities and stages cost risks have been calculated by extended formulations in terms of the concepts of engineering economy and probability. Based on the data derived from the questionnaires, the weight and value of the three risk categories are then defined for the project, to assess risk categories values. The values of risk categories were determined in the form of fuzzy numbers and eventually the ratings were determined for all risk groups.
Regarding to the time value of money in the cost and income risk calculations, the impact of variability in the value of money on these risks of project is considered, it
leads to better comparison between different risk categories. As shown in equation (27), the ratio of stage cost risk to stage implementation cost in the real-time occurrence is constant while the ratio of present value of stage cost risk to stage implementation cost is variable based on the formula (28). In earlier stages of construction, this ratio is greater than later stages, and closer to end of project construction it is reduced as shown in equation (29).
• (D)
C (D)=
• (DŽw)
C (DŽw)= Const. ∀j = 1, … n ∈ N (27)
E(D)
C(D)≠
E(DŽw)
C(DŽw) ∀j = 1, … n ∈ N (28)
E (D)
C (D)>
E (DŽw)
C (DŽw) ∀j = 1, … n ∈ N (29)
It's deduced that whatever risk factors occur during the initial times, the impacts on the project cost and incomes are more serious and critical consequently to reduce their negative effects, and they should be postponed to the end of the project as much as possible. The results of risk groups evaluation show that the cost risk group with score of 3.1 is located in first priority, while the national-regional and technical groups with a score of 2.1 and 1.8 are in the second and third priorities, respectively. These results confirm the importance of cost risk groups in comparison with two other risk groups. The questionnaires results revealed that the most important cost risk in school construction project are as follows: 1) the employer failed to pay on time and to the specified amount, 2) price fluctuations in various fields and 3) changes in exchange rates.
Prolongation of the project and employer failed to pay on time and to the specified amount are the most important income risk factors in this type of projects. The ratio of income risk to cost risk shows that incomes of the project compared to the cost of the project, are exposed to higher risk. It is known that interaction of different risk groups is inevitable, in this study to avoid more complex calculations, this issue is waived, and it is suggested for future study to consider this interaction to achieve more accurate results and consider more realistic concepts.
Appendices
Appendix A1. Sample of Factors Affecting Cost Overrun Questionnaire.
F in a n c ia l P a ra m e te r s R is k F a c to r N o . R is k F a c to r
Risk Severity Risk Probability
V e r y L o w (1 ) L o w (2 ) M o d e ra te ( 3 ) H ig h ( 4 ) V e r y H ig h (5 ) V e r y L o w (0 -0 .2 ) L o w (0 .2 -0 .4 ) M o d e ra te ( 0 .4 -0 .6 ) H ig h ( 0 .6 -0 .8 ) V e r y H ig h (0 .8 -1 ) Cost
1 price fluctuations in various fields
2 The employer failed to pay on time and to the specified amount
… … … …
Appendix A2. Sample of Factors Affecting Income Reduction Questionnaire. F in a n c ia l P a ra m e te rs R is k F a c to r N o . R is k F a c to r
Risk Severity Risk Probability
V e r y L o w (1 ) L o w (2 ) M o d e ra te ( 3 ) H ig h ( 4 ) V e r y H ig h (5 ) V e r y L o w (0 -0 .2 ) L o w (0 .2 -0 .4 ) M o d e ra te ( 0 .4 -0 .6 ) H ig h ( 0 .6 -0 .8 ) V e r y H ig h (0 .8 -1 ) Income
1 price fluctuations in various fields
2 The employer failed to pay on time and to the specified amount
… … … …
9 Changes in exchange rates.
Appendix A3. Sample of Risk Group Prioritizing Questionnaire.
S ta g e N o . S ta g e Main Categories
Technical Risk National-Regional Risk Cost Risk
Magnitude Weight Magnitude Weight Weight Weight
V e r y L o w (1 ) L o w (2 ) M o d e ra te ( 3 ) H ig h ( 4 ) V e r y H ig h (5 ) V e r y L o w (0 -0 .2 ) L o w (0 .2 -0 .4 ) M o d e ra te ( 0 .4 -0 .6 ) H ig h ( 0 .6 -0 .8 ) V e r y H ig h (0 .8 -1 ) V e r y L o w (1 ) L o w (2 ) M o d e ra te ( 3 ) H ig h ( 4 ) V e r y H ig h (5 ) V e r y L o w (0 -0 .2 ) L o w (0 .2 -0 .4 ) M o d e ra te ( 0 .4 -0 .6 ) H ig h ( 0 .6 -0 .8 ) V e r y H ig h (0 .8 -1 ) V e r y L o w (0 -0 .2 ) L o w (0 .2 -0 .4 ) M o d e ra te ( 0 .4 -0 .6 ) H ig h ( 0 .6 -0 .8 ) V e r y H ig h (0 .8 -1 ) V e r y L o w (0 -0 .2 ) L o w (0 .2 -0 .4 ) M o d e ra te ( 0 .4 -0 .6 ) H ig h ( 0 .6 -0 .8 ) V e r y H ig h (0 .8 -1 )
1 Equipping the ingot workshop
2 Foundation
References
[1] Jannadi, O. A., Almishari, S., Risk Assessment in Construction, 10.1061/(ASCE)0733-9364, 129: 5 (492), 2003. [2] Memon, A. H., Rahman, I. A, Zainun, N. Y., Abd Karim, A. T., Web-based Risk Assessment Technique for Time and Cost Overrun (WRATTCO) – A Framework, Procedia - Social and Behavioral Sciences 129 (2014) 178–185, ICIMTR 2013. [3] Taroun, A. Towards a better modeling and assessment of
construction risk: Insights from a literature review, International Journal of Project Management 32, Pages 101– 115, 2014.
[4] Nasir, D., McCabe, MC., Hartono, L., Evaluating Risk in Construction–Schedule Model ERIC–S: Construction Schedule Risk Model, 10.1061/(ASCE)0733-9364 (2003) 129: 5 (518), 2003.
[5] El-Karim, M. S. B., El Nawawy, O. A. M., Abdel-Alim, A. M., Identification and assessment of risk factors affecting construction projects, HBRC Journal, 2015.
[6] Dziadosza, A., Tomczykb, A., Kaplińskic, O., Financial risk estimation in construction contracts, Operational Research in Sustainable Development and Civil Engineering - EURO
working group meeting and 15th German-Lithuanian-Polish colloquium (ORSDCE 2015), 2015.
[7] Choudhry, R. M., Aslam, M. A., Hinze, J. W., Arain, F. M., Cost and Schedule Risk Analysis of Bridge Construction in Pakistan: Establishing Risk Guidelines, DOI: 10.1061/(ASCE)CO.1943-7862.0000857, American Society of Civil Engineers, 2014.
[8] Tamosaitiene, J., Zavadskas, E. K., Turskis, Z., Multi-criteria risk assessment of a construction project, Procedia Computer Science 17 (2013) 129–133.
[9] Karimi Azari, A. R., Mousavi, N., Mousavi, S. F., Hosseini,, S. B., Risk assessment model selection in construction industry, Expert Systems with Applications 38, Pages 9105–9111, 2011. [10] Purnus, A., Bodea, C. N., Correlation between time and cost
in quantitative risk analysis of construction projects, Creative Construction Conference, CC2014, 2014.
[11] Fouzi A. H., Project cost risk assessment: an application of project risk.
[12] Rezaian, A, Time Cost Quality Risk Of Construction And Development Projects Or Investment”, Middle-East Journal of Scientific Research 10 (2), Pages 218-223, 2011.
Biography
Abbas Mahmoudabadi, corresponding author is director in Master Program in Industrial Engineering at Mehr Astan University, Guilan, Iran. He received his Ph.D. degree in 2014 in Hazmat transportation and received Thesis Dissertation Award from IEOM society in 2015, Dubai, UAE. He has published 65 journal or international conference papers published in the field of industrial engineering, transportation and traffic safety. He teaches transport and industrial engineering courses and has 25 years of executive experiences on traffic and road safety planning in developing countries. He has also strong cooperation with national and international agencies on traffic safety and industrial engineering.