INTRODUCTION
Progressive multifocal leukoencephalopathy (PML) is a rare, often fatal, opportunistic infection, associated with demyelinating process. PML is caused by John Cunningham (JC) polyomavirus, and predominantly affects patients with human immunodeficiency virus (HIV) infection or immuno-compromised patients with impaired cell-mediated immunity, such as transplant recipients, patients on monoclonal anti-body therapy, or patients with various oncologic and hemato-logic disorders. These patients usually present with advanced immunosuppression at the time of diagnostic evaluation,
and are commonly late for the treatment to be effective [1]. PML is associated with high morbidity and mortality. The classical neuroimaging pattern shows the presence of diffuse, often multifocal white matter lesion, involving subcortical U-fibers, typically without associated contrast enhancement, mass effect, and vasogenic edema [2,3]. The histopathological examination reveals the presence of demyelination, macro-phage infiltration, bizarre astrocytes, and enlarged oligoden-drocyte nuclei [4,5]. Although the definite diagnosis of this disease is obtained by brain biopsy, non-invasive biomarkers of PML are helpful to eliminate the need for the aforemen-tioned invasive procedure, especially considering the fact that brain biopsy is non-diagnostic in 4-36% of patients with HIV infection [6,7]. The Neuroinfectious Disease Section of the American Association of Neurology, has recently established the criteria for the diagnosis of PML. According to these cri-teria, the definitive diagnosis of PML requires the presence of
*Corresponding author: Mladen Bjelan, Diagnostic Imaging Center, Oncology Institute of Vojvodina, Put Dr. Goldmana 4, 21204 Sremska Kamenica, Novi Sad, Serbia. Phone: +381 21 4805604;
Fax: +381 21 4805602. E-mail: [email protected] Submitted: 05 April 2017/Accepted: 10 May 2017
A prominent lactate peak as a potential key magnetic
resonance spectroscopy (MRS) feature of progressive
multifocal leukoencephalopathy (PML): Spectrum
pattern observed in three patients
Duško Kozić1,2, Mladen Bjelan1,2*, Jasmina Boban1,2, Jelena Ostojić1, Vesna Turkulov1,3, Aleksandar Todorović1,2,
Slobodanka Lemajić-Komazec1,4, Snežana Brkić1,3
1Faculty of Medicine, University of Novi Sad, Novi Sad, Serbia, 2Diagnostic Imaging Center, Oncology Institute of Vojvodina, Sremska Kamenica, Novi Sad, Serbia, 3Clinic of Infectious Diseases, Clinical Center of Vojvodina, Novi Sad, Serbia, 4Clinic of Otorhinolaryngology, Clinical Center of Vojvodina, Novi Sad, Serbia
ABSTRACT
Progressive multifocal leukoencephalopathy (PML) is a rare, often fatal, opportunistic infection, associated with demyelinating process. PML is caused by John Cunningham (JC) polyomavirus, and predominantly affects patients with human immunodeficiency virus (HIV) infection or other immunocompromised patients. The purpose of this study was to determine the role of magnetic resonance spectroscopy (MRS) in establishing the diagnosis of PML. MRS with long and short echo time was performed in two patients with PML associated with HIV infection and in one PML patient associated with chronic lymphocytic leukemia. The most prominent peak on the obtained spectra was for lactate; it showed 2-3 times higher concentration of lactate compared to choline, almost 4-6 times higher lactate concentration compared to creatine, and 4-11 times higher lactate in comparison to N-acetylaspartate concentration. Similar spectrum pattern was observed in all patients. To the best of our knowledge, this is a new finding that might be useful in early diagnosis of PML. Nevertheless, further confirmation of our results is needed, since we analyzed the spectrum pattern only in three patients. Overall, our results could help in early detection of PML, especially in non-HIV patients, and thus prevent the fatal outcome of the disease. MRS could also be useful in detecting “tumefactive” demyelinating lesions in PML patients, associated with immune reconstitution inflammatory syndrome, to avoid misdiagnosis of neoplasm.
KEY WORDS: Progressive multifocal leukoencephalopathy; PML; magnetic resonance spectroscopy; MRS; lactic acid; JC virus; HIV
was to determine the role of magnetic resonance spectroscopy (MRS) in establishing the diagnosis of PML, since the early diagnosis could be crucial in preventing the fatal outcome. For instance, Pavlovic et al. [9] reported the regression of PML in a patient with lupus after early diagnosis and prompt discontin-uation of immunosuppressive medications [9].
MATERIALS AND METHODS
MRS was performed in two HIV-positive patients and one patient with chronic lymphocytic leukemia, who had extensive brain lesions, involving the white matter on con-ventional magnetic resonance imaging (MRI) examination. Clinical course and PCR of CSF were consistent with the diagnosis of PML. MR spectra were recorded on a 3T MRI scanner (Siemens Magnetom Trio, Erlangen, Germany), using single voxel MR spectroscopy with long and short echo time (TE), with 1H point resolved spectroscopy [PRESS] (svs_ se_135): Repetition time (TR) 2000 ms, TE 135 ms, voxel size 20×20×20 mm, 128 averages, flip angle (FA) 90°, and acqui-sition time 4:24 minutes, and STimulated Echo Acquiacqui-sition Mode (STEAM)-20 (svs_se_20): TR: 2000 ms, TE: 20 ms, voxel size 20×20×20 mm, 176 averages, FA 90° and acquisition time 6:00 minutes. A voxel was placed inside the lesion. The peaks of N-acetylaspartate (NAA), choline (Cho), creatine (Cr), lactate (Lac), and lipids (Lip) were documented, and the ratios were expressed using creatine as reference.
RESULTS
Patient 1
A 36-year-old HIV+ male presented with fever, headache, and gradual left hemiparesis. Computed tomography (CT) of the thorax revealed the presence of pneumonia.
MRI revealed a large zone of low signal intensity on T1-weighted (T1W) images and high signal intensity on the T2W and fluid-attenuated inversion recovery (FLAIR) images, which included right parietal and frontal white matter, extend-ing from the subcortical region to the right lateral ventricle, with involvement of the splenium of corpus callosum (Figure 1A-C). The lesion measured 6×5 cm in the axial plane. There was no contrast enhancement, gray matter involvement, or significant mass effect. MRS documented an increased Cho/Cr ratio
Patient 2
A 40-year-old HIV+ male presented with 3-week-long fever, rash, vertigo, and right hemiplegia. MRI showed a large, low-signal-intensity lesion on the T1W image, predominantly located in the subcortical area, and a high-signal-intensity lesion on the T2W and FLAIR images, predominantly located in the subcortical areas of the left parietal and frontal lobes, with sharp demarcation toward gray matter (Figure 3A-C). The axial dimensions of the lesion were approximately 6×4.5 cm. MRS documented an increased Cho/Cr ratio (2.29), decreased NAA (NAA/Cr was 0.82), and a high Lac peak (Lac/Cr was 2.30), which dominated in the obtained spec-tra both on the sequence with long (Figure 3D) and short TE (Figure 3E). The death occurred 43 days after hospitalization.
Patient 3
A 77-year-old male with chronic lymphocytic leukemia, treated with chemotherapy and immunosuppressive medica-tions (chlorambucil and pronison), presented with left hemi-paresis, horizontal nystagmus, and left-sided tongue deviation. MRI revealed the presence of a large, subcortical lesion located in the right frontal and parietal lobes, T1W hypointense, T2W and FLAIR hyperintense, with a sharp border toward gray matter, measuring 10×3.5 cm in the axial plane (Figure 4A and B). MRS revealed an increased Cho/Cr ratio (1.84), decreased NAA (NAA/Cr ratio was 0.88), and an extremely high Lac peak (Lac/Cr ratio was up to 2.03), which dominated in the obtained spectra both on the sequence with long (Figure 4C) and short TE (Figure 4D). The death occurred 19 days after hospitalization.
DISCUSSION
especially important in non-HIV patients where, combined with appropriate therapy, it could lead to better healing. A recent report showed that PML was the first manifestation in a patient with a clinically occult sarcoidosis [13]. PML has also been described in an immunocompetent patient, in whom the administration of serotonin receptor targeted therapy improved the outcome [14]. This emphasizes the need for prompt diag-nosis and monitoring of the disease process. Patients with autoimmune disorders should be particularly monitored for the development of PML during immunosuppressive therapy.
Diffusion-weighted MRI (DW-MRI or DWI) can be used as an additional tool for monitoring the disease activity in patients with PML. Moreover, a report showed that DWI findings in PML patients are related to the disease stage [10]. Newer lesions and the advancing edges of large lesions showed nor-mal-to-low apparent diffusion coefficient (ADC) values and a high signal on DWI, compared to older lesions and the centers of the large lesions that had increased ADCs and a low signal on DWI. These findings might also help to differentiate PML from mimicking diseases [10].
FIGURE 1. Magnetic resonance spectroscopy (MRS) signal characteristics of progressive multifocal leukoencephalopathy. (A) A large
zone of low signal intensity on the axial T1-weighted (T1W) image and high signal intensity on (B) the coronal T2-weighted (T2W) and (C) axial fluid-attenuated inversion recovery images, in the right frontoparietal white matter. The involvement of the splenium of corpus callosum was also evident on the coronal T2W image. MRS with (D) long echo time [TE] and (E) short TE revealed increased choline, decreased N-acetylaspartate, and extremely high lactate and lipid peaks.
A
D E
B C
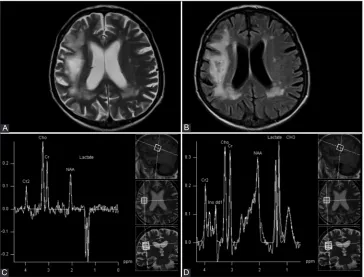
FIGURE 2. Rapid deterioration after treatment, associated with immune reconstitution inflammatory syndrome (IRIS), (A) mimicking
the extension of high-grade glioma through the corpus callosum, on the axial T2-weighted (T2W) sequence. (B) An extremely high peak of lactate on magnetic resonance spectroscopy with long echo time (TE), that was more prominent compared to choline and N-acetylaspartate peaks, and consistent with non-neoplastic, tumefactive demyelinating lesions.
MRS is a non-invasive technique that evaluates the met-abolic profile of the brain, by measuring the levels of several neurochemicals. The important peak, seen at 2.06 ppm in the proton spectrum of a healthy person, is related to NAA, a marker of neuronal integrity and function. A typical1H-MRS study of PML lesions shows a decrease of this metabolite. The increased Cho concentration, seen in patients with PML, highlights the presence of demyelination and increased cell membrane turnover. The elevated Lac peak observed in this disorder indicates increased macrophage activation after cell membrane breakdown, with consequent neuronal mito-chondrial dysfunction and activation of anaerobic glycolysis. Since the level of Cr does not significantly change in the dis-ease state, it is used as an internal standard. The myo-inositol (mI), a marker of glial inflammation, increases early in PML, but a decrease is seen in the later stages [15,16]. Several authors explained the typical MRS pattern of PML, which is associ-ated with the increased Cho/Cr ratio, reduced NAA/Cr ratio, as well as the presence of Lac, Lip and mI peaks [10,17]. It was found that the acute lesions of PML survivors had a markedly increased mI to Cr ratio, compared to the lesions in patients whose disease progressed, suggesting that the inflammation limits the disease progression [18].
However, a number of other brain diseases, neoplastic as well as inflammatory, are characterized by the same neu-rometabolic MRS pattern [17,19]. In addition, spectra with only Lac and/or Lip peaks have been evident in posttraumatic
or neoplastic cavities [4,19]. Gheuens et al. [17] detected major differences in the metabolic profile of the brain lesions of PML patients with IRIS compared with the patients without IRIS. However, in their study, the Lac peak was not separated from the Lip peak due to the overlapping of these metabolites in the sequence with short TE, used for evaluation [17]. IRIS is defined as paradoxical worsening of a patient’s clinical condi-tion associated with a recovery of the immune system after the initiation of combined antiretroviral therapy. The radiological finding may mimic high-grade glioma on conventional MRI, as shown in our patient (Figure 2A). However, MRS findings showing the presence of all metabolites, with Lac being the most prominent metabolite (Figure 2B), is not characteristic for glioblastoma or anaplastic astrocytoma. To the best of our knowledge, no other disorder has been documented in the lit-erature, in which Lac is observed as the dominant metabolite (with higher concentration compared to Cho), in the spectra in which all metabolites are present. This finding was especially prominent in our study using 135 ms echo time in1H PRESS sequence, offering better signal-to-noise ratio and unequivo-cal assignation of the Lac peak, due to its characteristic phase modulation. The increased Lac peak in patients with PML appears to be associated with the infiltration of macrophages and not caused by cellular hypoxia, since the “recovery” of Lac peak was revealed in the report of Pavlovic et al. [9], after the discontinuation of immunosuppressive medications in a patient with PML[9]. Cuvinciuc et al. [20] reported serial
FIGURE 3. (A) Axial T1-weighted [T1W], (B) T2W, and (C) fluid-attenuated inversion recovery (FLAIR) images showed a large T1W
hypointense lesion, and a T2W and FLAIR hyperintense lesion in the left parietal and frontal lobes, consistent with progressive multifocal leukoencephalopathy. Magnetic resonance spectroscopy (MRS) with (D) long echo time [TE] and (E) short TE, showed an increased cho-line, decreased N-acetylaspartate, and extremely high lactate peak.
A B
D E
short TE 1H-MRS in a patient with PML-IRIS, where it was obvious that the Lac-Lip peak increased with time [20]. This may suggest that a Lac peak does not have to be increased at the onset of the disease. Future studies, with a larger cohort of PML patients, should confirm these observations and their diagnostic and prognostic value.
DECLARATION OF INTERESTS
The authors declare no conflict of interests.
REFERENCES
[1] Sharma SK, Soneja M, Ranjan S, Miglani S, Hari S, Sinha S, et al.
Progressive multifocal leucoencephalopathy in HIV/AIDS: Obser-vational study from a tertiary care centre in northern India. Indian J Med Res 2013;138(1):72-7.
[2] Hurley RA, Ernst T, Khalili K, Del Valle L, Simone IL, Taber KH. Identification of HIV-associated progressive multifocal leukoen-cephalopathy: Magnetic resonance imaging and spectroscopy. J Neuropsychiatry Clin Neurosci 2003;15(1):1-6.
https://doi.org/10.1176/jnp.15.1.1.
[3] Kastrup O, Maschke M, Diener HC, Wanke I. Progressive multifo-cal leukoencephalopathy limited to the brain stem. Neuroradiology 2002;44(3):227-9.
https://doi.org/10.1007/s00234-001-0714-6.
[4] Kozic D, Ostojic J, Bjelan M, Koprivšek K. The role of MR spectros-copy in neurooncology. Prilozi 2012;33(1):425-33.
[5] Sweet TM, Del Valle L, Khalili K. Molecular biology and immu-noregulation of human neurotropic JC virus in CNS. J Cell Physiol 2002;191(3):249-56.
https://doi.org/10.1002/jcp.10096.
[6] Holloway RG, Mushlin AI. Intracranial mass lesions in acquired immunodeficiency syndrome: Using decision analysis to deter-mine the effectiveness of stereotactic brain biopsy. Neurology 1996;46(4):1010-5.
https://doi.org/10.1212/WNL.46.4.1010.
[7] Iranzo A, Moreno A, Pujol J, Martí-Fàbregas J, Domingo P, Molet J, et al. Proton magnetic resonance spectroscopy pattern of progres-sive multifocal leukoencephalopathy in AIDS. J Neurol Neurosurg Psychiatry 1999;66(4):520-3.
https://doi.org/10.1136/jnnp.66.4.520.
[8] Berger JR, Aksamit AJ, Clifford DB, Davis L, Koralnik IJ, Sejvar JJ, et al. PML diagnostic criteria: Consensus statement from the AAN Neuroinfectious Disease Section. Neurology 2013;80(15):1430-8. https://doi.org/10.1212/WNL.0b013e31828c2fa1.
[9] Pavlovic AM, Bonaci-Nikolic B, Kozic D, Ostojic J, Abinun M, Svabic-Medjedovic T, et al. Progressive multifocal leukoenceph-alopathy associated with mycophenolate mofetil treatment in a woman with lupus and CD4 T-lymphocyte deficiency. Lupus 2012;21(1):100-2.
https://doi.org/10.1177/0961203311416693.
[10] Yoon JH, Bang OY, Kim HS. Progressive multifocal leukoencepha-lopathy in AIDS: Proton MR spectroscopy patterns of asynchronous lesions confirmed by serial diffusion-weighted imaging and appar-ent diffusion coefficiappar-ent mapping. J Clin Neurol 2007;3(4):200-3. https://doi.org/10.3988/jcn.2007.3.4.200.
[11] Aksamit AJ Jr. Progressive multifocal leukoencephalopathy. Continuum (Minneap Minn) 2012;18(6 Infectious Disease):1374-91. https://doi.org/10.1212/01.CON.0000423852.70641.de.
[12] Dahlhaus S, Hoepner R, Chan A, Kleiter I, Adams O, Lukas C, et al.
Disease course and outcome of 15 monocentrically treated natal-izumab-associated progressive multifocal leukoencephalopathy patients. J Neurol Neurosurg Psychiatry 2013;84(10):1068-74. https://doi.org/10.1136/jnnp-2013-304897.
[13] Davis MJ, Khan A, Royal W 3rd. Progressive multifocal
leukoen-cephalopathy as the first manifestation of occult sarcoidosis: Case report and review of the literature. Neurologist 2013;19(1):26-9.
FIGURE 4. A subcortical lesion in the right frontal and parietal lobe, hypointense on T1-weighted (T1W) image (not shown),
hyperin-tense on (A) T2W and (B) fluid-attenuated inversion recovery (FLAIR) images, with a sharp border toward gray matter, typical for progres-sive multifocal leukoencephalopathy. Magnetic resonance spectroscopy (MRS), with (C) long echo time [TE] and (D) short TE showed an increased choline, decreased N-acetylaspartate, and extremely high lactate peak.
A
C
B
[16] Shah R, Bag AK, Chapman PR, Curé JK. Imaging manifesta-tions of progressive multifocal leukoencephalopathy. Clin Radiol 2010;65(6):431-9.
https://doi.org/10.1016/j.crad.2010.03.001.
[17] Gheuens S, Ngo L, Wang X, Alsop DC, Lenkinski RE, Koralnik IJ.
[20] Cuvinciuc V, Martin-Blondel G, Marchou B, Bonneville F. Proton MR spectroscopy of progressive multifocal leukoenceph-alopathy-immune reconstitution inflammatory syndrome. AJNR Am J Neuroradiol 2010;31(8):E69-70.

![FIGURE 3. (A) Axial T1-weighted [T1W], (B) T2W, and (C) fluid-attenuated inversion recovery (FLAIR) images showed a large T1Whypointense lesion, and a T2W and FLAIR hyperintense lesion in the left parietal and frontal lobes, consistent with progressive mul](https://thumb-us.123doks.com/thumbv2/123dok_us/8670586.1730655/4.595.118.481.71.343/weighted-attenuated-inversion-whypointense-hyperintense-parietal-consistent-progressive.webp)