l
Submitted 08.09.15 / Accepted 03.12.15
Mark Sutcliffe and Miles Weston are with TWI Technology Centre (Wales), Harbourside Business Park, Harbourside Road, Port Talbot SA13 1SB, UK.
Peter Charlton is with the University of Wales Trinity Saint David, Swansea, UK.
Virtual source aperture image processing methods
for non-destructive testing
Until recently, the processing of ultrasonic array data has been based on parallel transmission strategies enabling beam
forming to occur within the material, with summing of the time domain signals performed in hardware on reception.
These time domain signals are then typically stacked in software to produce B-scan images. Since the introduction of full
matrix capture there has been advancement in post-processing algorithms, allowing for fully-focused inspections to be
undertaken by dividing the area to be inspected into a grid of pixels and treating each as a focal point (the total focusing
method). However, due to the large number of time domain signals associated with this approach, processing speed is
often a limiting factor.
Virtual source aperture (VSA) is an ultrasonic technique in which a highly divergent beam is generated using a focal law to
simulate emission from a virtual point positioned some distance behind the transducer. When combined with each element
of the array acting as a receiver, sufficient time domain signals may be acquired to allow B-scan images to be generated in
real-time. In this paper, various imaging algorithms are presented, where the ability to image a series of point-like reflectors is
demonstrated. Due to its high data acquisition speed, low computational requirement and reduced data size, VSA is shown
to offer significant performance advantages over other advanced ultrasonic techniques, such as FMC.
M Sutcliffe, P Charlton and M Weston
1. Introduction
Phased array ultrasonic testing (PAUT) has seen widespread industry adoption within a variety of non-destructive testing (NDT) industry sectors. Due to its ability to minimise mechanical movement through electronic steering and to generate real-time B-scan images, it offers a significant advantage over conventional ultrasound. The principle of PAUT is to carry out beam-forming within the material by varying the timings of the firing of the elements according to a predefined focal law.
Within the past few years, full matrix capture (FMC) has been used to acquire the full time domain signal from every possible transmit/receive combination through sequential transmission of each element in the array. This has an advantage over PAUT in that advanced ultrasonic imaging algorithms can simulate fully-focused imagery during post-processing. One such algorithm is the total focusing method (TFM). Due to its simple data acquisition strategy, FMC acquisition is easier for an operator to use than PAUT, as there are no complex focal laws to determine. Post-processing of the FMC+TFM data is often carried out some time after the inspection, although recent advancements in computer processing power have shown that real-time inspection is possible[1]. One of the challenges facing FMC as a practical inspection tool is the speed at which data can be acquired and processed, hindering its widespread adoption. Previous work has sought to address this issue by limiting transmission cycles[2].
By combining a phased array-type transmitting strategy (where all elements transmit in parallel to a predefined focal law) with an FMC-type receive strategy (where all elements receive data individually), VSA has the advantage of limiting the transmission cycles significantly compared to those of FMC, PAUT and conventional ultrasound, while allowing sufficient time domain information to be captured to facilitate in the generation of fully-focused ultrasonic imagery[3]. Unlike PAUT, focusing is not carried out within the material; instead an unfocused divergent beam is transmitted. Focusing is carried out during image reconstruction using software, as with FMC.
To provide a context for VSA with respect to conventional ultrasound and PAUT, and to illustrate the focusing capabilities, three imaging algorithms are presented here: a conventional B-scan (which is analogous to conventional ultrasound); a sector scan (based on phased array imaging); and a fully-focused B-scan (similar to the way in which FMC+TFM data is processed). These algorithms are validated experimentally by imaging a series of diagonally-aligned side-drilled holes (SDHs). Due to the data acquisition requirements of VSA, these algorithms can be implemented in real time.
2. Virtual source aperture ultrasonic
array data
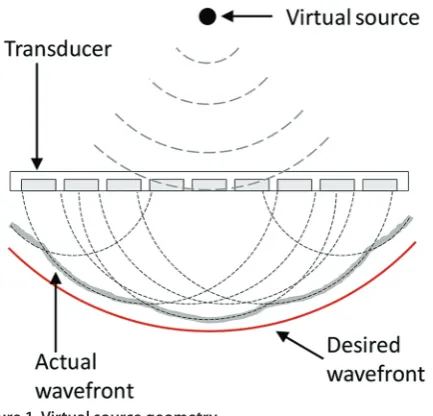
Positioning of a virtual source some distance behind the transducer allows for multiple elements to fire according to a delay law simulating an ultrasonic transmission as if it had occurred from the virtual source, a technique first explored in medical ultrasound[4,5]. When combined with a ‘receive on elements’ strategy, sufficient time domain signals may be acquired to allow for the generation of fully-focused imagery[3]. For an array of N elements, VSA requires just a single ultrasonic transmission, with N time domains collected.
and allows for an approximation of a highly-divergent beam to be generated.
VSA, like FMC, introduces a simpler data acquisition strategy than PAUT, leaving image reconstruction to occur during post-processing through custom algorithms to achieve the best visualisation of the data. While initially these algorithms may look complex, much of this complexity (within the software application) is hidden from the operator, resulting in a simplified inspection process. For a standard contact mode system using VSA, it is only necessary to provide basic transducer information (pitch and number of elements), a region of interest to inspect relative to the transducer and the velocity of the material being inspected. From this, there is sufficient information for the algorithm to process the request (including the calculation of start and end gates and optimal virtual source position).
VSA may be used to acquire data with a single transmission, or a sub-aperture defined to allow for linear or angular sweeping over the array[3]. The latter allows for additional time domain signals to be acquired by synthesising a virtual array from a series of virtual point sources. This has the ability to provide greater angular coverage should the inspection scenario require it. For the purpose of this work, a single virtual source is used.
3. Post-processing algorithms
In this section, three imaging algorithms currently used in NDT are explored in the context of VSA-acquired data. Firstly, an analogy to conventional ultrasound is given through a definition and implementation of the plane B-scan; secondly, the phased array sector scan is implemented on VSA-acquired data, where reconstruction is possible with a reduced number of firings when compared to traditional phased array implementations; and thirdly, a description is given to allow for full-focused imagery throughout the region of interest, where every pixel in the image acts as a focal point.
For simplicity, algorithms are described here with respect to direct contact mode inspection. It is a trivial step to expand these equations to work through a refractive boundary by considering Fermat’s principle of least time[3]. Accounting for the refractive boundary allows for VSA to be used for practical weld inspections, immersion testing and to compensate for the geometry of an irregular profile.
3.1 Plane B-scan imaging of VSA-acquired
data
Conventional ultrasound B-scan imagery is typically produced by plotting intensity values for received time domain signals for a given position. When considering a linear phased array transducer, A-scan acquisition can be achieved by electronically firing and receiving on each element individually and plotting to allow for B-scan imagery to be generated without physical movement of the probe. However, due to the small element size, this approach often leads to poor lateral resolution. To overcome this, it is common to fire several elements (referred to as the sub-aperture) in parallel to produce a planar beam. Received signals are then summed and the sub-aperture is electronically shifted along the array. This has the effect of simulating a transmission from a conventional probe of the same size as the sub-aperture.
In the processing of VSA-acquired data, the plane B-scan imaging algorithm sums time domain signals corresponding to a user-defined sub-aperture size. Intensity values of a given pixel are calculated based on depth, as shown in Equation (1), where x,z
corresponds to a pixel location, I is the intensity value assigned to the pixel, N is the number of elements in the entire array aperture, S
is the number of elements in the sub-aperture, v is the virtual source position above the transducer, rx is the received time domain signal and c is the velocity. A Hilbert transform h has been used to convert the time domain signal into its real and imaginary parts to yield phase information:
I x
( )
,z = hrx 2 z−vc ⎛ ⎝⎜
⎞ ⎠⎟ s=n−S−1
2
n+S−1
2
∑
n=S+1
2
N−S+1
2
∑
... (1)Summation is performed on each column of the B-scan for every time domain signal received. Lateral resolution is limited to the element size of the physical array. Linear interpolation may be used to improve resolution with respect to depth.
3.2 Sector scan imaging of VSA-acquired data
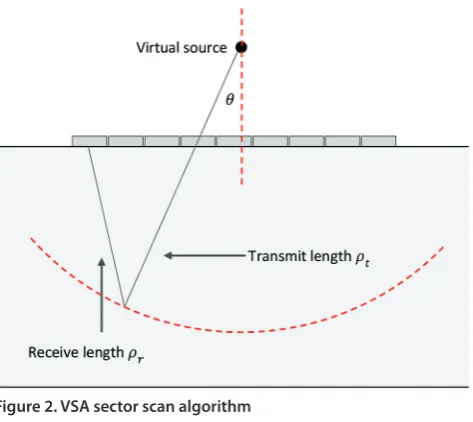
The sector scan is the most common output for phased array inspections. Unlike the planar B-scan, all elements of the array are used to steer a beam through a range of angles. For traditional phased array, the pulser/receiver fires according to a delay law for each beam angle with the summation of time domain signals performed in hardware. These time domain signals are then plotted as intensity values using a polar coordinate system.During the acquisition of VSA data, no beam steering is implemented. Instead, a highly divergent beam is sent into the material. In the processing of VSA data for sector scan display, it is necessary to simulate appropriate time delays in the processing algorithm to account for transmission through a range of angles. Considering the virtual source position and receive element location allows for this information to be extracted from a single VSA transmission, as shown in Equation (2), where ρt and ρr
represent the transmission and reception radii to a given angle and θ is the beam steer angle used to simulate the phased array transmission:
I
( )
ρt,θ = hrxρt−v+ρr c ⎛ ⎝⎜ ⎞ ⎠⎟ n=1 N
∑
... (2)This concept is illustrated in Figure 2, where θ represents the transmission angle and is iterated through for a range of values. The reception length is easily determined using the standard Pythagoras theorem.
Figure 1. Virtual source geometry
3.3 Total focus B-scan imaging of
VSA-acquired data
TFM has been used for several years to process FMC-acquired data. Its use in NDT was first explored by the University of Bristol[6] and is based on the exact same imaging principles as SAFT. Considering a virtual source positioned behind the transducer allows for fully-focused TFM imagery to be generated. First, a region of interest is defined as a grid of pixels representing the inspection region and intensity values for each pixel are then determined by summing the relevant parts of the A-scans in relation to the pixel, probe and virtual source geometry. This is shown in Figure 3, where a and b
are the transmit and receive lengths, respectively, to a pixel located at position x,z.
I x
( )
,z = hrx a+b−v c ⎛ ⎝⎜⎞ ⎠⎟ rx=1
N
∑
... (3)4. Results
To demonstrate the imaging capability of VSA, data was acquired using a 5 MHz Olympus 5L64-A2 transducer using 64 elements with an inter-element spacing of 0.6 mm. The transducer was placed in direct contact with a ferritic steel block containing a series of diagonally-aligned 1 mm-diameter SDHs. The virtual source was positioned at the centre of the transducer and at half aperture height to achieve the widest possible coverage from a single transmission. A Peak NDT MicroPulse 5PA array controller was used acquire
the ultrasonic data in 12-bit format. The instrument supports gigabit Ethernet data transfer at a maximum rate of 55 MB/s. Based on the region of interest, a scan length of 600 sample points was acquired over all 64 elements of the array. This data was transferred in real time over the Ethernet connection to a Windows-based PC containing code implementing each of the imaging algorithms. This experimental configuration is shown in Figure 4.
The theoretical data transfer rate of the experimental system was determined as 1 kHz, where each acquisition required 56.25 kB. For automated inspection, assuming a 1 mm encoder scan increment, this is equivalent to a scan speed of 1 m/s, although faster scanning speeds are achievable with alternative hardware.
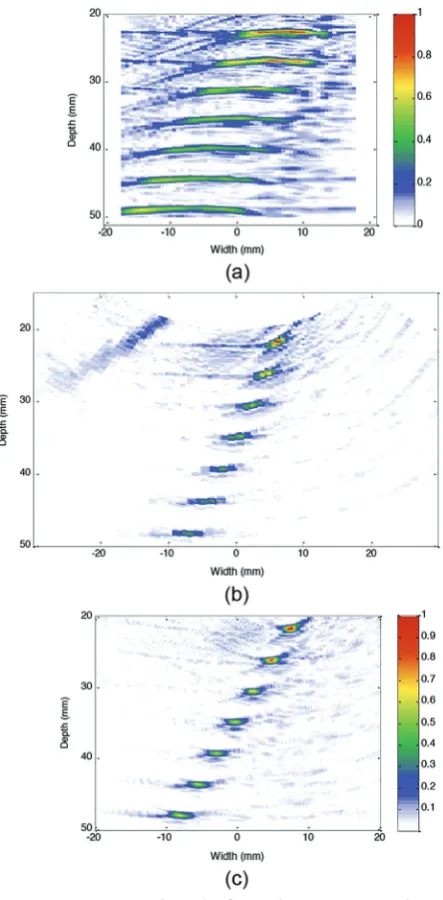
Data was processed for each of the algorithms described in Section 3 and shown in Figure 5, where VSA data acquired from a single transmission was used for each reconstruction algorithm. These images demonstrate the ability to image VSA data using a wide variety of algorithms and represent both a conventional ultrasonic approach and a traditional phased array approach. Reconstruction was also shown for an advanced imaging algorithm capable of producing fully-focused imagery throughout the inspection volume.
As expected, the plane B-scan results in imagery with poor lateral resolution, making sizing difficult. While each SDH is clearly visible, the response is elongated with diffraction arcs at each SDH location. This is consistent with images generated through a conventional ultrasonic data acquisition method. While the sectorial scan provided significant improvement in lateral resolution, significant computational requirement was needed in order to simulate the capability of phased array beam focusing for each angle. As each pixel received contributions from multiple receive locations, improvements in signal-to-noise ratio are seen over the conventional ultrasonic approach. The best response in terms of image quality can be seen in the final image, where each pixel is treated as a focal point.
Comparing the sector scan to the fully-focused image, it can be observed that in the latter image the amplitude response is more uniform with depth. This is due to each pixel of the Cartesian coordinate system being uniform in size, where triangulation of all possible angles is used. In the case of the sector scan, each pixel intensity value receives a contribution from the sector scan transmission angle and reception angle. The transmission angle increment is finite (in this case –45º to +45º with 1º scan increments – consistent with a typical phased array set-up) and results in fewer angular contributions than the fully-focused method. The sector Figure 2. VSA sector scan algorithm
Figure 3. VSA imaging for a single source
scan resolution also degrades with depth due to an increase in lateral size with respect to the angle increment (again consistent with traditional phased array).
To qualitatively compare the performance of each of the imaging algorithms presented here, the top-most SDH, located at 22 mm, was used to obtain a plot of the reconstructed data for each imaging algorithm and is shown here in Figure 6. This plot is essentially a reconstructed amplitude scan that can be used for analysis.
To quantitatively assess the imaging capability of the VSA-reconstructed algorithm, measurements were recorded at –6 dB of the peak response and are shown in Table 1. It can be observed that the plane B-scan gave a larger response than the sector and fully-focused equivalents. Both the sector and fully-fully-focused methods gave similar responses, which is expected as each implements a focusing algorithm based on synthetic aperture imaging principles intended to improve lateral resolution. Indeed, the sector plot is
similar in implementation to the fully-focused method, with the exception of the coordinate system used.
Table 1. SDH response
Method –6 dB width (mm)
Plane B-scan 2.001
Sector scan 1.375
Full focus 1.373
5. Discussion and conclusions
This paper described three methods to visualise VSA-acquired data, with VSA being a data acquisition method based on the concept of a virtual source positioned some distance behind the transducer. When compared to conventional ultrasound or phased array, VSA is able to acquire data with a significant reduction in the number of ultrasonic firings. For the work presented here, a single virtual source was used, obtaining data from just a single ultrasonic transmission cycle.
For a comparative study, image reconstruction algorithms were presented allowing B-scan imagery to be generated. In this instance,
N transmissions would be required (where N represents the number of elements in the array). From the VSA data, image reconstruction is possible from just a single transmission. Representative of a conventional ultrasonic approach, the plane B-scan suffered from poor lateral resolution and greater improvements were possible after consideration of a synthetic aperture imaging algorithm.
The sector scan (common to most PAUT inspections) provides the ability to sweep along a range of angles, with beam forming occurring within the material. The number of ultrasonic transmissions is determined by the angular range and angular step size. It is not uncommon to fire in excess of 64 times to obtain a suitable sector scan. Again, with VSA just a single transmission is required to obtain a sector scan, by focusing through a range of angles during image reconstruction.
Finally, the ability to treat every pixel in an image as a focal point provides the ability to generate a B-scan that is representative of a region of interest within the test material. This has several advantages, including an easier set-up procedure, no requirement to provide a sub-aperture size or sweep angles, improved lateral resolution and ease of interpretation due to pixels being of the same aspect ratio (sector scan pixel size increases with depth).
Due to the reduced number of ultrasonic transmissions, data acquisition and subsequent processing are achievable at significantly higher speeds than existing ultrasonic methods. It is not impractical for VSA to acquire and generate fully-focused imagery at a speed Figure 5. Experimental results for each VSA imaging algorithm.
In each case, the same dataset was used and processed with a different processing algorithm. Data was acquired from a single VSA firing with the virtual source positioned horizontally central to the array and at half aperture height
Figure 6. Amplitude plot from first SDH response
of several metres per second, making it suitable for a wide range of industrial sectors where performance is a key factor. While some compromise in image quality in terms of SNR may be present with regards to a comparison of VSA+TFM and FMC+TFM, some improvement can be achieved with additional signal processing[7] or through additional VSA firings[3].
Acknowledgements
This work was carried out at TWI Technology Centre (Wales) with the support of the University of Wales Trinity Saint David (UWTSD).
References
1. M Sutcliffe, M Weston, B Dutton, P Charlton and K Donne, ‘Real-time full matrix capture for ultrasonic non-destructive testing with acceleration of post-processing through graphic hardware’, NDT&E International, Vol 51, pp 16-23, 2012. 2. L Moreau, B W Drinkwater and P D Wilcox, ‘Ultrasonic
imaging algorithms with limited transmission cycles for rapid non-destructive evaluation’, IEEE Transactions on Ultrasonics, Ferroelectrics and Frequency Control, Vol 56, No 9, pp 1932-1944, 2009.
3. M Sutcliffe, P Charlton and M Weston, ‘Multiple virtual source aperture imaging for NDT’, Insight, Vol 56, No 2, pp 75-81, February 2014.
4. M Karaman and M O’Donnell, ‘Synthetic aperture imaging for small-scale systems’, IEEE Transactions on Ultrasonics, Ferroelectrics and Frequency Control, Vol 42, No 3, pp 429-442, 1995.
5. C H Frazier and W R O’Brien, ‘Synthetic aperture techniques with a virtual source element’, IEEE Transactions on Ultrasonics, Ferroelectrics and Frequency Control, Vol 45, No 1, pp 196-207, 1998.
6. C Holmes, B Drinkwater and P Wilcox, ‘Post-processing of the full matrix of ultrasonic transmit-receive array data for non-destructive evaluation’, NDT&E International, Vol 38, pp 701-711, 2005.