Energies2018, 11, x; doi: FOR PEER REVIEW www.mdpi.com/journal/energies Article
Online Demand Side Management with PEVs Using
Stochastic Optimization
Moses Amoasi Acquah, Byeonggu Yu and Sekyung Han *
Department of Electrical Engineering, Kyungpook National University, 80 Daehak-ro, Sangyeok-dong, Buk-gu, Daegu 41566, Korea; [email protected] (M.A.A.); [email protected] (B.Y) * Correspondence: [email protected] or [email protected]; Tel.: +82-10-2179-0612 (S.H)
Abstract: This study purposes the use of plug-in electric vehicles for demand side management (DSM) considering uncertainties in demand as well as uncertainties due to mobility of PEV to mitigate peak demand. The solution also seeks to reduce electric cost in addition to reducing the effects of greenhouse gases. In recent years DSM using distributed storage system such as battery energy management system (BESS) and plugged-in electric vehicles (PEV) have become very prevalent with most implementations resorting to deterministic load forecast. These methods do not consider the potential growth in demand making their solutions less robust. In this study we propose a real-time density demand forecast and stochastic optimization for robust operation of PEV for a building. This method accounts for demand uncertainties in addition to uncertainties in mobile energy storage as found in PEV, making the resulting solution robust as compared to the deterministic case. A case study on a real site in South Korea is used for verification and testing. The proposed study is verified and tested against existing algorithms. The result verifies the effectiveness of the proposed approach.
Keywords: demand-side management; peak demand control; dynamic-interval density forecast; stochastic optimization; dimension reduction; battery energy-storage system (BESS), plugged-in electric vehicles (PEV); vehicle-to-grid (V2G) ; building energy-management systems (BEMS)
1. Introduction
Uncoordinated energy consumption due to growth in demand and high penetration of EVs degrades power quality and translates into high energy cost. Consequently, the onus lies with the grid operators to put in much effort toward reducing peak demand via various demand-side management (DSM) methods such peak shaving and energy arbitrage via financial incentives [1]. DSM sets up incentives to encourage users to consume less power during peak times or defer energy use during peak times to off-peak times to mitigate the peak demand, thereby lowering the electricity cost as well as carbon emission levels for a stable grid [2][3].
Building energy-management systems (BEMS) have been widely deployed for DSM using various techniques such as price and incentive-based DR programs [4][5]. In recent years, most DSM techniques resort to battery energy storage systems (BESS) for their operations due to their benefits such as fast and high-power response and also their modularity which enables them to be employed for different applications and purposes as compared to traditional energy sources [6][7].
Various research approaches employed BESS to prevent peak demand from exceeding the predetermined value and suppress the voltage imbalance factor within the recommended value [8]–[10]. The research in [11] aims to reduce the electricity cost based on time-of-use (TOU) charges and peak power demand charges as issued by grid companies via load shifting and peak clipping respectively to reduce electricity bill for customers. These solutions help distress utility companies especially during high peak power demands times.
Most DSM solution resort to deterministic forecast approach which is an inadequate representation of real-life occurrences of demand [11]–[15]. Electric power demand recorded under
practical applications is a time-series data with uncertainties. A single point out of the sample forecasts the future value of demand at a specific time based on historic data. On the other hand, the density forecast gives a forecast at a certain probability value, because, in reality, it is difficult to forecast the demand with certainty at a certain time in the future. Density forecast models are useful not only in forecasting the future behaviour, but also in determining optimal operation and control policies [16][17]. The above solutions to DSM do not take into consideration the stochastic nature of demand. The work in [18] deals with real-time forecast and control of HVAC for cost minimization and users’ thermal comfort but it is not focused on peak demand control using BESS. The research by [19] provide a real-time dynamic interval density forecast and stochastic optimisations to account for demand uncertainties. The solution is focused on the use of the algorithm in conjunction with stationary BESS for peak demand control.
In addition to its benefits, BESS can providing electrification for vehicles to reduce the amount of greenhouse gasses (GHG) produced by road transportation [20]. Plug-in electric vehicles (PEVs) has the capability to charging their on board batteries and use the stored energy for transportation as well as provide ancillary service such as peak shaving for demand side management in a configuration known as vehicle-to-grid (V2G) [20].
Aside these benefits, uncontrolled use of PEV in bulk has the likelihood of introducing uncertainties causing demand to peak. The total energy needed to support demand side management in a V2G setting hinges on the number of PEVs on the grid and their mobility, as such the contribution of each PEV should be fairly distributed.
V2G management control can be setup as a centralized and decentralized control. the centralized control has an aggregator at the helm of affairs with the responsibility of managing each participating PEV in the V2G service on how and when to charge or discharge of PEV in a coordinated fashion [21], [22]. In the decentralized control each PEV is responsible for its own charge and discharging operation making it convenient and easier to implement practically given room for a localized grid [23]–[25]. One down side of a decentralized operation is a feature of randomness as a result of uncertainties in the arrival and departure time of PEVs’ which introduces randomness in the available energy committed by PEVs’ thereby causing randomness to the grid.
Several approaches for demand side management via PEV have been presented in the literature [26]–[30]. In most of these studies the required amount of peak shaving is not certain. As a result, a controlled V2G approach to foster condonation is eminent. Most research considering V2G follow the peak limit tightly by discharging PEVs when the demand exceeds the peak limit [27], [29], [30].This method resorts to deterministic forecast which is susceptible to fail under uncertainty. since demand forecast and EV user’s availability cannot be foretold with certainty, a solution that does not consider these conditions is not robust. Also, it’s very important to consider the minimum SoC at departure to allow EV user enough energy for a trip back home. This condition is mostly ignored in most research [26]–[29].
The works in [23]–[25], [31], [32] proposes a DSM solution considered uncertainties in demand; [31] and [32] account for system uncertainties in a worst-case scenario. These assumptions may be cost intensive on an operational level. In [33] the authors discusses a stochastic solution for BESS and PEV considering uncertainties in demand and mobility. The approach does not consider dynamic-interval forecast of demand and optimization to improve the accuracy of future forecasts and the optimization hinges on minimizing the squared error of the difference in demand and peak limit without considering energy arbitrage.
paper, only the concept and format of DIDF are presented for application to the dynamic scheduling of a PEV. To this end, a dimension-reduction method, termed piecewise peak approximation (PPA), is employed to reduce the dimension of the demand probability distribution (DPD) obtained from DIDF for a faster computational time.
The solution is modelled to include electric vehicles in V2G mode considering the stochastic nature in the arrival and departure of PEV users. To obtain the available energy capacity that PEVs will contribute at every time instance in a day ahead density forecast, the arrival, departure and committed energy during plugin period is modelled as a random variable. The algorithm is modelled to ensure a coordinated and even discharging of available PEV considering each EVs mobility. Furthermore, the algorithm ensures a minimum SOC level is kept for emergency departures at any time. These are realised in conjunction with a day ahead density demand forecast, a given peak limit and characteristic of PEV. The achieved model is then formulated as an optimization problem for a robust schedule resulting in cost saving as well as peak demand reduction while satisfying the technical constraint of maximizing energy storage efficiency and life cycle. The proposed method is then applied to an actual environment in South Korea to verify the performance.
The rest of this paper is organized as follows. Section 2 describes the proposed approach to DSM via stochastic optimization. Section 3 discusses the problem formulation. Section 4elaborates on a case study and experimental evaluation of the proposed approach using data from a real site in South Korea. Section 5 gives a discussion on the proposed approach as compared to a deterministic case Finally, Section 6 provides a summary of this paper with spotlights on the main concepts, results and conclusions.
2. Proposed Methodology
This paper proposes a DSM solution comprising four modules: A dynamic-interval density forecast module, a dimensionality reduction module, an EV mobility module and a stochastic optimization module.
2.1. Dynamic-Interval Density Forecast
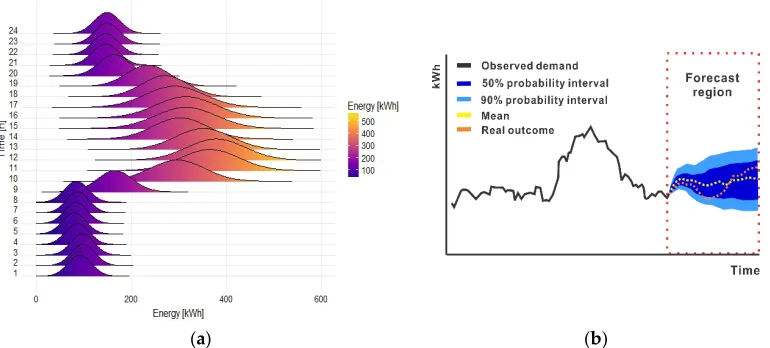
As mentioned in the previous section, density forecast is generated a day in advance based on ex post data as a probability distribution at each time instance in a day horizon. This is to cater for the uncertainties in demand which is ignored in the case of an out of sample day-ahead forecast, as it forecast a single demand value for each time instance in a day horizon. Electric demand is a random variable that depends on many factors like weather, special events, and socioeconomic factors. Since electric demand exist in real-life with uncertainties a DMS solution that ignores the uncertainty factor will be susceptible to errors. In such a case BESS schedule is not robust and peak demand might not be resolved in a cases where forecasted demand deviates from observed demand [19].
(a) (b)
Figure 1. (a) Demand forecast as a probability distribution (DPD); (b) Demand distribution forecast with confidence interval
2.2. Dimensionality Reduction Module
Because of the stochastic nature of demand, many demand profile scenarios are possible. Given demand distribution samples at 15-min intervals in a day horizon, there are n = 96 sample points, where n is the number of demand distributions in a day horizon. The number of possible demand profile scenarios that can arise from this setup is
a
n, where a is the number of samples in each demand distribution. If there are a = 5 samples in each demand distribution, the number of possible demand profile scenarios can be evaluated as5
96, which is not feasible for real-time optimization even with a high-performance computer. In real-time applications, time is of the essence; therefore, using dense or high-dimensional data will affect the execution time.We fall on Piecewise Peak Approximation as proposed by [19] to perform dimensionality reduction of the data with high fidelity, to reduce the dimension of the DPD.
According to [19], given a probability distribution forecast of demand, referred to as DPD,
1 2
{ , ,..., }
nX
d d
d
, whered
i is the probability distribution forecasted at the i-th time instance, piecewise peak approximation (PPA) can be used to reduce then
dimension of DPD tom
for a faster computational time. PPA is performed by dividing a day horizon intom
partitions to following time-of-use (TOU) price periods, where different periods in a day horizon are assigned different energy use price tag. Since one objective of DSM is to reduce peak demand below a set peak limit, the peak propensity (probability to exceed the peak limit) for each distribution in the DPD is evaluated using (1). The reduction is achieved by approximating all distributions found in each of them
partitions with the distribution having the maximum peak propensity via (2).( ), ( )
( ),
i i
i
i i
PlP d d Pl
PP d
PlP d d Pl
(1)
( ), i ( ),...,i ( )i
Maximum peak propensity PP d PP d PP d (2)
where
P
( )
is the probability function,P l is the peak limit.The PPA produces a reduced demand probability distribution (RDPD) represented as
1 1 2 2
ˆ ˆ ˆ
{ , , , ,..., m, m }
H d r d r d r , where ˆ
k
occur. Preserving these price-change points during dimensionality reduction makes it convenient to apply the right TOU price during optimization.
2.3. EV mobility
To participate in the DSM via ancillary services, a service agreement to register EV owners is required. To foster coordination and control EVs are deemed to communicate relevant data to grid operator in real-time. Vehicle information system (VIS) managed by the operator is responsible for real-time data collection of EVs information such as current position (GPS), EVs covering battery state of charge (SOC), and expected arrival time. This information is collected wirelessly at set time intervals. There exist mainly two V2G architectures: the direct architecture and centralised architecture. In the direct V2G architecture the communication and energy contract are private and exist between the EV owner and grid service provider (Distribution system operators: DSO) or energy management system (EMS). This type of architecture is prudent for a relatively small-scale EMS such building energy management system (BEMS) and factory energy management system (FEMS) where PEVs are parked for long durations in a day. This architecture scheduling is simple and faster making it convenient, flexible and optimized for profit among the stakeholders. On the flip side the centralised or aggregator-based architecture involves EV owners in service agreement with aggregators who are the providers of electricity services.
Base on the available information recorded from EV and EV owners, DSO determine the available number of PEVs as well as the total committed energy capacity for DSM a day ahead.
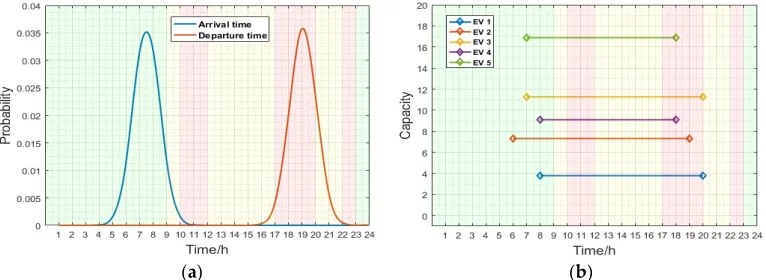
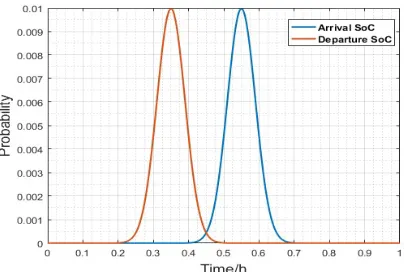
To better model the stochastic behaviours of EVs, a realistic daily travel scenario and charging patterns of EVs is monitored and recorded over a period of time. From this data a goodness-of-fit method is used to identify and model to correct probability distribution of arrival and departure time as well as the distribution of arrival and departure SoC, distribution of amount of energy committed and distribution for the duration of stay (parked duration). Research has shown that the distribution of this data follows the Gaussian distribution as shown in Figure 2a and 3a. Characteristically, on the average EVs arrive in the morning at work at about 7.30 AM and leave at 7.05 PM. As a requirement PEV are prevented from full discharge to allow EVs a minimum energy for a trip home.
Based on the real-time data obtained from EVs in conjunction to the ex post data a density forecast of arrival and departure time as shown in Figure 2a, arrival and departure SoC as shown in Figure 3a, committing energy as shown in Figure 3b and duration of stay is obtained at regular intervals. From this information the expected arrival and departure time, expected arrival and departure SoC, expected committing energy and expected duration of stay is evaluated for the stochastic optimization.
(a) (b)
Figure 3. (a) EV arrival and departure SoC distribution in a day horizon (b) PEV committed energy profile
2.4. Stochastic Optimization
The strength of stochastic programming lies in modelling optimization problems with uncertainty [34]. Whereas deterministic optimization problems are formulated with known parameters, practical problems almost invariably include parameters which are unknown at the time a decision should be made. When the parameters are uncertain but assumed to lie in some given set of possible values, one might seek a solution that is feasible for all possible parameter choices and optimizes a given objective function.
Stochastic optimization approaches the demand side management (DSM) problem by optimizing (minimizing) the total cost on average,
min [ ( , )]
x X
E f D x
, wherex
is the decision variable and D is demand as a random variable. Stochastic optimization evaluates the best cost and controls the peak demand for a given objective under demand uncertainties.3. Problem Formulation
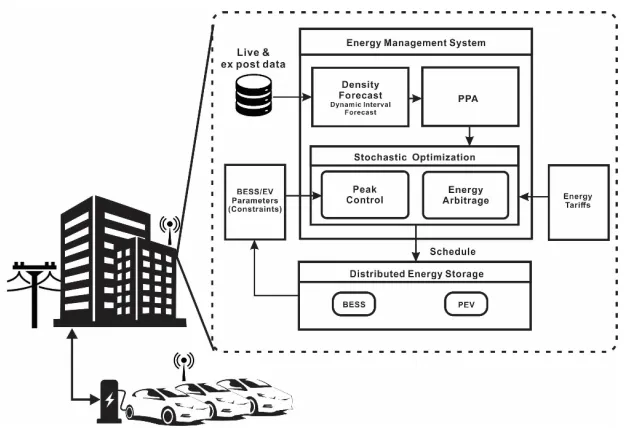
The objective of the proposed approach is to provide demand side management considering uncertainties in demand and energy storage due to PEV. The algorithm performs a probability distribution forecast at set intervals using ex post data. The demand probability distribution (DPD) produced after the forecast is dimensionally reduced for faster computation via piecewise peak approximation (PPA). The reduce demand probability distribution (RDPD) is used as input to the stochastic optimization in conjunction with energy tariff and parameter constraints which seeks to provide a coordinated and robust BESS schedule for each PEV with a given objective while satisfying technical and efficiency constraints of PEV, as shown in Figure 4. The objective function of the stochastic optimization is divided into two parts:
Figure 4. Proposed system architecture
3.1. Energy Cost
The energy cost represents the amount of energy used within a period multiplied by the TOU energy price. For 24-hour horizon, the charge and discharge energy schedule for each PEV is optimized. The design optimization algorithm provides BESS control schedule candidates at each iteration of the optimization process,ExevE E1ev, 2ev,...,Emev, based on conditions established as constraints to the objective function where ev
x
E is the energy schedule for the xth PEV and
1, 2,...,
x
s
wheresis the number of EVs participating in V2G service.In a distribution sense, the energy cost is the total expected demand multiplied by the TOU energy price, which can be evaluated using (3).
TOU
1
Cos t
m
tou
k k
k
g C
(3), ˆ
[ s ev]
k k i k
i
g E d
E (4)where ,
ev i k
E
is the energy discharged by ith PEV at the kth instance, dˆk is the k-th distribution inRDPD,
e
k is the BESS schedule provided at the k-thinstance by the optimization algorithm, CkT O U is the TOU energy price at the k-thinstance,g
k is the expected demand of the k-th distribution inRDPD, and TOU
Cos
t
is the total expected cost of energy in a day.3.2. Demand Cost
The demand cost is the maximum 15-min average power over a month multiplied by the demand price. This is evaluated using (5). The demand cost and energy cost must be unified. Normally, the demand cost is evaluated monthly, whereas the energy cost is calculated at a unit time interval. Because of this difference in units, the demand cost needs to be evaluated correctly at unit time intervals such that the accumulated demand cost over a month is equal to the monthly demand cost, as expressed by (9). The unified daily demand cost can be evaluated using (10).
max
Cos t
D DD
C
(5)max max max 1 , 2 ,...,
max q
max
1
,
2,...,
l l l lm
H
h h
h
(7)ˆ
ˆ
(
), (
)
ˆ
ˆ
ˆ
(
)
(
), (
)
lk k lk k
lk
lk k lk lk k
Pl P d
e
d
e
Pl
h
d
e
P d
d
e
Pl
(8) 1 max 1Cos t { }
q
D m U D
lk k l
h C D C
(9)1
Cos t
d{ }
m Ulk k
h
C
(10)/
D UC
C
m
q
(11)28, Feb 29, Feb(leap year) 30, Sept, Apr, Jun, Nov 31, Otherwise
q (12)
where D
C is demand price for a month, m ax l
H
is the maximum demand on the l-th day,Dmax is maximum demand for a month,h
lk is the peak demand distribution at instance k on the l-th day,ˆ
lk
d is the demand distribution at an instance k in RDPD on l-th day, Pl is the peak demand limit,
P(.) is a probability function, U
C is the unified demand price at any instance in a day, Cos D
t is the monthly demand cost,
Cos
dt
is the unified daily demand cost, q is the number of days in a month, withl
1,2,...,
q
.By KEPCO policy, the demand value used to evaluate demand cost is obtained using (8); thus, if the current recorded demand is greater than the Pl, the recorded demand value is used in calculating the cost. If the recorded demand is less than the Pl, the value of the Pl is used to compute the cost. This is evaluated to achieve peak demand control.
3.3. Optimization
The objective function of the stochastic optimization is formulated as the ensemble of energy cost and demand cost with contributions from PEV (13). The design optimization algorithm provides BESS control schedule candidates at each iteration of the optimization process, ev
x
E . For
each ev x
E , the ensemble of energy cost and demand cost is evaluated; this is evaluated as the
minimum of both parameters. This is repeated for each iteration of the BESS control sequences until the one with the least cost on average is found. The objective function for the stochastic optimization is formulated as (15).
( , ev)
x
EC f H E (13)
TOU 1
( , ev) min(m Cos ,Cos t )d
x k
k
f H E t
(14)arg min ( , )
ev x
ev x
E f H E (15)
3.4. Constraints
less than or equal to the maximum available energy committed by each PEV. this is evaluated by (16). ,max v ev ev i i i
E
E
(16),max
(
)
ev arv final ev
i i i i
E
SoC
SoC
BESS
(17)trg final i i
R
SoC
R
(18),
(1
)
ev ch final ev
i i i
E
SoC
BESS
(19), ev ch ch i i rated i
E
T
P
(20)where ev i
E
is the energy of the ith PEV at an instance, ev,max iE
is the maximum available energy for the ith PEV , arvi
SoC
is the arrival SoC of the ith PEV, final iSoC
is the final or minimum allowable SoC to enable a trip by EV owner to his destination after V2G service, evi
BESS
is the storage capacity of the ith PEV ,R
trgis the distance to EV owners to his destination after V2G service to the ,i
R
is the nominal distance of the ith PEV, ev ch,i
E
is the energy required to fully charge the ith PEV , ratedi
P
is the rated power of the ith PEV , ch iT
is the total time or duration to fully charge PEV at rated power.,Another constraint limits the amount of discharged energy transferred to the grid, this is dictated by the on board charger and is evaluated by (21).
,
0
ev
i k rated i
E
P
t
(21)where
t
is the time interval between two schedules. For an hour interval
t
=1.An inequality constraint is imposed on the objective function such that the departing state of charge (SOC) of each PEV at the should be the same as that at the target SOC for extra trips after V2G service (23). Furthermore, the SOC of the each PEV should be in the range of SoCmax
and SoCmin , thus maximum and minimum SOC, respectively as expressed by (23).
dpt final
i i
SoC SoC (22)
min max
,
i i k i
SoC SoC SoC (23)
, , 1
i k i k k ev i
SoC SoC e
BESS
(24)
1 , , ch dch eff eff
(25)where
SoC
i k, is the SOC at instance k of the ith PEV; dpt iSoC
and finali
SoC are the departure and final SOC of the ith PEV, respectively, min
i
SoC
and maxi
4. Case Study
This section discusses a case study on the proposed approach. The approach is implemented with recorded data and simulated for results. Data based on 2016 and 2017 from a real-site in South Korean is obtained and used as case study. The data is recorded at an interval of 15 min in a day horizon, following KEPCO’s policy of recording peak demand in 15-min intervals. The 2016 data is used for the daily interval forecast for 2017. The 2017 forecast data is used for DSM, and the observed data is used for testing and result analysis.
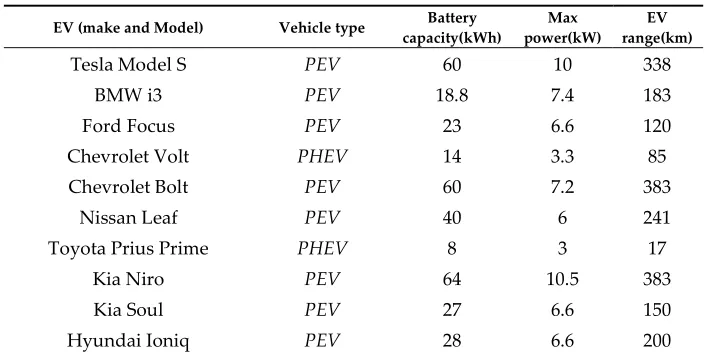
This study considers parameters of existing EV models available on the market. Table 1 details the specifications of the EVs. This study considers a total 10 PEV under the direct V2G architecture as it is suitable and easy to implement in an industrial setting, from the algorithm the PEVs contribute their capacity together to resolve peak demand. with this scheme PEV are charged and discharged via an onboard charger capable of bidirectional power transfer.
By convenience, a density forecast of 250 elements per each distribution is used. Dynamic-interval density forecast (DIDF) is performed following TOU partitions in a day horizon to obtain
Table 1: EV specifications
EV (make and Model) Vehicle type capacity(kWh) Battery power(kW) Max range(km) EV
Tesla Model S PEV 60 10 338
BMW i3 PEV 18.8 7.4 183
Ford Focus PEV 23 6.6 120
Chevrolet Volt PHEV 14 3.3 85
Chevrolet Bolt PEV 60 7.2 383
Nissan Leaf PEV 40 6 241
Toyota Prius Prime PHEV 8 3 17
Kia Niro PEV 64 10.5 383
Kia Soul PEV 27 6.6 150
Hyundai Ioniq PEV 28 6.6 200
demand probability distribution (DPD). DPD of n dimensional space is reduced to m dimensional space which is referred to as a reduced demand probability distribution (RDPD) via PPA for stochastic optimization. During the peak periods, the forecast is performed after every 15-min interval, whereas at off-peak periods, the forecast is made in the order of an hour interval, followed by 2 hours interval, 3 hours interval, etc., depending on the size of the off-peak period. Stochastic optimization is performed using RDPD as input. Particle-swarm optimization (PSO) [35] with a swarm size of 1000, inertia of 0.6, and desired accuracy of
1 10
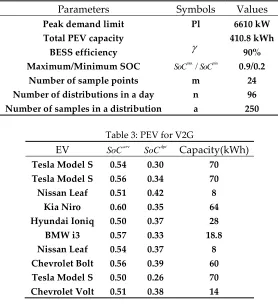
10 is used to implement the stochastic optimization procedure using the parameters in Table 2 at intervals following DIDF. EV and TOU pricing is based on tariff data from KEPCO [36]. Based on the tariff data, energy usage at different periods in a day horizon attract different charges. The changes are different depending on the time of day, the day of the week and season. Periods marked red are the peak periods which attract the highest charge per energy usage, periods marked yellow are mid-peak periods attracting a medium charge and periods marked green are off-peak periods having the lowest charge per energy use. Off-peak periods are mostly in the morning whereas peak and mid-peak periods spun the duration of late morning to evening as illustrated in Figure 5.Table 2 and Table 3 shows the parameters used for the case study. The simulation was realized in MATLAB 2016 on an Intel i5 processor with 16 GB of RAM. On average, it takes 5 minutes to complete a single run of the stochastic optimization.
Parameters Symbols Values
Peak demand limit Pl 6610 kW
Total PEV capacity 410.8 kWh
BESS efficiency
90%Maximum/Minimum SOC max min
/
SoC SoC 0.9/0.2
Number of sample points m 24
Number of distributions in a day n 96
Number of samples in a distribution a 250
Table 3: PEV for V2G
EV arv
SoC dpt
SoC Capacity(kWh)
Tesla Model S 0.54 0.30 70
Tesla Model S 0.56 0.34 70
Nissan Leaf 0.51 0.42 8
Kia Niro 0.60 0.35 64
Hyundai Ioniq 0.50 0.37 28
BMW i3 0.57 0.33 18.8
Nissan Leaf 0.54 0.37 8
Chevrolet Bolt 0.56 0.39 60
Tesla Model S 0.50 0.26 70
Chevrolet Volt 0.51 0.38 14
Figure 5. Results of 10 PEV for DMS
5. Discussion
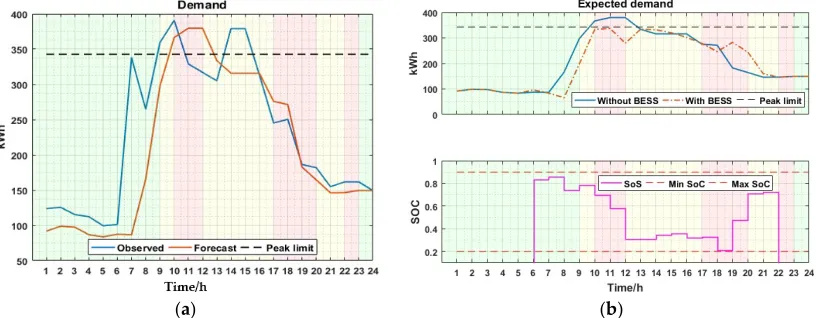
In this section the proposed demand side management algorithm using PEV is verified against a deterministic optimization (DO) method as used in most research. The deterministic approach forecasts a day ahead demand as a single out of sample forecast which is used as input to the optimization algorithm to provide a BESS schedule for the next day, as shown in Figure 5a.
(a) (b)
Figure 5. (a) Day ahead forecast and observed demand; (b) BESS schedule on forecasted demand using deterministic optimization (DO).
Figure 5b shows the forecasted demand and the effect of the subsequent PEV energy schedule that was generated from the optimization algorithm. As shown in the figure, it can be observed that the reduced peak demand follows the peak limit strictly. The peak is reduced from 1518 kW to 1370 kW, representing a 9.8% reduction, but this does not give room for forecast errors.
From Figure 6a it can be observed that when the PEV schedule obtained from the deterministic forecast is applied to the observed demand on a target day the schedule fails to reduce the peak demand due to forecast error. This causes an increase in the peak from 1563 kW to 1581 kW, representing a 1.1% increase in peak demand.
deviation in the forecast. This approach is able to reduce the peak demand from 1563 kW to 1267 1236 kW representing a 19% reduction.
(a) (b)
Figure 6. (a) BESS schedule on observed demand using DO (b) BESS schedule on observed demand using proposed approach.
6. Conclusions
This study presents a DSM algorithm that incorporates the use of PEV by resorting to a dynamic interval density forecast with a piecewise peak approximation for stochastic optimization.
A case study has been performed to verify the viability of DSM via the proposed approach using demand data from a real industrial site in South Korea. The results show that the proposed approach is effective for optimal scheduling of PEV to mitigate peak and reduce cost. Unlike the deterministic case, where the forecast is performed once in a day horizon, the proposed solution performs the forecast at set intervals in a day horizon to restore confidence in the forecast should it deviate. While incorporating PEV, the solution factors in both uncertainties in demand and mobility of EV for a robust energy schedule via dynamic interval density forecast and stochastic optimization. The proposed demand side management algorithm is compared with a deterministic algorithm; while the deterministic case achieves 9.8%, the proposed method achieves 21% in peak reduction and its more robust.
Author Contributions: S.H. conceived and supervised the work. M.A.A. designed, performed the experiments and wrote the paper, B.Y. proof read the paper.
Acknowledgments: This work was supported by Korea Electric Power Research Institute (KEPRI) belonging to Korea Electric Power Corporation (KEPCO) for the project no. R16DA01.
Conflicts of Interest: The authors declare no conflict of interest.
References
[1] L. Gelazanskas and K. A. A. Gamage, “Demand side management in smart grid: A review and proposals for future direction,” Sustain. Cities Soc., vol. 11, pp. 22–30, 2014.
[2] D. Guo and C. Zhou, “Potential performance analysis and future trend prediction of electric vehicle with V2G/V2H/V2B capability,” AIMS Energy, vol. 4, no. 2, pp. 331–346, 2016.
[3] S. Shao, M. Pipattanasomporn, and S. Rahman, “Demand response as a load shaping tool in an intelligent grid with electric vehicles,” IEEE Trans. Smart Grid, vol. 2, no. 4, pp. 624–631, 2011.
[4] H. Svahnstr, “Demand Side Management in Smart Grids,” Gouteborgs Univ., 2013.
[5] T. Logenthiran, D. Srinivasan, and K. W. M. Vanessa, “Demand side management of smart grid: Load shifting and incentives,” J. Renew. Sustain. Energy, vol. 6, no. 3, 2014.
[7] W. Liu, S. Niu, and H. Xu, “Optimal planning of battery energy storage considering reliability benefit and operation strategy in active distribution system,” J. Mod. Power Syst. Clean Energy, vol. 5, no. 2, pp. 177–186, 2017.
[8] M. Dabbagh, B. Hamdaoui, A. Rayes, and M. Guizani, “Shaving Data Center Power Demand Peaks Through Energy Storage and Workload Shifting Control,” IEEE Trans. Cloud Comput., vol. 7161, no. c, 2017.
[9] Q. Lin, M. Yin, D. Shi, and H. Qu, “Optimal Control of Battery Energy Storage System Integrated in PV Station Considering Peak Shaving,” Chinese Autom. Congr. (CAC), 2017, pp. 2750–2754, 2017.
[10] C. Lu, H. Xu, X. Pan, and J. Song, “Optimal sizing and control of battery energy storage system for peak load shaving,” Energies, vol. 7, no. 12, pp. 8396–8410, 2014.
[11] K. Cho, S. Kim, J. Kim, E. Kim, Y. Kim, and C. Cho, “Optimal ESS Scheduling considering Demand Response for Electricity Charge Minimization under Time of Use Price Key words,” no. 14, pp. 264–267, 2016.
[12] E. A. Feinberg and D. Genethliou, “Peak demand control in commercial buildings with target peak adjustment based on load forecasting,” Appl. Math. Power Syst., no. September, pp. 269–285, 2005. [13] T. X. Nghiem, M. Behl, R. Mangharam, and G. J. Pappas, “Scalable Scheduling of Building Control
Systems for Peak Demand Reduction,” Am. Control Conf., pp. 3050–3055, 2012.
[14] G. Carpinelli, S. Khormali, F. Mottola, and D. Proto, “Optimal operation of electrical energy storage systems for industrial applications,” IEEE Power Energy Soc. Gen. Meet., pp. 1–5, 2013.
[15] G. Carpinelli, G. Celli, S. Mocci, F. Mottola, F. Pilo, and D. Proto, “Optimal Integration of Distributed Energy Storage Devices in Smart Grids,” IEEE Trans. Smart Grid, vol. 4, no. 2, pp. 985–995, 2013. [16] E. Chiodo and D. Lauria, “Probabilistic description and prediction of electric peak power demand,”
Electr. Syst. Aircraft, Railw. Sh. Propulsion, ESARS, 2012.
[17] M. Rahmani-Andebili and G. K. Venayagamoorthy, “Stochastic optimization for combined economic and emission dispatch with renewables,” Proc. - 2015 IEEE Symp. Ser. Comput. Intell. SSCI 2015, pp. 1252–1258, 2015.
[18] M. Yudong, J. Matuško, and F. Borrelli, “Stochastic Model Predictive Control for Building HVAC Systems: Complexity and Conservatism,” IEEE Trans. Control Syst. Technol., vol. 23, no. 1, pp. 101–116, 2015.
[19] M. A. Acquah, K. Daisuke, and S. Han, “Real-Time Demand Side Management Algorithm Using Stochastic Optimization,” Energies, vol. 11, no. 5, p. 1166, 2018.
[20] T. G. San Román, I. Momber, M. R. Abbad, and Á. Sánchez Miralles, “Regulatory framework and business models for charging plug-in electric vehicles: Infrastructure, agents, and commercial relationships,” Energy Policy, vol. 39, no. 10, pp. 6360–6375, 2011.
[21] H. Liu, Z. Hu, Y. Song, J. Wang, S. Member, and X. Xie, “Vehicle-to-Grid Control for Supplementary,” vol. 30, no. 6, pp. 1–10, 2014.
[22] N. Z. Xu, C. Y. Chung, and S. Member, “Reliability Evaluation of Distribution Systems Including Vehicle-to-Home and Vehicle-to-Grid,” IEEE Trans. Power Syst., pp. 1–10, 2015.
[23] Y. He, B. Venkatesh, and L. Guan, “Optimal scheduling for charging and discharging of electric vehicles,” IEEE Trans. Smart Grid, vol. 3, no. 3, pp. 1095–1105, 2012.
Demand Forecast,” IEEE Trans. Ind. Informatics, vol. 14, no. 1, pp. 332–341, 2018.
[26] M. J. E. Alam, K. M. Muttaqi, and D. Sutanto, “A Controllable Local Peak-Shaving Strategy for Effective Utilization of PEV Battery Capacity for Distribution Network Support,” IEEE Trans. Ind. Appl., vol. 51, no. 3, pp. 2030–2037, 2015.
[27] Z. Wang and S. Wang, “Grid power peak shaving and valley filling using vehicle-to-grid systems,” IEEE Trans. Power Deliv., vol. 28, no. 3, pp. 1822–1829, 2013.
[28] F. Rassaei, W. S. Soh, and K. C. Chua, “Demand Response for Residential Electric Vehicles with Random Usage Patterns in Smart Grids,” IEEE Trans. Sustain. Energy, vol. 6, no. 4, pp. 1367–1376, 2015. [29] I. K. A. Aswantara, K. S. Ko, and D. K. Sung, “A dynamic point of preferred operation (PPO) scheme for
charging electric vehicles in a residential area,” 2013 Int. Conf. Connect. Veh. Expo, ICCVE 2013 - Proc., pp. 201–206, 2013.
[30] A. Rahimi et al., “A Simple and Effective Approach for Peak Load Shaving Using Battery Storage Systems,” North Am. Power Symp. (NAPS), 2013, pp. 1–5, 2013.
[31] C. L. Vg, X. Bai, W. Qiao, and S. Member, “Robust Optimization for Bidirectional Dispatch,” vol. 6, no. 4, pp. 1944–1954, 2015.
[32] P. Malysz, S. Sirouspour, and A. Emadi, “An optimal energy storage control strategy for grid-connected microgrids,” IEEE Trans. Smart Grid, vol. 5, no. 4, pp. 1785–1796, 2014.
[33] Y. Wang, B. Wang, T. Zhang, H. Nazaripouya, C. C. Chu, and R. Gadh, “Optimal energy management for Microgrid with stationary and mobile storages,” in Proceedings of the IEEE Power Engineering Society Transmission and Distribution Conference, 2016.
[34] A. Shapiro and A. Ruszczynski, “Lectures on stochastic programming modeling and theory library of Congress Cataloging-in-Publication Data.”
[35] R. Hassan and B. Cohanim, “A comparison of particle swarm optimization and the genetic algorithm,” 1st AIAA Multidiscip. Des. Optim. Spec. Conf., pp. 1–13, 2005.
[36] S. June and S. Mar, “Korea Electric Power Corporation Tariff,” 2013. Available online: https://cyber.kepco.co.kr/ kepco/EN/F/htmlView/ENFBHP00101.do?menuCd=EN060201. (accessed on 3 April 2018)