Volume 35, 2011
138
EFFECT OF TRACK POSITION ON
STUDENTS’ ATTITUDE TOWARDS
SCIENCE
Chin Sook Fui, Lim Hooi Lian University Sains Malaysia, Penang, Malaysia E-mail: [email protected], [email protected]
Abstract
Attitude towards science (ATS) is major concern in science education due to its positive correlation with students’ science achievement. However, previous studies showed that students’ ATS is decreasing in many countries. Although many attempts have been taken to solve this problem, little consideration has been given to the effect of track position and students’ ATS. While cognitive aspect plays major role in tracking, affective aspect such as ATS is overlooked. It might be one of the factors that contributing to the decrease of students’ ATS. Accordingly, this paper aimed to investigate the effect of tracking on students’ ATS. A total of 450 science stream students and 299 arts stream students were involved in this study. The findings showed that among science stream students, 21 students (4.67%) prefer arts stream rather than science stream. Their ATS level is statistically significant lower than science stream students who prefer science stream and the effect size is large (Cohen’s d = 1.1028). Meanwhile, among arts stream students, 47 students (15.7%) prefer science stream rather than arts stream. Although their ATS level is higher than arts stream students who prefer arts stream, the difference is not statistically significant, with negative and small effect size (Cohen’s d = -.2271). The findings of this study would bear significant implication to enhance awareness of public and educators about the important of ATS in tracking. Moreover, this study would provides useful information for stakeholders in determining students’ stream.
Key words: affective, attitude towards science, science education, tracking.
Introduction
attitude towards science (ats) is major concern in science education due to its positive correlation with students’ science achievement (osborne, simon, & collins, 2003; Wang & berlin, 2010; Zhang & campbell, 2010). positive ats drives students into the field of science and gives them the motivation to fulfill their ambitions. in turn, it contributes to the technological development of a country and enables our society to continue to thrive (hassan, 2008). however, previous studies showed that students’ ats is decreasing in many countries (George, 2000; hassan, 2008; Kamisah, Zanaton, & lilia, 2007; Zanaton & lilia, 2007). although many attempts have been taken to solve this problem, little consideration has been given to the common educational stratification on students’ ats, which is tracking.
in the 21 century Volume 35, 2011 139 2007). in the other words, cognitive aspect is the only factor in determining students’ stream and affective aspect is overlooked.
however, hopkins (1998) pointed out that the objectives for all courses involve attitudes, appreciation, and interest, as well as knowledge and proficiencies. in the other words, to achieve learning objectives, both affective domain and cognitive domain should be taken into account. We should not emphasize on students’ academic achievement solely but also should pay attention on students’ feeling, emotions, attitudes or values such as ats. hence, this study aimed to investigate the effect of tracking on students’ ats.
Problems of Research
recently, the number of students studying in science and students’ ats are decreasing (George, 2000; hassan, 2008; Kamisah, Zanaton, & lilia, 2007; Zanaton, & lilia, 2007). Kamisah, Zanaton, and lilia (2007) reported that marginalization of science among students is a serious problem in malaysia especially in upper secondary schools. meanwhile, Zanaton and lilia (2007) denoted that the decrease of students’ involvement in science at secondary schools and universities is a worrying phenomenon. this is a serious problem not only for science education but also for the country itself. science education nurtures future scientist and science-related professionals (hassan, 2008; osborne, simon, & collins, 2003). hence, if the number of students studying in science and students’ ats decrease seriously, shortage of science-related manpower will occur. in turn, this will cause negative effect on a country’s innovation economy (hassan, 2008). therefore, many attempts were taken to investigate factors that contributing to the decreasing of students’ ats (osborne, collins, & simons, 2007. however, effect of tracking on students’ ats is still unclear.
tracking is a common educational practice in malaysia. despite the positive correlation between students’ ats and science achievement, most the schools do practice it based on students’ academic achievement (prihadi, 2009). in other words, cognitive aspect (academic achievement) plays an important role in grouping students into different streams but affective aspect (ats) plays little role or none at all. it is problematic because affective aspect is as important as cognitive aspect. according to piaget (1976), cognitive and affective aspects are distinct but they are not separable and not reducible. in addition, learning objectives involves attitude (hopkins, 1998). in the other words, to achieve learning objectives in science education, students’ ats should be taken into account in tracking. hence, tracking practices that group students entirely based on academic performance could be problematic. in line with the problems, it is very important to investigate the effect of tracking on students’ ats.
Research Focus Attitude towards Science (ATS)
attitude is a unique concept that integrates multiple properties and has different domains. due to its complexness, the definition of attitude itself has been one of the problems in ats related studies (francis & Greer, 1999; Kind, Jones, & barmby, 2007; osborne, simon, & collins, 2003). in general, attitude can be divided into three components: cognitive (knowledge about an object), affective (feeling about an object), and behavioral (tendency to take action on an object) (reid, 2006). sax (1997) defined attitude as a preference for an object. it is supported by oluwatelure and oloruntegbe (2010); and salta and tzougraki (2004) that attitude is a tendency to think, feel or act toward objects in our surrounding, that can be positive or negative. besides, Kind, Jones, & barmby (2007) defined attitude as thefeelings that a person has about an object, based on their beliefs about the object (p. 873).
Volume 35, 2011
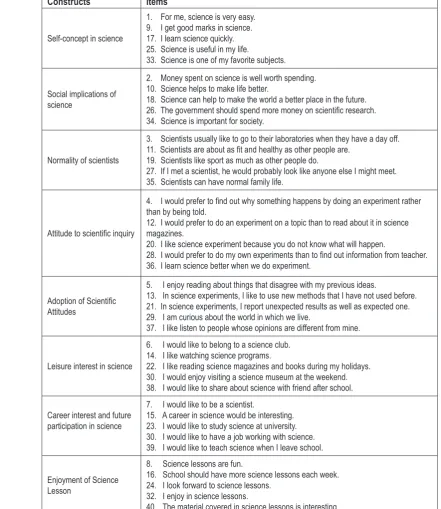
140 science education, ats could refer to science as a subject (George, 2003). coll, dalgety and salter (2002) defined ats as something to do with what we think of science. on the other hand, osborne, simon, and collins (2003) had proposed that ats consists of some dimensions, such as: the perception of the science teacher, anxiety toward science, the value of science, self-esteem at science, motivation towards science, enjoyment of science, attitudes of peers and friends towards science, attitudes of parents towards science, the nature of the classroom environment, achievement in science, and fear of failure on course. besides, Kind, Jones, and barmby (2007) defined ats as a way of mapping students’ cognitive and emotional opinions about various dimensions of science. they divided ats into seven distinct constructs: (1) learning science in school, (2) practical Work in science (2), (3) science outside of school, (4) importance of science, (5) self-concept in science (5), (6) future participation in science (6), and (7) combined interest in science. in the context of this study, ats is defined as: the tendency of thinking, feelings, and action that a person has about science, based on their belief and preference about science that can be positive or negative, which consists of eight constructs: self-concept in science; social implications of science; normality of scientists; attitude to scientific inquiry; adoption to scientific attitudes; leisure interest in science; career interest and future participation in science; enjoyment of science lesson.
in previous studies, it was found that ats has positive correlation with science achievement (osborne, simon & collins, 2003; simpson & oliver, 1990; Zhang & campbell, 2010). moreover, farenga and Joyce (1998) found that ats is an important predictor of the amount of science course selected by students. besides, many factors can affect students’ ats, such as instructional activities (siegel & ranney, 2003), live stimulation (chen & howard, 2010), parental involvement (oluwatelure & oloruntegbe, 2010), type of school (ong & ruthven, 2009), gender (tan, 2007), collaborative science intervention (hong, 2010), information and communication technology (park, Khan & petrina, 2009), and personality traits (hong & lin, 2011). moreover, cokadar and Kulce (2008) found that pupils’ ats changes with regard to their perception of self-achievement and pupils with higher enjoyment in science classes were having more positive ats. this is in line with the study by olive & Venville (2011) that among students who generally had positive ats, most of them selected science as one of their favorite subject. from the above-mentioned previous studies, the effect of tracking on students’ ats is not found. this explains the novelty of this study.
Tracking
in the 21 century Volume 35, 2011 141 2002). the only significant differences of various tracking in different countries are the timing, procedures and scope of the stratification (lynch & baker, 2005).
in the study conducted by Gamoran (1992), it showed that schools with more mobility in their tracking systems have higher achievement overall than schools with more rigid tracking systems. furthermore, duflo, dupas, and Kremer (2008) found that students in tracking schools scored higher achievement in non-tracking schools. however, some researches found that tracking caused negative effects on students especially for low academic achievers. it is because tracking reduces the positive peer effect on low ability and average ability students (Zimmer, 2003). furthermore, steven and Vermeersch (2010) found that teachers have lower expectations of students in lower education streams. this is in line with the study by turner (2007) that tracking has advantage but it sends unfortunate message to students in the lower track. in addition, carbonaro (2005) found that students in higher track spent more efforts in learning than students in lower track. besides, forgasz (2010) fond that most of the teachers supported tracking practice in their schools. but he pointed out one of the limitations in tracking, which is the effect of placement errors. in general, previous studies showed that tracking with high mobility is better than rigid tracking practice. however, placement errors in tracking should be concerned. in addition, tracking transmits negative message to students in the lower track (arts stream), and teachers have lower expectation of students in lower track.
Methodology of Research
General Background of Research
in this study, researcher had decided to apply survey approachby using pencil and paper questionnaire because the purposes of this study are going to see the ats level and differences between variables in an existing phenomenon without manipulating any variables. on the other hand, large sample size can be involved easily and administrated in a short period by applying the survey method. data was collected only once involving the administration of the adapted ats measure to group of respondents.
Sample of Research
this study was conducted in penang, malaysia. nine secondary schools were chosen based on purposive sampling technique. the participants consisted of 450 form four science stream students and 299 form four arts stream students (Grade 10 in united states; age 16 or 17). on the other hand, students’ track positions were indicated by their self-report about their position in tracking: assigned to a track or choose their own track. for science stream students, they were grouped into Group 1 (science stream students who prefer science stream; choose own track), and Group 2 (science stream students who prefer arts stream; assigned to track). meanwhile, arts stream students were grouped into Group 3 (arts streams students who prefer arts stream; choose own track), and Group 4 (arts stream students who prefer science stream).
Instrument and Procedures
Volume 35, 2011
142 Table 1: Constructs in ATST and relative items.
Constructs Items
Self-concept in science
1. For me, science is very easy. 9. I get good marks in science. 17. I learn science quickly. 25. Science is useful in my life.
33. Science is one of my favorite subjects.
Social implications of science
2. Money spent on science is well worth spending. 10. Science helps to make life better.
18. Science can help to make the world a better place in the future.
26. The government should spend more money on scientific research.
34. Science is important for society.
Normality of scientists
3. Scientists usually like to go to their laboratories when they have a day off.
11. Scientists are about as fit and healthy as other people are.
19. Scientists like sport as much as other people do.
27. If I met a scientist, he would probably look like anyone else I might meet. 35. Scientists can have normal family life.
Attitude to scientific inquiry
4. I would prefer to find out why something happens by doing an experiment rather
than by being told.
12. I would prefer to do an experiment on a topic than to read about it in science
magazines.
20. I like science experiment because you do not know what will happen.
28. I would prefer to do my own experiments than to find out information from teacher. 36. I learn science better when we do experiment.
Adoption of Scientific
Attitudes
5. I enjoy reading about things that disagree with my previous ideas.
13. In science experiments, I like to use new methods that I have not used before. 21. In science experiments, I report unexpected results as well as expected one.
29. I am curious about the world in which we live.
37. I like listen to people whose opinions are different from mine.
Leisure interest in science
6. I would like to belong to a science club. 14. I like watching science programs.
22. I like reading science magazines and books during my holidays. 30. I would enjoy visiting a science museum at the weekend. 38. I would like to share about science with friend after school.
Career interest and future participation in science
7. I would like to be a scientist.
15. A career in science would be interesting. 23. I would like to study science at university. 30. I would like to have a job working with science. 39. I would like to teach science when I leave school.
Enjoyment of Science Lesson
8. Science lessons are fun.
16. School should have more science lessons each week. 24. I look forward to science lessons.
32. I enjoy in science lessons.
40. The material covered in science lessons is interesting.
Data Analysis
in the 21 century Volume 35, 2011 143
Results of Research
Science Stream Students
table 2 shows the ats mean score for science stream students. the mean score of Group 1 (science stream students who prefer science stream) is 3.6683 and the mean score of Group 2 (science stream students who prefer arts stream) is 3.1429. the mean difference is 0.5254.
Table 2. ATS mean score for science stream students.
Track Position* N Mean Std. Deviation Std. Error Mean
Science Stream 1 429 3.6683 0.50003 0.02414
2 21 3.1429 0.45160 0.09855
*Track Position: 1= Choose own track; 2= Assigned to track
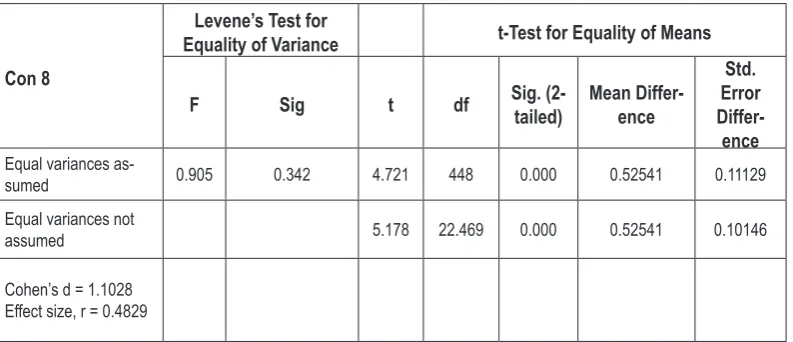
to determine whether the difference is significant or not, t-test analysis was carried out as shown in table 2.
Table 3. T-test output for science stream students.
Con 8
Levene’s Test for
Equality of Variance t-Test for Equality of Means
F Sig t df Sig. (2-tailed) Mean Differ-ence
Std. Error Differ-ence
Equal variances
as-sumed 0.905 0.342 4.721 448 0.000 0.52541 0.11129
Equal variances not
assumed 5.178 22.469 0.000 0.52541 0.10146
Cohen’s d = 1.1028 Effect size, r = 0.4829
based on levene’s test for equality Variances, p = 0.342 in which greater than 0.05. it means that the variances are equal, t = 4.721 is used to test the equality of the means. the degrees of freedom (df) = 448. meanwhile, the significance value, p = 0.000 in which less than 0.05. therefore, it can be concluded that there is a significant difference between Group 1 and Group 2. moreover, cohen’s d = 1.1028 indicates large effect size, in which the mean of the Group 1 is at the 86th percentile of the Group 2. moreover, there is 58.9% of nonoverlap between the distribution of scores for Group 1 and Group 2.
Arts Stream Students
Volume 35, 2011
144 Table 4. ATS mean score for arts stream students.
Track Position* N Mean Std. Deviation Std. Error Mean
Art Stream 3 252 3.2389 0.58243 0.03669
4 47 3.3762 0.62599 0.09131
*Track Position: 3= Choose own track; 4= Assigned to track
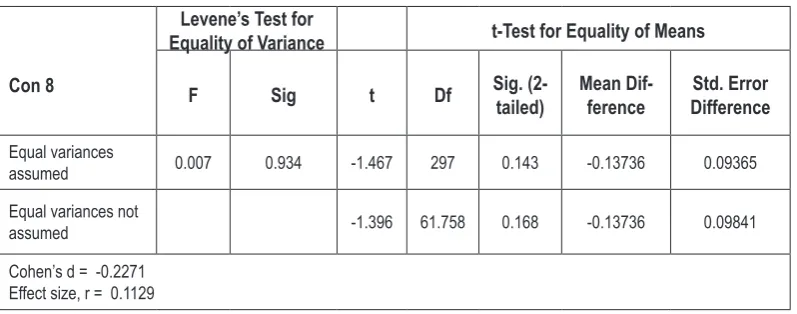
to determine whether the difference is significant or not, t-test analysis was carried out as shown in table 5.
Table 5. t-test Output for arts stream students.
Con 8
Levene’s Test for
Equality of Variance t-Test for Equality of Means
F Sig t Df Sig. (2-tailed) Mean Dif-ference DifferenceStd. Error
Equal variances
assumed 0.007 0.934 -1.467 297 0.143 -0.13736 0.09365
Equal variances not
assumed -1.396 61.758 0.168 -0.13736 0.09841
Cohen’s d = -0.2271 Effect size, r = 0.1129
based on levene’s test for equality Variances, p = 0.934 in which greater than 0.05. it means that the variances are equal, t = -1.467 is used to test the equality of the means. the degrees of freedom (df) = 297. meanwhile, the significance value, p = 0.143 in which greater than 0.05. therefore, it can be concluded that there is no significant difference between Group 3 and Group 4. cohen’s d = -0.2271 indicates small effect size, in which the mean of the Group 4 is at the 58th percentile of the Group 3. moreover, there is 14.7% of nonoverlap between the distribution of scores for Group 3 and Group 4.
Discussion
the findings of this study showed that there is effect of tracking on science stream students’ ats but not for arts stream students. Group 1 students (science stream students whoGroup 1 students (science stream students who prefer science stream; choose own track) are having significantly lower ats than Group are having significantly lower ats than GroupGroup 2 students (science stream students who prefer art stream: assigned to track). meanwhile,. meanwhile,meanwhile, there is no significant difference of ats among Group 4 students (arts stream students who prefer science stream; assigned to track) students and with Group 3 students (arts stream students who prefer arts stream; choose own track). previous studies that these findings could be directly compared are not found. this explains the novelty of this study.
in the 21 century Volume 35, 2011 145 enjoy in science learning. findings by olive and Venville (2011) showed that students who like science subject are having more positive ats. since Group 2 students prefer arts stream, it is reasonable that science is not their favorite subject. thus, they might not enjoy in science learning compared with Group 1 students. as a result, they are having lower ats. as supported by cokadar and Kulce (2008) that pupils with higher enjoyment in science classes are having more positive ats.
besides, although Group 4 students obtained slighly higher ats mean score than Goup 3 students, there is no statistically difference of ats between Group 3 students and Group 4 students. this might due to the negative effect of tracking on low academic achievers. it is in line with the findings by duflo, dupas & Kremer (2008) that tracking caused negative effect on students especially low academic achievers. it is supported by the study by turmer (2007) that tracking sends unfortunate message to students in to lower track. furthermore, teachers are having low expectation of arts stream students as reported by steven and Vermeersch (2010). these factors might override the effect of track position on arts stream students. thus, even though Group 4 students prefer science stream, but their ats is not statistically significant difference with Group 3 students.
Conclusions
this study aimed to investigate the effect of tracking on students’ ats. findings of this study showed that there is effect of track position on ats for science stream students but not for arts stream students. science stream students who are assigned to track (prefer arts stream) are having statistically significant lower ats compared with science stream students who choose own track (prefer science stream). however, arts stream students who are assigned to track (prefer science stream) did not show statistically significant difference of ats compared with arts stream students who choose own track (prefer arts stream). it is due to the override of other negative effects of tracking on arts stream students. Without deny the important of cognitive aspect or academic performance in tracking, the findings of this study suggest that students’ ats should be taken into account especially for science stream students (high academic achievers). this information might enhance the awareness of public and educators about the important of considering ats as factor in determining students’ stream other than students’ previous academic achievement. moreover, this study would provides useful information for stakeholders in determining students’ stream. in turn, it might contribute to the improvement of students’ ats and decrease placement error during tracking.
Acknowledgements
the authors would like to acknowledge the universiti sains malaysia (usm) for the supporting towards the publication of this paper through usm fellowship.
References
ahmad nurulazam, m. Z., rohandi, & azman, J. (2010). instructional congruence to improve malaysian students’ attitudes and interests toward science in low performing secondary schools. European Journal of Social Sciences, 13(1), 89-100.
Volume 35, 2011
146 callahan, r. m. (2005). tracking and high school english learners: limiting opportunity to learn. American Educational Research Journal, 42(2), 305-328.
carbonaro, W. (2005). tracking, students’ effort and academic achievement. Sociology of Education, 78(1), 27-49.
chen, c. h., & howard, b. (2010). effect of live simulation on middle school students’ attitudes and learning toward science. Educational Technology & Society, 13(1), 133-139.
cokadar, h., & Kulce, c. (2008). pupils’ attitude towards science: a case of turkey. World Applied Science Journal, 3(1), 102-109.
coll, r. K., dalgety, J., & salter, d. (2002). the development of the chemistry attitudes and experiences Questionnaire (caeQ). Chemistry Education: Research and Practice in Europe, 3(1), 19-32.
danzi, J., reul, K., & smith, r. (2008). Improving Student Motivation in Mixed Ability Classrooms Using Differentiated Instruction. unpublished master dissertation. saint Xavier university.
duflo, e., dupas, p., Kremer, m., & national bureau of economic, r. (2008). peer effects and the impact of tracking: evidence from a randomized evaluation in Kenya. nber Working paper no. 14475. National Bureau of Economic Research, retrieved from ebscohost.
farenga, s. J., & Joyce, b. a. (1998). science-related attitudes and science course selection: a study of high-ability boys and Girls. Roeper Review, 20(4), 247-251.
forgasz, h. (2010). streaming for mathematics in Victorian secondary schools. Australian Mathematics Teacher, 66(1), 31-40.
francis, l. J., & Greer, J. e. (1999). measuring attitude towards science among secondary school students: the affective domain. Research in Science & Technological Education, 17(2), 219-226.
fraser, b. J. (1981). Test of Science-Related Attiudes Handbook (TOSRA). melbourne: australia: the australian council for educational research.
Gamoran, a., nystrand, m., berends, m., & lepore, p. c. (1995). an organizational analysis of the effects of ability Grouping. American Educational Research Journal,32(4), 687-715.
George, r. (2003). Growth in students’ attitudes about the utility of science over the middle and high school years: evidence from the longitudinal study of american youth. Journal of Science Education and Technology, 12(4), 439-448.
George, r. (2000). measuring change in students’ attitudes towards science over time: an application of latent Variable Growth modeling. Journal of Science Education and Technology, 9(3), 217-225.
Green, a. (1997). Education, Globalization and the Nation State. basingstoke: macmillan.
hallam, s., & ireson, J. (2003). secondary school teachers’ attiude towards and beliefs about abilit Grouping. British Journal of Educational Psychology, 73, 343-356.
hassan, G. (2008). attitudes toward science among australian tertiary and secondary school students. Research in Science & Technological Education, 26(2), 129-147.
hong, Z.-r. (2010). effects of a collaborative science intervention on high achieving students’ learning anxiety and attitudes toward science. International Journal of Science Education, 32(15), 1971-1988.
in the 21 century Volume 35, 2011 147 hopkins, K. d. (1998). Educational and Psychological Measurement and Evaluation (8th ed.). united states of america: allyn & bacon.
houtte, m. V., & steven, p. a. (2009). study involvement of academic and Vocational students: does between-school tracking sharpen the difference? American Educational Research Journal, 46(4), 943-973.
Kamisah, o., Zanaton, h. i., & lilia, h. (2007). sikap terhadap sains dan sikap saintifik di Kalangan pelajar sains. Jurnal Pendidikan, 32, 39-60.
Kind, p. m., Jones, K., & barmby, p. (2007). developing attitudes towards science measures. International Journal of Science Education, 29(7), 871-893.
Kulik, J. a. (1992). An Analysis of the Research on Ability Grouping: Historical and Contemporary Perspectives (RBDM 9204). storrs, ct: the national research center on the Gifted and talented, university of connecticut.
letendre, G. K., hofer, b. K., & shimizu, h. (2003). What is tracking? cultural expectations in the united states, Germany, and Japan. American Educational Research Journal, 40(1), 43-89.
lucas, s. r. (1999). Tracking Inequality: Stratification and Mobility in American High Schools. new york: teachers college press.
lynch, d. r., russell, J. s., evans, J. c., & sutterer, K. G. (2009). beyond the cognitive: the affective domain, Values, and the achievement of the Vision. Journal of Professional Issues in Engineering Education & Practice, 135(1), 47-56.
oliver, m., & Venville, G. (2011). an exploratory case study of olympiad students’ attitudes towards and passion for science. International Journal of Science Education, first published on: 21 april 2011 (ifirst).
oluwatelure, t. a., & oloruntegbe, K. o. (2010). review: effects of parental involvement on students’ attitude and performance in science. Journal of Microbiology Research, 4(1), 1-9.
ong, e. t., & ruthven, K. (2009). the effectiveness of smart schooling on students’ attitude towards science. Eurasia Journal of Mathematics, Science & Technology Education, 5(1), 35-45.
osborne, J., simon, s., & collins, s. (2003). attitudes towards science: a review of the literature and its implications. International Journal of Science Education, 25(9), 1049-1079.
park, h., Khan, s., & petrina, s. (2009). ict in science education: a quasi-experimental study of achievement, attitudes toward science, and career aspirations of Korean middle school students. International Journal of Science Education, 31(8), 993-1012.
piaget, J. (1976). the affective unconscious and the cognitive unconscious. in b. inhelder, & h. h. chipman, Piaget and His School (p. 71). new york: springer.
prihadi, K., hairul, n. i., & hazri, J. (2009). students’ self-esteem and their perceptions of teacher behavior: a study of between-class ability Grouping. Electronic Journal of Research in Educational Psychology, 8(2), 707-724.
reid, n. (2006). thoughts on attitude measurement. Research in Science & Technological Education, 24(1), 3-27.
Volume 35, 2011 148
sax, G. (1997). Principles of Educational and Psychological Measurement and Evaluation. united states of america: Wadsworth publishing company.
siegel, m. a., & ranney, m. a. (2003). developing the changes in attitude about the relevance science Questionnaire and assessing two high school science classes. Journal of Research in Science Teaching, 40(8), 757-775.
simpson, r. d., & oliver, J. s. (1990). a summary of major influences on attitude toward and achievement in science among adolescent students. Science Education, 74(1), 1-18.
slavin, r. e. (1987). ability Grouping and student achievement in elementary schools. Review of Educational Research, 57, 293-336.
steven, p. a., & Vermeersch, h. (2010). streaming in flemish secondary schools: exploring teachers’ perceptions of and adaptations to students in different streams. Oxford Review of Education, 36(3), 267-284.
tan, y. s. (2007). attitudes and achievement orientations of students towards learning of science and mathematics in english. Kajian Malaysia, 25(1), 15-39.
turner, p. (2007). reflections on numeracy and streaming in mathematics education. Australian Mathematics Teacher, 63(2), 28-33.
Wang, t. l., & berlin, d. (2010). construction and Validation of an instrument to measure taiwanese elementary students’ attitude towards their science class. International Journal of Science Education, 32(18), 2413-2428.
yonezawa, s., Wells, a. s., & serna, i. (2002). choosing tracks:’’freedom of choice’’ in detracking schools. American Educational Research Journal, 39(1), 37-67.
Zanaton, h. i., lilia, h., & Kamisah, o. (2006). sikap terhadap sains dalam Kalangan pelajar sains di peringkat menengah dan matrikulasi. Pertanika Journal of Sociology, Science & Humanity, 14(2), 134-147.
Zhang, d., & campbell, t. (2010). the psychometric evaluation of a three-dimension elementary science attitude survey. Journal of Science Teacher Education, advance online publication.
Zimmer, r. (2003). a new twist in the educational tracking debate. Economics of Education Review, 22(3), 307-315.
Advised by Laima Railienė, University of Siauliai, Lithuania
received: September 05, 2011 accepted: September 28, 2011
Chin Sook Fui Education with Science (BA), Master Research Fellow, School of Educational Stud-ies, Universiti Sains Malaysia, 11800 Gelugor, Penang, Malaysia.
E-mail: [email protected]