Forestry & Natural-Resource Sciences Last Correction: Apr. 10, 2018
AN ASSESSMENT OF INVASIVE PLANTS ON SHORTER
UNIVERSITY’S CAMPUS
Madelyn Anderson
1, Michael K Crosby
21
Department of Forestry, Mississippi State University, Mississippi State, MS 39762 USA
2
School or Agricultural Sciences and Forestry, Louisiana Tech University, P.O. Box 10138, Ruston, LA 71272 USA
Abstract.Invasive plant species have various negative impacts on the ecosystems they invade. Studies have shown that invasive species decrease species diversity, cause economic loss, and reduce forest health and productivity. A study was designed to determine the presence of invasive plant species on Shorter University’s campus in Rome, GA, using 50 (1 m x 1 m) randomly allocated plots. From the initial assessment, it was determined that invasive plants are most prevalent along the forest edge, extending into the forest. Therefore, a forest edge study, consisting of 25 (1 m x 1 m) plots, was developed to assess the effects of invasive plants within the forest edge. Plants were identified to the species level and percent cover was estimated for the plots. Simpson’s Diversity Index was calculated to assess plant diversity in the forest edge. The study indicated that as the percent cover of invasive plants increased, so did the diversity of the plot. While native plant species diversity did decline, overall diversity increased because of the high density of invasive plants in the forest edge. The invasive plant species identified in this study included, Chinese privet (Ligustrum sinense), tree of heaven (Ailanthus altissima), English ivy (Hedera helix), wisteria (Wisteria sinensis), Asiatic Jasmine (Trachelospermum asiaticum), nandina (Nandina domestica), mimosa (Albizia julibrissin), lespedeza (Lespedeza cuneate), and kudzu (Pueraria montana). These invasive species will continue to degrade the ecosystem through their rapid spread, necessitating the need to develop strategies for effective management on Shorter University’s campus.
Keywords: Simpson’s Diversity Index; management; diversity; forest edge;
1
Introduction
Invasive plant species are a major concern in the forests of the southeastern United States. The south-east is particularly susceptible to invasion due to this area being surrounded by ports where the initial intro-duction can occur, including Mobile, AL, Savanna, GA, Miami, FL, New Orleans, LA and Charleston, SC. Inva-sive plants can be introduced purposefully as a source of food, for erosion control, as ornamentals, for fuel, forage, or lumber, or for medicinal reasons (Pauchard and Shea 2006). However, invasive plants can also be introduced accidentally. For example, cogongrass (Imperata cylin-drica) was used as a packing material in international shipping (Dickens 1974). Through the ports and trans-portation of these crates inland, cogongrass escaped and started its spread. Invasive plant species are so success-ful in their spread due to their lacking natural competi-tor, which means they do not have natural controls like native plants. Also, they invade previously disturbed areas that do not have a strong defense against invasion
(i.e., naturally occurring species);therefore, there is less competition for resources such as water, light, carbon dioxide, and space (Miller et al. 2002). These species of plants have negative impacts on the ecosystems they in-vade, which is why it is important to study their impacts and spread.
In the recent past, global commerce has increased in speed and increased in distance around the world (Theo-harides and Dukes 2007). As a result, the spread of in-vasive plants has also increased, exacerbating their neg-ative impacts. The negneg-ative impacts include, but are not limited to, upsetting ecosystems, competing with na-tive species, and causing economic loss (Devine and Fei 2011, Theoharides and Dukes 2007). In order for inva-sive plants to be successful, they must displace the native plant species, which decreases species diversity, upset-ting the ecosystem. Economically, invasive plant species cause $120 billion (US dollars) in losses and damage an-nually due to the negative impacts of their invasion in the United States (Olson 2006, Pimentel et al. 2005).
the surrounding area, or it may need to be cut down, which can be costly. These potential negative impacts are the reason for this study.
This study assesses the presence and diversity of inva-sive species impacting Shorter University’s campus. In previous studies, the more diverse the native area is, the more resistant it is to invasion (Theoharides and Dukes 2007). The purpose of assessing the presence and diver-sity of invasive plants on campus was to help in identify-ing the extent of invasion so that a management strategy could be formulated. In this study, the forest edge effect is important to consider. Because the forest edge is the point of entry and an area of increased resource avail-ability it is where invasion is most prominent (McDonald and Urban 2006). In order to assess the data collected in this study, the Simpson’s Diversity Index was calcu-lated. Simpson’s Diversity Index (D) measures biodiver-sity and takes into account both richness and evenness. The invasive plants will continue to thrive in the edge of forests if not managed, which emphasizes how critical it is to minimize the impacts of these species (Yates et al. 2004).
2
Methods
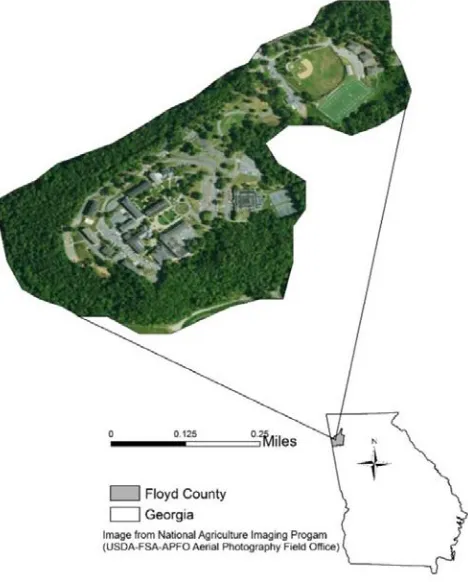
Using Geographical Information System, ArcMap 10.2, a digitized map of Shorter University’s campus was created and boundaries were generated. The cre-ation of the boundary was guided by the walking trail that surrounds the campus. In total, there was 138 acres included in the study area (Figure 1).
To begin the study of invasive plants on campus, 50 randomly allocated plots were selected as a test sample (Figure 2). The plot size was 1 m x 1 m and in each plot, the presence or absence of invasive plants was identified and recorded (Miller et al. 2010). The majority of the invasive plants were found along the forest edge, there-fore, attention was focused on the forest edge.
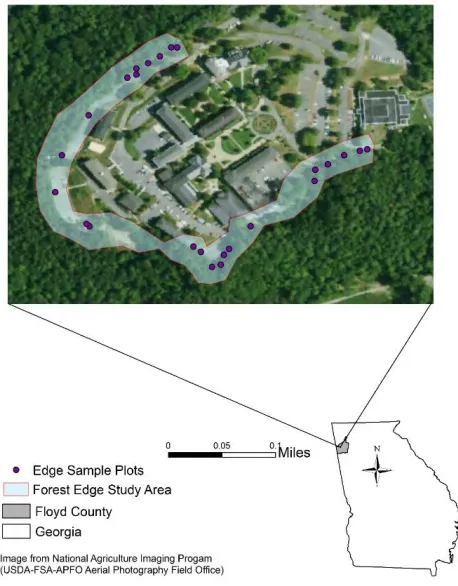
Invasive plants were surveyed along the forest edge (one meter from the edge of the boundary of the park-ing lot or sidewalk) of the main campus (Figure 3), to determine the likelihood of invasive species presence. Twenty-five additional plot locations were randomly se-lected. Within each plot, every plant was identified to the species level; due to the small plot size, locations with tree DBH greater than five inches were excluded if found within a plot. Then, percent cover of each
Figure 1: Map of the study area depicting the campus of Shorter University.
plant species (native and invasive) was determined for the plots.
Once the data was collected for the second methods section on the forest edge, Simpson’s Diversity Index was calculated using the following formula (after Morris et al. 2014):
D= 1−X n N
2
(1)
where:
n= the percent cover of a species; and
N = the total percent cover.
3
Results
Figure 2: Location of 50 randomly allocated plots used to identify presence or absence of invasive plants.
list of the most invasive plants of the southeast United States (Georgia Forestry Commission 2015).
Of the 50 plots assessed in the first portion of the study, 18 were identified as having the presence of one or more invasive plant (Figure 4). Hence, the probability of finding an invasive plant on the entire campus based on the sample was 36%. Through observation, many of the plots that did not have any invasive plants were either further in the forest and/or on a steep slope.
Out of the 25 plots surveyed in the forest edge section of the study, there were only three that were void of any invasive plants. Thus, the probability of finding an invasive plant on the forest edge based on the 25 plots surveyed was 88%. Many plots had multiple species of invasive plants as well. In addition, Chinese privet was found throughout the forest edge, which is why it was found to be the most abundant invasive plant in the forest edge followed by Asiatic jasmine, wisteria, English ivy, nandina, mimosa, and tree of heaven, respectively (Table 1).
After calculation of the Simpson’s Diversity Index of the native species only, a comparison of this value against the percent covers of invasive species showed a correlation between percent cover and native plant
di-Figure 3: Location of 25 plots surveyed to assess invasive plants present in the forest edge.
versity (Oswalt et al. 2007). The correlation coefficient (r) was –0.775, demonstrating that as the percent cover of invasive plants increased, the diversity of the native plants decreased (Figure 5). Another comparison was made between the percent cover of invasive plants on each plot and the Simpson’s Diversity Index of all the species in the plot, both native and invasive. The cor-relation coefficient (r) was 0.252, which shows that as the percent cover of invasive plants increased, so did the diversity of the plot (Figure 6).
Table 1: The occurrence of invasive plant species on forest edge plots.
Species Number of Plots % of plots
Chinese privet 14 56
Asiatic jasmine 9 36
Wisteria 7 28
English ivy 6 24
Nandina 5 20
Mimosa 1 4
Figure 4: Distribution of the 50 plots assessed for pres-ence/absence of invasive plants.
4
Discussion
Out of the nine invasive plant species identified on campus, everything but mimosa and tree of heaven were likely planted as landscaping near the buildings. During the study, it was observed that nandina was planted as landscaping outside the dorms, even though it is an inva-sive plant. The landscaping crew planted nandina solely based on aesthetics of the plant, and were likely unaware of the invasiveness of this particular species. The same mistake likely occurs all over the United States, necessi-tating education regarding invasive species.
In the beginning of the study, the 50 plots assessed for presence or absence of invasive plants had an observed tendency. Many of the plots that did not have any in-vasive plants were either further in the forest and/or on a steep slope. The plots further into the forest were inclined to have less presence of invasive plants due to the forest edge effect. The forest edge effect caused the plots near the forest edge to have a greater likelihood of having the presence of invasive plants. The reason plots on the steep slopes of campus did not have any invasive plants may have been due to seeds of the invasive plants not being able to establish on the slope because of
wa-Figure 5: Percent cover of invasive species vs. Simpson’s Diversity Index of native species only.
Figure 6: Scatter plot of percent cover of invasive plants on each plot vs Simpson’s Diversity Index of all the species.
ter washing them away or gravity carrying them further down to low elevation near Horseleg Creek.
In the forest edge part of the study, Chinese privet was found throughout the forest edge. It was found on every side of campus and was the most abundant inva-sive plant on campus. The cause of the major popu-lation of Chinese privet was hypothesized to be the re-sult of maintenance trimming the Chinese privet plants and spreading them while trimmings were in transport. Because Chinese privet can regenerate from trimmings, when the maintenance staff was transporting and pil-ing up the trimmpil-ings, they regenerated into more plants (Urbatsch 2002), exacerbating its spread. Hanula et al. (2009) found Chinese privet is best managed through mulching and hand felling, followed by the application of herbicide. In the construction of a management plan, Chinese privet should be managed with the utmost pri-ority because it is the most invasive and aggressive on campus (Yates et al.2004) and will continue its spread into the forest understory.
Theo-harides and Dukes 2007). Hence, when the comparison was made between the percent cover of invasive plants and the Simpson’s Diversity Index of the native species only, everything was as expected; as percent cover in-creased, diversity of the native plants decreased (Figure 5). However, when the comparison was made between the percent cover of invasive plants and the Simpson’s Diversity Index of all the plant species, the outcome was contrary to what was expected (Figure 6). This study showed that as the percent cover of invasive plants in-creased, so did the diversity of the plot overall (Figure 6). From previous research, it was expected that as per-cent cover of the invasive plants increased, diversity of the area would decrease due to the invasive plants driv-ing out the native plants. This was not the case in this study because there was such a diverse population of in-vasive plants on each plot that they increased the diver-sity overall. Nonetheless, these results show that native species were being driven out by the invasive species.
For both sections of the study, the probability of ing an invasive was calculated. The probability of find-ing an invasive throughout the campus based on the 50 randomly allocated plots was smaller (36%) than the probability of finding an invasive on the forest edge (88%). As we mentioned previously, the probability of finding an invasive is greater in the forest edge because of the forest edge effect. The forest edge is the point of entry for invasive plants and is where they start their spread; therefore, there are more invasive plants there, rather than further into the forest (McDonald and Ur-ban 2006, Yates et al. 2004). The probability was also lower throughout the whole campus because some of the plots were located in places that were maintained and mowed.
5
Conclusion
Without management efforts such as the application of herbicide (i.e., glyphosate) and/or hand felling, there will be negative impacts in the future on Shorter Uni-versity’s campus. These invasive plants will not stop spreading unless controlled. The heavy vines (i.e., En-glish ivy and wisteria) growing in trees will likely lead to increased mortality. Once these trees die they will either need to be cut down, which can be expensive, or they will fall and damage buildings or vehicles, costing even more. There are downfalls to using herbicide such as, the cost of the product and that it can kill native species as well that are needed in the ecosystem. How-ever, the longer management is postponed, the more the invasive plants will spread and the more costly they will be to eradicate (Yates et al. 2004).
Future studies should consider continuation of this as-sessment to observe the spread of the invasive plants
deeper into the forest, which continues into both pri-vately held land and Marshall Forest along western and southern edges, respectively. This will allow for the de-termination of how far into the forest the invasive plants are found and allow for a calculation of the rate at which they are spreading. A study on how slope and aspect affect the invasion process would also be bene-ficial. Foremost though, a management plan needs to be constructed for Shorter University’s campus so that these invasive plants can be contained and controlled.
Acknowledgements
The two anonymous reviewers are thanked for criti-cally reading the manuscript and suggesting substantial improvements.
References
Devine, K., and S. Fei. 2011. A review of impacts by in-vasive exotic plants on forest ecosystem services. Gen-eral Technical Report NRS-P-78. Newtown Square, PA: U.S. Department of Agriculture, Forest Service, Northern Research Station.
Dickens, R. 1974. Cogongrass in Alabama after sixty years. Weed Science 22(2): 177–179.
Georgia Forestry Commission. 2015. Top twelve non-native invasive plants 2015 dirty dozen list. Geor-gia Forestry Commission, Macon, GA. Available at: www.gfc.state.ga.us/. . . /TopTwelveNonNativeIn-vasivePlantsGA.pdf. Accessed 2 February 2018.
Hanula, J.L., S. Horn, and J. W. Taylor. 2009. Chinese privet (Ligustrum sinense) removal and its effect on native plant communities of riparian forests. Invasive Plant Science and Management. 2: 292–300.
Hejda, M., P. Pyˇsek, and V. Jaroˇs´ık. 2009. Impact of invasive plants on the species richness, diversity and composition of invaded communities. Journal of Ecol-ogy. 97: 393–403.
McDonald, R. I., and D. L. Urban. 2006. Edge effects on species composition and exotic species abundance in the North Carolina Piedmont. Biological Invasions. 8: 1049–1060.
Miller, J.H., E. B. Chambliss, and N. J. Loewenstein. 2010. Field guide for the identification of invasive plants in southern forests. General Technical Report SRS-119. Asheville, NC: U.S. Department of Agricul-ture, Forest Service, Southern Research Station.
Olson, L. 2006. The economics of terrestrial invasive species: a review of the literature. Agricultural and Resource Economics Review. 35: 178–194.
Oswalt, C.M., S.N. Oswalt, and W.K. Clatterbuck. 2007. Effects ofMicrostegium Vimineum (Trin.) A. Camus on native woody species density and diversity in a productive mixed-hardwood forest in Tennessee. For-est Ecology and Management 242: 727–732.
Pauchard, A., and K. Shea. 2006. Integrating the study of non-native plant invasions across spatial scales. Bi-ological Invasions. 8: 399–413.
indigenous species success during four stages of inva-sion. New Phytologist. 176:256–273.
Urbatsch, L. 2002. Plant Guide: Chinese privet, Ligus-trum sinense Lour. Baton Rouge, LA: U.S. Depart-ment of Agriculture, Natura Resources Conservation Service. Available at: https://plants.usda.gov/. . . -/pg lisi.pdf. Accessed 12 February 2018.