Licensed under Creative Common Page 100
http://ijecm.co.uk/
THE EFFECT OF INFORMATION QUALITY AND PERCEIVED
EASE OF USE ON TRUST TOWARDS REPURCHASE BEHAVIOR
Dewa Ayu Anggi Pramiswari
Master of Management, Faculty of Economics and Business, Udayana University, Indonesia [email protected]
Putu Yudi Setiawan
Master of Management Study Program, Faculty of Economics and Business, Udayana University, Indonesia
Abstract
The advance in transportation into an online-based order occur due to the high demand for
transportation services. This study aimed to explain the quality of information and perceived
ease of use on trust towards repurchase behavior. Respondents obtained are 150 respondents
based on non probability sampling which are purposive sampling. Data analysis method used is
descriptive and inferential statistical analysis with Warp PLS 3.0 as the research tools. The
results showed that both of the quality of information and perceived ease of use had a
significant positive effect on trust and repurchase behavior, trust is positive and significantly
affect repurchases behavior, and trust also a partial mediating variable that affects information
quality and perceived ease on repurchase beghavior. Further, research suggested to improve
the limitations in the study and increase the number of samples and ways of taking data to get
the comprehensive results.
Licensed under Creative Common Page 101
INTRODUCTION
The high demands for moving from one place to another resulting an advance in the transportation service. It is play an important part of everyone's life in this modern era. Transportation make easier for everyone to do their daily activities such as work, school, travel and other activities. The types of transportation are getting excessive nowadays, with a variety of brands are offered, making consumers as decision makers more selective in choosing transportation services to be used (Fauziah, 2017).
The industry begins to realize the use of smartphones in everyday activities. Many conventional business are competing to present their mobile applications to support their business. Consumers just have to open the mobile application and read all the contents made in their grasp. The mobile application makes it easier for consumers to know anything about the business including browse products offered, making transactions, and track ordered goods (Sari, 2017). Online retail or better known as e-commerce also make their own mobile application.
Transportation service providers are also gradually moving in the field of digital and mobile applications to increase their income. One of the transportation service providers that jumps into the public transportation business is PT Aplikasi Karya Anak Bangsa (Gojek Indonesia), which established in 2011. A company engaged in transportation services that connects driver with consumers. In January 2015, the company presents a search engine application based on location on Android and iOS (Apple). Through this apps, the driver can view incoming orders and the location of the customer to respond to, and consumer also can track the position of the service ordered. (Zahra, 2017). On 2016 and 2017, Gojek awarded in the first place of online transportation services category in Indonesia from Top Brands Awards by Frontier Consulting Group, while in 2018 it changed into the second position.
One of the parameters in determining Top Brand is Commitment Share which is shows the strength of the brand in encouraging customers to repurchase in the future. Consumer intentions to repurchase are actions taken by individuals, groups or organizations related to the desire to make a repurchase in order to obtain or use goods or services that influenced by the environment (Swastha, 2003). Repurchase intention can be grouped into a component of consumer cognitive behavior that can influence individuals to make purchases on a product (Hosein, 2009).
LITERATURE REVIEW
Licensed under Creative Common Page 102 exchange relationship (Becerra et al., 2011). Darwin et al. (2014) stated that there are 4 dimensions shaping customer trust namely Benevolence, Reliability, Competence, and Honesty.
Figure 1. Conceptual Framework
Service providers who offer high quality information to customers are considered useful for customers to make better decisions (Saeed et al., 2008). Kim et al. (2016) show that when consumer receive a good information, they tends to influence someone's decision to make a purchase. Chen et al. (2014) also stated that the stronger quality of information produced, the more it can be felt by the users. The explanation above reinforces the suspicion that information quality factors influences repurchase behavior on online transportation services.
H1 : The information quality has a positive and significant effect on repurchase behavior
Good information quality will lead to consumer trust in a product or service. Factors that support information quality are reliability, ease of access, and can represent consumer desires (Lee et al., 2012. Greater information quality will lead to higher levels of trust. The existence of good information quality can increase consumer trust (McDowell, 2013). Trust will arise if consumers have felt satisfaction because they have consumed or used a product with a particular brand. Customers who feel comfortable and trust because of a product, will not easily leave or replace the product with other brand products (Iswara, 2016).
H2: Information quality has a positive and significant effect on trust
Cha (2011) found that benefits, perceived ease of use, enjoyment, security, social norms, flow, and gender affect the intention to buy goods via the internet. Cho et al. (2015) found that the ease of navigation through online stores and the faster checkout process was an important factor in attracting customers to shop online. Other studies have found that perceived ease of use has a significant positive effect on consumers' intention to shop online (Chen et al., 2007).
Licensed under Creative Common Page 103 Tjini (2013) states that perceived ease of use is a person's belief in the use of technology that can be easily understood and operated. The easier the use of technology will support consumers to make transactions. (Shen et al., 2012) stated that an online shopping transaction is influenced not only by website design and reputation but also by the easiness in making transactions. The ease of use also has a positive influence on trust which results in an increase in customers shopping online. The perceived ease of use are the degree which the user believes that the technology or system can be easily used or free from problems (Zaidi et al, 2014).
H4: Perceived ease has a positive and significant effect on trust.
As the rise of internet crimes such as credit card burglary and fraud, trust becomes very important in online shopping transactions. This concept of trust means that the buyer believes in the reliability of the online seller who can guarantee the security of online transactions. On online shopping sites, not a few fictitious online sellers who market fictitious products as well. (Ashari, 2012). Putra (2006) stated that rust has a significant influence on e-ticket purchase intentions on the Traveloka site. Sam & Tahir (2009) states that there is a significant relationship between trust in online purchase intentions. Giantari et al. (2013) also found that trust positive and significantly affect intention to buy online.
H5: Trust has a positive and significant effect on repurchase behavior
To satisfy the consumer needs of information needs of consumers or online shoppers, product and service information must be up to date, able to help online shoppers to make decisions, be consistent, and be easily understood. Ferdiansyah (2016) states that the quality of information has a positive impact on customer trust that affects online purchasing decisions. Good quality information will lead to consumer confidence in a product or service. Factors that support information quality are reliability, ease of access, and can be consumer desires representative (Lee et al., 2012). Several studies have examined its relationship such as study from Ashari (2012) and Sam & Tahir (2009).
H6: Trust significantly mediates the information quality on repurchase behavior.
Licensed under Creative Common Page 104 use is the speed at which users believe that the technology or system can be used easily and free of problems. Several studies discuss the relationship of trust with repurchase as Ashari (2012) and Sam & Tahir (2009) have studied.
H7: Trust significantly mediates the perceived ease of use on repurchases behavior.
RESEARCH METHOD
This research uses a quantitative approach in the form of associative study. The variables used are information quality, perceived ease of use, trust, and repurchase behavior. Sampling is based on non-probability sampling with a purposive sampling technique. Data collected through distributing questionnaires to respondents who live in Denpasar with a criteria of minimum high school education background or equivalent, have installed Gojek application and have conducted a goride service transaction more than twice. The answers from respondents is measured using a Likert scale. The research instrument test use in the form of a validity and a reliability test. Inferential statistical data analysis techniques applied with variant-based SEM or SEM-PLS.
RESULT AND ANALYSIS
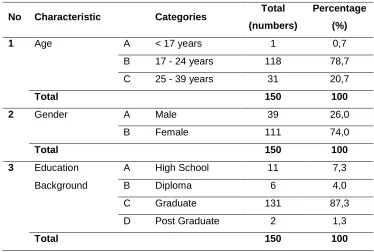
Questionnaires were distributed according to the criteria; 150 people were assigned as respondents.
Table 1. Respondent Characteristics
No Characteristic Categories Total
(numbers)
Percentage
(%)
1 Age A < 17 years 1 0,7
B 17 - 24 years 118 78,7
C 25 - 39 years 31 20,7
Total 150 100
2 Gender A Male 39 26,0
B Female 111 74,0
Total 150 100
3 Education A High School 11 7,3
Background B Diploma 6 4,0
C Graduate 131 87,3
D Post Graduate 2 1,3
Licensed under Creative Common Page 105
4 Occupation A Student 23 15,3
B Private employee 78 52,0
C Entrepreneur 14 9,3
D Civil Servant 3 2,0
E Others 32 21,3
Total 150 100
Based on Table 1, the number of female respondents is higher than male respondents with a percentage value of 74% and male respondents as much as 26%. Distribution based on age results showed that the most respondents aged 17-24 years that is equal to 78.7%, followed by respondents 25-39 years as many as 20.7%. Distribution based on education background mostly from graduate program as much as 87,3%. Distribution of respondents based on work can be seen that the most respondents are those who work as private employees as much as 52% and where the lowest is civil servants with a presentation of 2%.
Table 2. Instrument Validity Test
No Variables Indicators Pearson
correlation
Info.
1 Information quality (X1)
Go-ride information is up to date (X1.1) 0,795 Valid
Go-ride information is fully equipped (X1.2) 0,821 Valid
Go-ride information is accurate (X1.3) 0,791 Valid
Go-ride cost information is very clear (X1.4) 0,818 Valid
2 Perceived ease of use (X2)
It is easy to use Go-ride (X2.1) 0,867 Valid
It is easy to do price comparison using Go-ride (X2.2) 0,893 Valid
It is easy to understood Go-ride service (X2.3) 0,928 Valid
It is easy to do a transaction using Go-Ride(X2.4) 0,937 Valid
3 Trust (Y1) Believe that Go-ride have a high quality service (Y1.1) 0,922 Valid
Believe that Go-ride have convenience service (Y1.1) 0,920 Valid
Believe that consumer will satisfied using Go-ride service( Y1.3)
0,893 Valid
4 Repurchase Behavior (Y2)
Desired to repurchase Go-ride service (Y2.1) 0,873 Valid
Desire to always use Go-ride service (Y2.2) 0,879 Valid
Desired to recommend Go-ride service (Y2.3) 0,884 Valid
Desired to put Go-ride as the first choice (Y2.4) 0,819 Valid
Licensed under Creative Common Page 106 The whole statement item seen in Table 2 on the information quality variable, perceived ease of use, trust and repurchase behavior have been tested. In order to meet the validity requirements, the product moment correlation coefficient has exceeded 0.3, the question items are valid.
Table 3. Reliability Test Result
No. Variables Cronbach’s
Alpha
Information
1 Information quality (X1) 0,815 Reliable
2 Perceived ease of used (X2) 0,926 Reliable
3 Trust (Y1) 0,897 Reliable
4 Repurchase Behavior (Y2) 0,867 Reliable
The whole statement item seen in Table 2 have been tested. In order to meet the validity requirements, the product moment correlation coefficient has exceeded 0.3 (Table 3), so the question items are valid.
Table 4. Factor Loading Results
Variables Factor
Loading P Value
X1.1 <- Go-ride information is up to date 0.849 0,000
X1.2 <- Go-ride information is fully equipped 0.900 0,000
X1.3 <- Go-ride information is accurate 0.887 0,000
X1.4 <- Go-ride cost information is very clear 0.795 0,000
X2.1 <- It is easy to use Go-ride 0.845 0,000
X2.2 <- It is easy to do price comparison using Go-ride 0.843 0,000
X2.3 <- It is easy to understood Go-ride service 0.935 0,000
X2.4 <- It is easy to do a transaction using Go-Ride 0.926 0,000
Y1.1<- Believe that Go-ride have a high quality service 0.874 0,000
Y1.2 <- Believe that Go-ride have convenience service 0.908 0,000
Y1.3 <- Believe that consumer will satisfied using Go-ride service 0.901 0,000
Y2.1 <- Desired to repurchase Go-ride service 0.853 0,000
Y2.2 <- Desire to always use Go-ride service 0.889 0,000
Y2.3 <- Desired to recommend Go-ride service 0.857 0,000
Licensed under Creative Common Page 107 Thus Table 4 shows that the value of factor loading with a p value of each indicator <0.001. Aside from the factor loading value, convergent validity can also be seen from Average Variance Extracted (AVE).
Table 5. Average Variance Extracted (AVE)
Variables Average Variance Extracted (AVE)
Trust (Y1) 0.800
Information quality (X1) 0.738
Repurchase Behavior (Y2) 0.720
Perceived ease of use (X2) 0.789
Based on table 5. it can be seen that all AVE values are greater than 0.5. Table 5 shows that the square root value of AVE is greater than the correlation of each construct. Thus it can be said that the model has no problem seen from discriminant validity.
Table 6. Discriminant Validity
Variables Trust (Y1)
Information
quality (X1)
Repurchase
behavior (Y2)
Perceived ease
of use (X2)
Trust (Y1) 0.895
Information quality (X1) 0.704 0.859
Repurchase Behavior (Y2) 0.720 0.740 0.848
Perceived ease of use (X2) 0.628 0.656 0.651 0.888
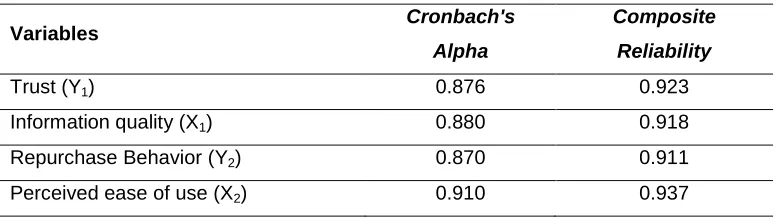
Ensuring that there are no problems with measurement, the final step in evaluating the outer model is to test the unidimensionality of the model. Composite reliability and alpha cronhbach tests are used. Both of these indicators the cut-off point value is 0.7 as shown in Table 7.
Table 7. Composite Reliability and Cronbach’s Alpha
Variables Cronbach's
Alpha
Composite Reliability
Trust (Y1) 0.876 0.923
Information quality (X1) 0.880 0.918
Repurchase Behavior (Y2) 0.870 0.911
Licensed under Creative Common Page 108 Table 7 shows that all Cronbach's alpha values in each variable are greater than 0.7 and all Composite Reliability values are more than 0.6. Thus it can be stated that the data in the study are reliable.
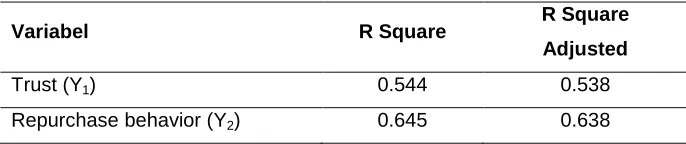
Inner Model Evaluation aims to determine the goodness of fit model with the R-Square (R2) method. Shows the strengths and weaknesses of the effect caused by variations in exogenous variables on endogenous variables.
Table 8. R-Square (R2) value of Endogenous Variables
Variabel R Square R Square
Adjusted
Trust (Y1) 0.544 0.538
Repurchase behavior (Y2) 0.645 0.638
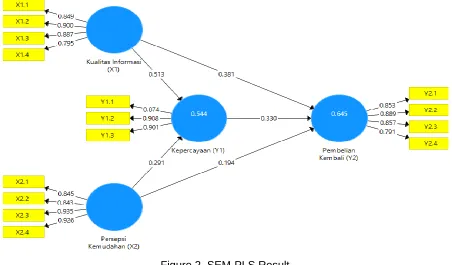
Table 8 shows that, obtained R-square value for the variable quality of information and perceived ease of use on trust is 0.544, including moderate, which indicates an influence of 0.544 x 100% = 54.4%. R-square value for the variable quality of information and the perceived ease of use for repurchase of 0.645, or 0.645 x 100% = 64.5%.
Q-Square (Predictive Relevance) measures how well the observed value generated by the estimation model and its parameters. Q-Square value > 0 indicates the model has good predictive relevance. The Q-Square (Predictive Relevance) value can be calculated as follows:
Q2 = 1 – [(1-R12) (1- R22)] Q2 = 1 – [(1-0,645) (1-0,544)] Q2 = 1 – [(0,355) (0,456)] Q2 = 1 – (0.1618)
Q2 = 0.8382
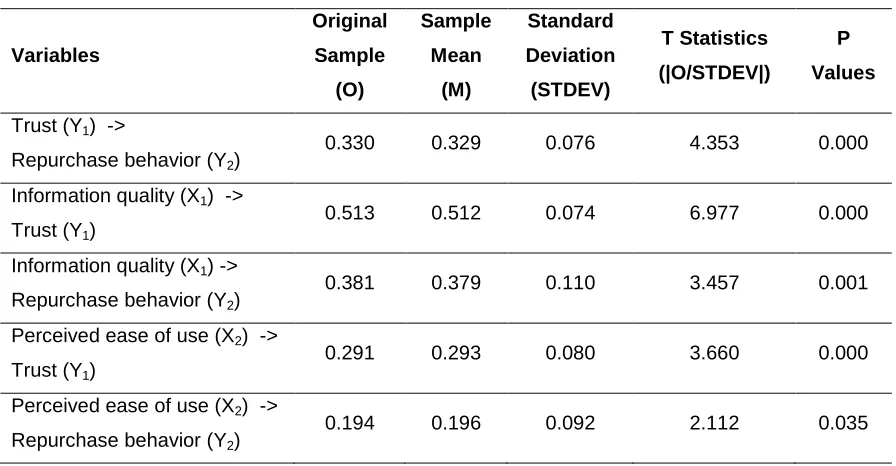
Licensed under Creative Common Page 109 Table 9. Direct Test Result
Variables Original Sample (O) Sample Mean (M) Standard Deviation (STDEV) T Statistics (|O/STDEV|) P Values
Trust (Y1) ->
Repurchase behavior (Y2)
0.330 0.329 0.076 4.353 0.000
Information quality (X1) ->
Trust (Y1)
0.513 0.512 0.074 6.977 0.000
Information quality (X1) ->
Repurchase behavior (Y2)
0.381 0.379 0.110 3.457 0.001
Perceived ease of use (X2) ->
Trust (Y1)
0.291 0.293 0.080 3.660 0.000
Perceived ease of use (X2) ->
Repurchase behavior (Y2)
0.194 0.196 0.092 2.112 0.035
Table 9 shows that the relationship between the trust variable (Y1) and repurchase (Y2), information quality (X1) to trust (Y1), information quality (X1) to repurchase (Y2), perceived convenience (X2) to trust (Y1) ) and perceived ease (X2) of repurchase (Y2) are positive and significant by comparing P-values less than alpha 0.05.
The results of this indirect effect test aim to find out the significance of the indirect relationship between information quality variables, perceived ease of trust and repurchase. Table 10 shows that the relationship of information quality (X1) -> trust (Y1) -> repurchase (Y2) and perceived convenience -> (X2) trust (Y1) -> repurchase (Y2) is significant with P Values (0,000 < 0,05).
Table 10. Indirect Effect Result
Variables Original Sample (O) Sample Mean (M) Standard Deviation (STDEV) T Statistics (|O/STDEV|) P Values
Information quality (X1) -> Trust
(Y1) -> Repurchase behavior (Y2)
0.169 0.167 0.042 4.055 0.000
Perceived ease of use -> (X2) Trust
(Y1) -> Repurchase behavior (Y2)
Licensed under Creative Common Page 110 Hypothesis test present as statistical analysis of relationship between variables shown in table 11.
Table 11. Hypothesis Test Result
Variabel Original Sample (O) P Values
Trust (Y1) -> Repurchase Behavior (Y2) 0.330 0.000
Information Quality (X1) -> Trust (Y1) 0.513 0.000
Information Quality (X1) -> Repurchase Behavior (Y2) 0.381 0.001
Perceived ease of use (X2) -> Trust (Y1) 0.291 0.000
Perceived ease of use (X2) -> Repurchase Behavior (Y2) 0.194 0.035
Table 11 shows that the relationship between the trust variable (Y1) and repurchase (Y2), information quality (X1) to trust (Y1), information quality (X1) to repurchase (Y2), perceived convenience (X2) to trust (Y1) ) and perceived ease (X2) of repurchase (Y2) are positive and significant by comparing P-values less than alpha 0.05.
Figure 2. SEM-PLS Result
CONCLUSION AND SUGGESTIONS
Licensed under Creative Common Page 111 behavior, and trust has a significant positive effect on repurchase behavior. Trust can also partially mediate the influence of information quality and perceived ease of use towards repurchase behavior significantly.
All variables used in this study have high scores, so it is suggested that companies continue to pay attention to important factors such as information quality and perceived ease of use in creating trust and are expected to increase repurchases behavior of their consumers. The monitoring of information quality has to be done regularly to ensure that the information is clear and comprehensive. It is also important to make that product which in this case the Go-Jek application to ease to operate in order to create the higher perceived of use around customer.
This study has several limitations which are the sample taken of this study is limited only 150 respondent, the bigger number of samples will be better to get a comprehensive result. Adding other variables that can affect repurchase behavior would be great such as brand image or consumer satisfaction.
REFERENCES
Ashari, D., (2012). Pengaruh Kualitas Produk dan Harga Terhadap Keputusan Pembelian Konsumen pada Produk Dic Jeans. Jurnal Telkom University, 4, 358-367
Becerra, E. P., & Korgaonkar, P. K. (2011). Effects of trust beliefs on consumers’ online intentions. European Journal of Marketing, 45(6) , 936-962.
Cha J. (2011). Exploring The Internet as a Unique Shopping Channel to Sell Both Real and Virtual Items: A Comparison of Factor Affecting Purchase Intention and Consumer Characteristic. Journal of Electronic Commerce Research, 12(2), 115-132.
Chen, C.W., Chen, W.C., & Chen, W.K., (2014). Understanding The Effects of Ewom on Cosmetic Consumer Behavior Intention. International. Electronic Journal of Commerce. 5(1), 97–102.
Chen, Y-H., & Stuart B. (2007). Initial Trust and Online Buyer Behavior. Industrial Management & Data Systems, 107(1) 21-36.
Cho, C.Yoon., & Sagynov, E. (2015). Exploring Factors that Affect Usefulness, Ease Of Use, Trust, and Purchase Intention In The Online Environment. International Journal of Management & Information Systems. 19(1), 21-35, Darwin, S. & Kunto, Y. S., 2014, Analisis Pengaruh Kualitas Layanan Terhadap Loyalitas Pelanggan dengan Kepuasan dan Kepercayaan Pelanggan sebagai Variabel Intervening pada Asuransi Jiwa Manulife Indonesia– Surabaya, Jurnal Manajemen Pemasaran Petra, 2.
Fauziha, L. N. (2017). Pengaruh Kepercayaan, Kemudahan, Kualitas Informasi dan Persepsi harga terhadap Pemilihan Model Jasa Transportasi Online. Jurnal Brawijaya University, 5, 31-39
Giantari, I. G. A. K., Zain, D., Rahayu, M., & Solimun. (2013). The Role Of Perceived Behavioral Control and Trust as Mediator of Experience on Online Purchasing Intentions Relationship A Study on Youth in Denpasar City (Indonesia). International Journal of Business and Management Invention, 2(1), 30-38.
Hosein. A. (2009). “A Modification on K-Nearest Neighbor Classifier”. Global Journal of Computer Science and Technology.
Iswara, D., (2016). Pengaruh Kepercayaan, Kemudahan, Kualitas Informasi, dan Persepsi Risiko Terhadap Keputusan Pembelian. Jurnal Manajemen. Universitas Negeri Yogyakarta. 2(3),56-63
Kim, M.J., Chung, N., Lee, C.K., Preis, M.W., 2016. Dual-route of Persuasive Communications in Mobile Tourism Shopping. Telemat. Inform. 33, 293–308.
Licensed under Creative Common Page 112 McDowell, W. C., Michael L. H. & Shanan G. G. (2013). The Influence of Communication and Information Quality on Trust in the Small Business Supply Chain. Journal of Applied Management and Entrepreneurship.18(2).
Putra, I. P. A. P. A. (2016). Pengaruh Persepsi Kemudahaan Penggunaan, Persepsi Risiko, Terhadap Kepercayaan dan Niat Beli E-Ticket pada Situs Traveloka. E-jurnal Manajemen FEB. Universitas Udayana, 05(09), 2337-3067. Saeed, K.A., & Abdinnour-Helm, S. (2008). Examining the effects of information system characteristics and perceived usefulness on post adoption usage of information sys-tems. Inf. Manag.45(6), 376–386.
Sari, M., Lia, A. R. S., & Grace, H. 2017. Analisis Brand Image, Price dan Service Quality Terhadap Purchase Decision Layanan Jasa Transportasi Berbasis Online (Gojek). E-Journal Management. Binus University, 50, 465-476. Sam, M., Fazli M., & Tahir, M. N. H. (2009). Website Quality and Consumer Online Purchase Intention of Air Ticket. International Journal of Basic and Applied science IJBASIJENS, 9(10), 4-9.
Shen, Y., Li, S., & Demoss, M. (2012). The Effect of Quantitative Electronic Word of Mouth on Consumer Perceived Product Quality. International Journal of Management and Marketing Research. 5, 9–30.
Swastha, B. & Irawan. (2003). Manajemen Pemasaran Modern. Yogyakarta: Liberty Yogyakarta.
Tjini & Baridwan. (2013). Pengaruh Kepercayaan, Persepsi Kegunaan, Persepsi Kemudahan, dan Persepsi kenyamanan terhadap minat menggunakan Internet Banking . Jurnal Akuntansi Universitas Diponegoro Semarang. 5, 388-392.
Zahra, A. (2017). Pengaruh Kualitas Pelayanan, Persepsi Harga, Dan Citra Merek Terhadap Kepuasan Pelanggan Pengguna Jasa Transportasi Ojek Online. Jurnal Manajemen Universitas Negeri Yogyakarta.