J. Range Manage.
46:142-147, March 1993
The constituent differential method for deter- mining live and dead herbage
ROBERT L. GILLEN AND KENNETH W. TATE
Authors are associate professor and former senior agricullurist. Agronomy Department, Oklahoma Stare Univer- sity, Stillwater 74078. _ ”
Abstract
Determination of live and dead herbage fractions from mixed herbage samples requires hand separation or specialized iabora- tory procedures. The constituent differential method is designed to determine the relative proportion of live and dead components in a mixture based on the difference in dry matter concentration between the components. Our objective was to evaluate several characteristics of the constituent differential method under geld conditions in tallgrass and mixed grass vegetation. Estimation of live standing crop by this method is most sensitive to the dry matter content of the total mixture and the dead component but becomes less sensitive as the difference between these variables increases.
Time-of-day was not usually associated with dry matter content of the herbage components if sampling began after the herbage was thoroughly dry to the touch. Suggested sample sizes in large exper- imental units for estimating dry matter content are 40-50 samples for herbage mixtures, 10 samples for live herbage, and 5 samples for dead herbage. In 4 field trials the average value for percent live herbage determined by hand separation and the constituent differ- ential method differed by 1.6 percentage units, which was non- significant (P)O.lO). The constituent differential method is a rela- tively rapid and accurate method for determining live and dead herbage fractions.
Key Words: dry matter content, forage sampling, live:dead ratios, tallgrass prairie
The relative amount of live and dead material in herbage is an important variable for many studies including those involving dynamics of herbage growth and animal nutrition. Hand separa- tion is the most accurate and standard method of determining live and dead herbage fractions or species composition (Bonham 1988) but it is also the most time consuming and several alternative procedures have been devised. The major alternatives are pigment extraction (Hunter and Grant 1961, Lauenroth et al. 1980), point samples analysis (Heady and Van Dyne 1965), microhistological analysis (Johnson 1986), and the constituent differential method (Hunter and Grant 1961). All but the last of these alternatives require laboratory preparation of samples.
The constituent differential method is designed to determine the relative proportion of 2 components in a mixture based on the difference in concentration of some constituent in the components.
It was first used to determine the species composition of a 2-species mixture based on dry matter, crude protein, or calcium content (Cooper et al. 1957). Hunter and Grant (1961) used the method with dry matter content to determine live and dead fractions. In 6 field trials, the average percentage of live material was 72% for the The authors thank Justin Derner and Scott Haggard for assistance in data collection.
Journal article JA-61 IS of the Oklahoma Agricultural Experiment Station, Okla- homa State University, Stillwater, Okla.
Manuscript accepted 11 June 1992.
constituent differential method compared to 66% for hand separa- tion. The authors noted the method was sensitive to surface mois- ture on the herbage, which limited its application in their region.
We felt the constituent differential method had potential as a rapid procedure for estimating live and dead components of her- bage mixtures. However, the method needed more complete analy- sis before its full-scale adoption in our sampling plans. Our objec- tive was to evaluate the constituent differential method using dry matter content with respect to sensitivity to measurement errors, time-of-day effects, sample size requirements, and accuracy under actual field conditions.
Study Areas
Field sampling for the studies was done on several sites on the Oklahoma State University Research Range about 21 km south- west of Stillwater (36’ 3’ N, 97’ 14’ W) and the Marvin Klemme Range Research Station about 15 km southwest of Clinton, Okla- homa (35” 22’ N, 99” 04’ W). The climate is continental at both locations. Average precipitation at Stillwater is 83 1 mm with 65%
falling as rain from May to October. Mean temperature is 15’ C with average monthly temperatures ranging from 2. lo C in Janu- ary to 27.8’ C in August (Myers 1982). Average precipitation at the Klemme Station is 663 mm with 79% received from May to October. Mean temperature is 16.1° C with average monthly temperatures of 3.2O C in January and 28.4O C in July (Moffatt and Conradi 1979). The average frost-free growing period extends from April to October and totals 204 and 206 days for Stillwater and the Klemme Station.
All study sites at Stillwater supported tallgrass plant communi- ties in high seral condition. Major plant species included little bluestem[ Schizachyrium scoparium (Michx.) Nash], big bluestem [ Andropogon gerardii Vitman], indiangrass [ Sorghastrum nutans (L.) Nash], switchgrass [Punicum virgatum L.], tall dropseed [Sporobolus asper (Michx.) Kunth], and western ragweed [Am- brosiapsilostachya DC.]. Study sites at the Klemme Station sup- ported mixed grass plant communities in high seral condition.
Major plant species included sideoats grama [ Bouteloua curtipen- dula (Michx.) Torr.], blue grama [Bouteloua gracilis (H.B.K.) Lag. ex Steud.], buffalograss [Buchloe dactyloides (Nutt.) Engelm.], silver bluestem [ Bothriochloa saccharoides (SW.) Rydb.), western ragweed, and curlycup gumweed [ Grindelia squarrosa (Pursh) Dun.].
Methods
The constituent differential method is based on the fact that if 2 herbage components differ in dry matter content their respective fractions in a mixture can be determined if the dry matter content is known for each component as well as for the mixture. This is a reversal of the calculation often used to balance livestock rations for protein or mineral content. Dry matter content of the mixed sample is a weighted average of the dry matter content of the live
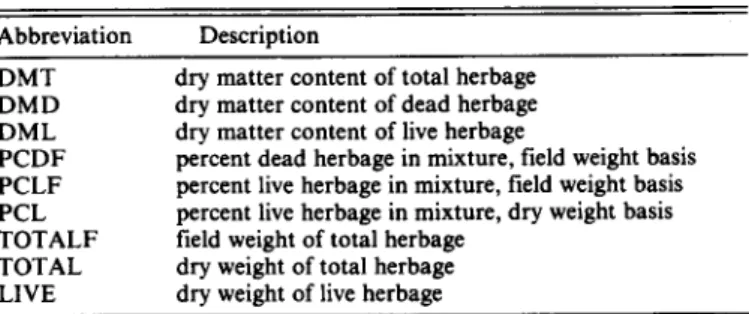
Table 1. Description of abbreviations used in equations.
Abbreviation Description
DMT dry matter content of total herbage DMD dry matter content of dead herbage DML dry matter content of live herbage
PCDF percent dead herbage in mixture, field weight basis PCLF percent live herbage in mixture, field weight basis PCL percent live herbage in mixture, dry weight basis TOTALF field weight of total herbage
TOTAL dry weight of total herbage LIVE dry weight of live herbage
and dead components. The weighting factor is the proportion of the field weight contributed by each component. The relationship can be written as (see Table 1 for abbrevitions):
DMT = DMD*PCDF+DML*PCLF (1)
100
equation (9) with respect to each of the independent variables. The derivatives were then divided by percent live herbage to express the relative rate of change. These functions were plotted continuously over the normal observed range of 1 independent variable of interest while the other 2 independent variables were held constant at a few levels reflecting their normal range.
Thirteen field trials were conducted to determine the possible effect of time-of-day of sampling on the method. During normal sampling activities for other studies, the time of day was noted when each pure live and dead herbage sample was collected. Time was converted to total minutes from midnight and correlated with dry matter percent for the live and dead herbage samples. Signifi- cant positive correlations would suggest the herbage was drying during the day, which could introduce bias into the calculations.
Also,
PCDF = (lOO-PCLF)
Substituting equation (2) into equation (1) results in:
DMT = DMD*(lCG-PCLF)+DML*PCLF 100
(2)
(3)
Sample means and variances for dry matter contents of herbage mixtures and live and dead herbage were calculated from several individual trials. Stein’s equation (Steel and Torrie 1980) was used to calculate the sample size required in each trial to estimate the mean with a deviation no larger than 5% of the true mean with P = 0.05. These results were plotted in a cumulative frequency distribu- tion to assess the sample size required to meet the precision stand- ards over a range of conditions.
Equation (3) can be rewritten as:
PCLF = @MT--DMD) * 100 (DML-DMD)
In addition,
(4)
LIVE =m *TOTALF* _ DML
100 100
and,
(5)
PCL = LIVE* 100
TOTAL (6)
Inserting equation (5) into equation (6) gives:
pcL = PCLF*TOTALF*DML TOTAL * 100
(7)
Equation (7) further simplifies to:
pcL = PCLF * DML
DMT (8)
Four trials were conducted to test the methodology under field conditions. For the first 2 trials, thirty 0.1-m* plots were clipped to ground level and hand separated into live and dead fractions in the field. An additional 6 samples of pure live or pure dead herbage were collected over the time period the plots were being clipped.
The pure samples were obtained by clipping herbage in the imme- diate vicinity of the clipped plots and hand separating into live and dead fractions. At least 20 g field weight of each component were gathered for the pure samples. All herbage samples were weighed in the field and re-weighed after being oven-dried at 45O C. The live and dead fractions were then calculated from the hand-separated samples and by the formulas for the constituent differential method. In the last 2 trials, forty-five 0.1-m* plots were clipped to ground level and weighed in the field. Ten pure live and dead samples were also collected and weighed. The plot samples were taken directly to the laboratory and hand-separated. All herbage samples were then oven-dried at 45’ C. Live and dead fractions were calculated from the hand-separated samples and by the for- mulas for the constituent differential method. All field weighing was done to the nearest gram with Pesola spring-scales. Dried samples were weighed to the nearest 0.1 g with an electronic balance. The null hypothesis that the difference in the live fraction estimated by the 2 methods was equal to 0 was tested using a r-test.
Finally, inserting equation (4) into equation (8) results in: Results and Discussion
PCL=(DMT-DMD) t DML * 1oo (9)
(DML-DMD) DMT
The dead fraction can be obtained by subtraction from the results of equations (5) and (9). Cooper et al. (1957) present equa- tions (4) and (9) but were not explicit in the complete derivation of the equations.
Sensitivity Analysis
The sensitivity of the constituent differential method will be discussed in terms of relative changes in percent live herbage in response to absolute changes in the 3 independent variables. Rela- tive change in the dependent variable expresses the seriousness of possible errors in measurement of the independent variables.
Equation (9) indicates the percent of the total dry weight con- tributed by the live component can be calculated if the dry matter contents are known for the total mixture, the live fraction, and the dead fraction. These dry matter contents can, in turn, be calculated by obtaining field weights and oven-dry weights of the total her- bage and the 2 components.
Sensitivity analysis was performed to determine the influence of the 3 independent variables-dry matter contents of the total herbage, live fraction, and dead fraction, on the accuracy of the method. The rate of change of the dependent variable, percent live herbage, was determined by calculating the partial derivative of
The calculation of percent live herbage is most sensitive to dry matter contents of the total mixture and the dead herbage. Under certain conditions, percent live herbage can change as much as 11%
in response to a l-percentage-unit change in dry matter content of the total mixture (Fig. 1). A similar change in dry matter content of the dead herbage can result in relative changes in percent live herbage as large as 8% (Fig. 2). Percent live herbage changes most rapidly when dry matter contents of the total mixture and the dead herbage are close together, especially when dry matter content of the total mixture is 65-70% and dry matter content of the dead herbage is below 85%. As the difference between these 2 independ- ent variables increases, the calculation becomes less sensitive. The
JOURNAL OF RANGE MANAGEMENT 46(2), March 1993 143
. ‘)
DMD 00 I
?k’-‘-‘-‘-‘-‘~‘-
40 45 50 55 60 65 70 7eDMT(%)
Fig. 1. Relative rate of change of the percent of live herbage in the mixture as a function of the dry matter content of the total mixture.
response to dry matter content of the total mixture is not depend- ent on dry matter content of live herbage.
The sensitivity to changes in dry matter of live herbage is fairly consistent over the range of observed conditions (Fig. 3). The response to dry matter content of live herbage is little affected by the level of dry matter content of dead herbage and is not affected by the level of dry matter content of the total mixture.
When dry matter content of dead herbage is >!Xl% (the usual case), the relative change in percent live herbage in response to a l-percentage-unit change in dry matter contents of the total mix- ture or live herbage varies only from 4 to 6% over the range of observed values of these 2 independent variables. In the same region, the response to a l-percentage-unit change in dry matter content of dead herbage would be <4%.
The sensitivity analysis has implications for field use of the constituent differential method since sensitivity can also be inter- preted as potential error. Accurate measurement of dry matter content of the total mixture and dry matter content of dead her- bage appears to be most important. The entire method is most vulnerable to error when the dry matter contents of the 3 fractions are most similar, especially when the dry matter content of dead herbage is <9%. This situation would most likely occur late in the growing season when the proportion of dead herbage in the mix- ture would be high.
Effect of Time-of-Day
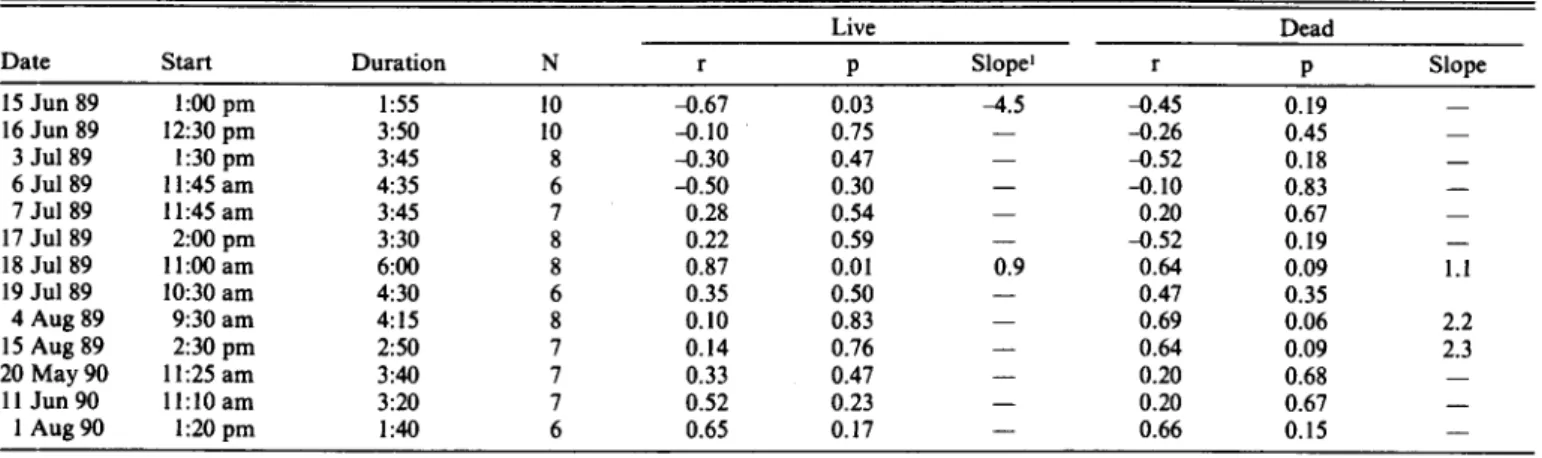
Over a range of start times from 9:30 a.m. to 2:30 p.m. and duration of sampling from 1 hour 40 minutes to 6 hours, dry matter contents were not often correlated with time-of-day (Table 2). Five out of 26 correlations were significant (pIO.10). Between 2 and 3 significant correlations would be expected by chance alone out of the 13 trials. It would normally be expected that dry matter content would increase over time as moisture dried on the surface of the herbage; but in 1 trial, 15 June 1989, the live component actually decreased in dry matter content over a 2-hour period. This suggests the dead component is more sensitive to time-of-day than the live component. The dead component would likely show more response to changes in humidity since it has no cuticle or external layers to retard moisture exchange with the atmosphere. Sampling started in these trials only when the herbage was completely dry to the touch. This appears to be an adequate guideline for minimizing time-of-day effects.
121
10 8 t
DML=SO
29 l .r
---- ***A._.
----
9 5 ---o-o---
- 80 ’ * 85 ’ - QO ’ - 95 ’ 100 I . DMD (%)
Fig. 2. Relative rate of change of the percent of live herbage in the mixture as a function of the dry matter content of the dead component.
An essential requirement for using the constituent differential method is that the dry matter contents of the live and dead compo- nents do not change over the course of the sampling period. Bias will result if the dry matter contents are not constant. This would be especially serious if different treatments are sampled early and late in the day. The bias could be removed if the rate of change over time were known but this would greatly complicate the calcula- tions. Changes over days are not a problem if new dry matter
a lo-
i? .
.E am
8 6-
s
6 4, e--- .w.&.L’---r-r- --a-.-.-.-u.
25 30 35 40 45 50 55
DML (%)
Fig. 3. Relative rate of change of the percent of live herbrge in the mixture as a function of the dry matter content of the live component.
samples are taken daily.
Sampling Variability
The dry matter content of herbage mixtures tended to be higher for the mixed grass sites than for the tallgrass sites (Table 3).
Variability as measured by the coefficient of variation was about equal between the 2 vegetation types. The more homogeneous components of live and dead herbage had much lower sampling variability than the mixtures. Of the pure components, the live fraction was more variable in dry matter content.
Tallgrass Mixed Grass m-w_.
Plots Required
Fig. 4. Cumulative frequency distribution of sample size required to esti- mate the mean with a deviation from the true mean of 5% or leas with P q
0.05 for dry matter content of herbage mixtures. Based on 72 field trials for tallgrass sites and 24 geld trials for mixed grass sites.
A relatively high standard for sample precision, a deviation of
<5% from the true mean with PzO.05, was adopted because of the sensitivity of the calculations to errors in the determination of dry matter content of the 3 herbage components. For the tallgrass sites, a sample size of 40 would meet this standard 86% of the time while increasing the sample size to 50 would meet the standard 89% of the time (Fig. 4). The mixed grass sites were slightly more variable with a sample size of 50 meeting the precision standard 83% of the time.
These trials were conducted on grazed study units of 20 to 50 ha
Table 2. Correlations between time-of-day and dry matter content of live and dead herbage components.
Live Dead
Date Start Duration N r P Slope’ r P Slope
I5 Jung9 I:00 pm 155 IO XI.67 0.03 -4.5 a.45 0.19
16 Jun 89 l2:30 pm 3:50 IO -0.10 0.75 - -0.26 0.45
3 Jul89 I :30 pm 3145 8 -0.30 0.47 a.52 0.18 -
6 Jul89 II:45 am 4:35 6 -0.50 0.30 - -0.10 0.83 -
7 Jul89 I1:45 am 3:45 7 0.28 0.54 0.20 0.67
17 Jul89 2:00 pm 3:30 8 0.22 0.59 - -0.52 0.19 -
18 Jul89 11:OO am 6:00 8 0.87 0.01 0.9 0.64 0.09 1.1
19 Jul89 IO:30 am 4:30 6 0.35 0.50 - 0.47 0.35
4 Aug 89 9:30 am 4:15 8 0.10 0.83 0.69 0.06 2.2
15 Aug89 2:30 pm 2:50 7 0.14 0.76 - 0.64 0.09 2.3
20 May 90 1 I:25 am 3:40 7 0.33 0.47 - 0.20 0.68
II Jun 90 1l:lO am 3:20 7 0.52 0.23 - 0.20 0.67 -
1 Aug90 I:20 pm I:40 6 0.65 0.17 - 0.66 0.15 -
lPercentag units per hour.
Table 3. Mean and coeftkient of variation for dry matter content of herbage mixtures and the live and dead herbage components from repeated field trials.
Component
Mixture Tallgrass Mixed Grass Live’
Dead
Number Sample size
of trials per trial
72 40-60
24 44-50
33 8
33 8
Dry matter content Coefficient of variation
Mean Range Mean Range
____________________________%____________________________
51 37-67 15 7-38
65 51-80 17 9-31
38 31-47 7 2-19
91 78-99 4 l-13
‘Live and dead samples from tallgrass.
JOURNAL OF RANGE MANAGEMENT 46(2), March 1993 145
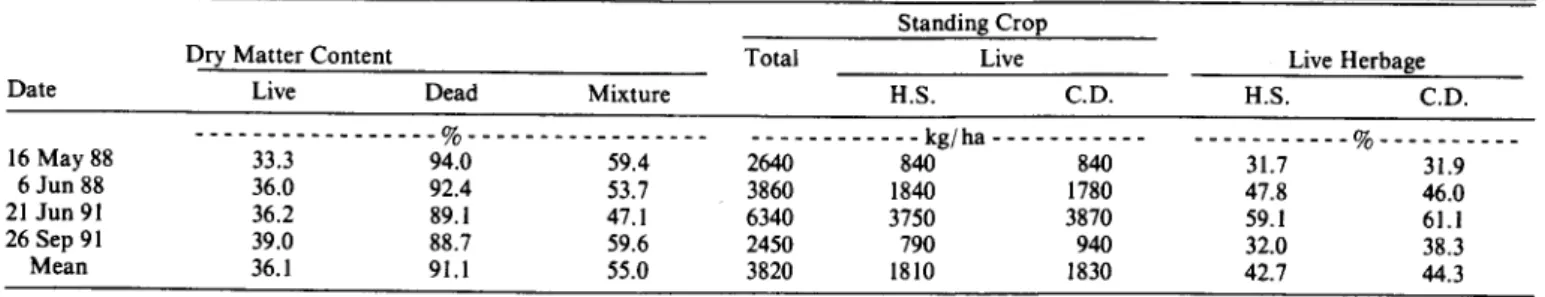
Table 4. Field trials for determination of live berbnge by hand separation (H-S.) and the constituent differential method (C.D.).
Date
Standing Crop
Dry Matter Content Total Live Live Herbage
Live Dead Mixture H.S. C.D. H.S. CD.
----_____________%_________________ ___________
16 May 88
____________kg/ha ___________%__________
33.3 94.0 59.4 2640 840 840 31.7 31.9
6 Jun 88 36.0 92.4 53.7 3860 1840 1780 47.8 46.0
21 Jun 91 36.2 89.1 47.1 6340 3750 3870 59.1 61.1
26Sep91 39.0 88.7 59.6 2450 790 940 32.0 38.3
Mean 36.1 91.1 55.0 3820 1810 1830 42.7 44.3
which encompassed a large amount of variability in standing crop, utilization, and 1ive:dead ratios. Sample sizes for dry matter determination of 40 to 50 are not a barrier because we clip these numbers of plots for our standing crop studies. Studies on smaller, more homogeneous areas should require smaller sample sizes for acceptable precision.
Samples for the live and dead components require fewer obser- vations than the mixtures to adequately characterize dry matter content (Fig. 5). In 80% of the trials, the precision criteria were met
Plots Required
Fig. 5. Cumulative frequency distribution of sample size required to esti- mate the mean with a deviation from the true mean of 5% or less with P=
0.05 for dry matter content of five and dead herbage components. Based on 33 field trials for both components.
with 11 and 5 observations for the live and dead components, respectively. These sample sizes would not depend as much on size of the study area since they consist of pure components. However, if large areas are being sampled, it would be best to spread the samples over the entire area to avoid the small possibility of bias due to site differences or time-of-day influence.
Accuracy in Field Trials
The 4 field trials covered a wide range of conditions in terms of date, total standing crop, and percent live herbage (Table 4). The average value for percent live herbage determined by hand separa- tion and the constituent differential method differed by only 1.6 percentage units, which is nonsignificant (DO. 10). Most of the error was associated with the trial of 26 Sep. 1991. Late in the growing season appears to be the time when the live and dead components are most thoroughly mixed. Many leaf blades consist of both live and dead material. This makes collection of pure live and dead samples more difficult and extra care must be taken in sorting. Earlier in the growing season, leaves are more likely to be all live or all dead even though live and dead leaves may be present
on the same tiller.
Hunter and Grant (1961) reported the constituent differential method using dry matter content overestimated the percent of live herbage by 6.4 percentage units in 6 field trials. When 1 trial was excluded because the herbage was noticeably damp when col- lected, the difference was reduced to 4.7 percentage units. Both values were statistically significant (P = 0.10). The percent of live herbage ranged from 55 to 85% in these trials. The constituent differential method overestimated the percent live herbage in 5 of 6 trials, which would suggest problems with damp conditions. The authors indicated such conditions limited the use of dry matter content in the constituent differential method in their region. Our errors were smaller and the constituent differential method should give adequate results under our conditions.
Conclusions
The constituent differential method using dry matter content for the determination of live and dead herbage components is feasible and useful under our study conditions. The main advantage of the method is its small labor requirement. The only additional effort required beyond normal standing crop sampling is field weighing of clipped samples and collection of pure samples of live and dead herbage. Weighing adds 30 to 60 seconds for each plot. Collecting pure samples takes 3 to 7 minutes per sample depending on the availability of the 2 components in the specific sample area. These requirements are minimal compared to time already spent sam- pling for total standing crop. In the laboratory, additional time is only required to weigh the pure samples. Performing the actual calculations for percent live and dead or standing crop of live and dead requires no more than 30 minutes computer time per sam- pling date. Hunter and Grant (1961) found the constituent differ- ential method to be the most rapid method for determining live and dead standing crop. Another advantage is no special equipment is required for the constituent differential method.
The successful application of the constituent differential method depends on several factors highlighted in this and other studies.
First, the herbage must be free of surface moisture and the dead herbage must not have excessive absorbed moisture. We begin sampling when the herbage feels completely dry to the touch. This often limits sampling to the late morning and afternoon hours.
Second, live and dead herbage samples must be as pure as possible.
We believe this factor can be a major source of error if field personnel are not conscientious. We also recommend a minimum of 20 g of live or dead herbage be collected for each individual sample because field weights are only recorded to the nearest gram.
Third, care must be taken to obtain accurate weights, especially in the field. If these factors are given proper consideration, the con- stituent differential method is a relatively rapid and accurate method for determining live and dead herbage fractions.
Literature Cited
Bonham, C.D. 1988. Measurements for terrestrial vegetation. John Wiley
& Sons, Inc., N.Y.
Cooper, C.S., D.N. Hyder, R.G. Peterson, and F.A. Snevr. 1957. The constituent differential method of estimating species composition in mixed hay. Agron. J. 49:190-193.
Heady, H.F., and G.M. Van Dyne. 1965. Prediction of weight composition from point samples on clipped herbage. J. Range Manage. 18: 144-148.
Hunter, R.F., and S.A. Grant. 1961. The estimation of “green dry matter”
in a herbage sample by methanol-soluble pigments. J. Brit. Grassl. Sot.
16:4345.
Johnson, M.K. 1986. Estimating ratios of live and dead plant material in clipped plots. J. Range Manage. 3990.
Lauenroth, W.K., J.L. Dodd, and C.E. Dickinson. 1980. Aboveground biomass dynamics of blue grama in a shortgrass steppe and evaluation of a method for separating live and dead. J. Range Manage. 33:210-212.
Moffat, H.H., and A.J. Conradi. 1979. Soil survey of Washita County, Oklahoma. USDA-SCS.
Myers, H. 1982. Climatological data of Stillwater, Oklahoma. 1893-1980.
Oklahoma Agr. Exp. Sta. Res. Resp. P-821.
Steel, R.&D., and J.H. Torrie. 1980. Principles and procedures of statis- tics. McGraw-Hill Book Co., N.Y.