Quantitative Explanation for Uphill Diffusion of Sn
during Reactive Diffusion between Cu–Sn Alloys and Nb
Tomomi Yamashina
1and Masanori Kajihara
2;*1
Graduate School, Tokyo Institute of Technology, Yokohama 226-8502, Japan
2Department of Materials Science and Engineering, Tokyo Institute of Technology
In a bronze method, uphill diffusion of Sn takes place from a binary Cu–Sn alloy to Nb3Sn during reactive diffusion between the Cu–Sn
alloy and Nb at temperatures around 1000 K. In order to account for the occurrence of the uphill diffusion quantitatively, the phase equilibria in the ternary Cu–Nb–Sn system were theoretically analyzed using a thermodynamic model for phases with different sublattices. In this ternary system, there is no ternary compound and the solubility of the third component is very small for all the phases. Consequently, the ternary interaction was assumed negligible, and thus the Gibbs energy of each phase was expressed with the thermodynamic parameters of the relevant binary systems. In an isothermal section calculated at 1053 K, the three-phase equilibrium of Cu + Nb + Nb3Sn appears at an activity of Sn
with 0.0047. If the activityab
Snof Sn for the binary Cu–Sn alloy is greater than the activityacSn of Sn for the three-phase equilibrium of
Cu + Nb + Nb3Sn, Nb3Sn is spontaneously produced owing to the reactive diffusion. As a result, the uphill diffusion of Sn occurs from the Cu–
Sn alloy to Nb3Sn. The chemical driving forceGSnfor the uphill diffusion is evaluated by the equationGSn¼RTlnðabSn=acSnÞ. This equation
semi-quantitatively explains the growth behavior of Nb3Sn.
(Received December 8, 2005; Accepted January 26, 2006; Published March 15, 2006)
Keywords: uphill diffusion, phase equilibria, calphad method, bronze method, superconductor
1. Introduction
A bronze method is widely used to manufacture multi-filamentary superconductor materials with Nb3Sn.1–9)In this
method, multifilamentary wires of Nb are embedded in a Cu– Sn alloy matrix and then annealed at an appropriate temper-ature. Owing to reactive diffusion during annealing, Nb3Sn is
formed as a layer at the interface between Nb and the Cu–Sn alloy. The growth behavior of the Nb3Sn layer was studied by
many investigators.1–9)However, monofilamentary and mul-tifilamentary diffusion couples were used in most of the studies. In such diffusion couples, the interdiffusion of the constituent components takes place in rather complicated manners, and hence the Nb3Sn layer with a uniform thickness
cannot be formed easily. Therefore, the filamentary diffusion couples are not adequate for examination of the kinetics for formation of the Nb3Sn layer.
The growth behavior of the Nb3Sn layer was
experimen-tally studied by Osamura et al. using a different type of diffusion couple.10) In their experiment, a Nb sheet was sandwiched between two plates of a binary Cu–7.4 at% Sn alloy. In this type of diffusion couple, the interdiffusion occurs along the direction perpendicular to the interface. The (Cu–7.4Sn)/Nb diffusion couple was annealed at temper-atures of 973–1073 K, and then the Nb3Sn layer with a rather
uniform thickness was observed to form at the interface. According to their observation, the mean thickness of the Nb3Sn layer is expressed as a power function of the annealing
time. The exponent of the power function is 0.33 at 973 and 1023 K and 0.51 at 1073 K. If the growth of the Nb3Sn layer
is governed by the volume diffusion of the constituent components in each phase, the exponent is equal to 0.5. On the contrary, the grain boundary diffusion across the Nb3Sn
layer will control the growth at low temperatures where the volume diffusion is actually frozen out. When the growth is
purely governed by the grain boundary diffusion and grain growth takes place in the Nb3Sn layer according to the
parabolic law, the exponent becomes 0.25.11) Here, the parabolic law means that the grain size of a growing compound layer increases in proportion to the square root of the annealing time. For the growth of the Nb3Sn layer, the
exponent is 0.33 at 973 and 1023 K and increases with increasing annealing temperature. At 1073 K, it becomes 0.5. The exponent 0.33 shows that the grain boundary diffusion contributes to the rate-controlling process and the grain growth occurs at certain rates at 973 and 1023 K. However, at 1073 K, the volume diffusion becomes predominant, and thus the exponent coincides with 0.5. Such temperature depend-ence of the exponent was discerned also for the growth of binary Cu–Sn compound layers during reactive diffusion between Cu and Sn at 433–473 K.12) Therefore, it may be expected that this type of rate-controlling process generally works in the bronze method.
A binary Cu–8.3 at% Sn alloy was used to examine experimentally the growth behavior of the Nb3Sn layer in a
previous study.13) In that experiment, the diffusion couple was prepared by sandwiching a Nb sheet between two plates of the Cu–Sn alloy and then annealed at temperatures of 923– 1053 K. Also for the (Cu–8.3Sn)/Nb diffusion couple, the mean thickness of the Nb3Sn layer is described as a power
function of the annealing time. Unlike the (Cu–7.4Sn)/Nb diffusion couple, however, the exponent of the power function is close to unity at 923 and 973 K and monotonically decreases from 0.96 to 0.77 with increasing annealing temperature from 973 to 1053 K. This means that the interface reaction is the rate-controlling process for the growth of the Nb3Sn layer at 923–973 K and the
interdiffu-sion contributes to the rate-controlling process at 973– 1053 K. Considering the observation for the (Cu–7.4Sn)/Nb diffusion couple, we may expect that the volume diffusion governs the interdiffusion at 1053 K but the grain boundary diffusion contributes to the interdiffusion at 923–1023 K.
*Corresponding author, E-mail: [email protected]
However, the observation for the (Cu–8.3Sn)/Nb diffusion couple indicates that the temperature dependence of the rate-controlling process recognized for the Cu/Sn and (Cu– 7.4Sn)/Nb diffusion couples does not work generally in the bronze method.
In the bronze method, Nb3Sn is formed due to the reactive
diffusion between Nb and a binary Cu–Sn alloy with a concentration of Sn even much smaller than 25 at%. This means that uphill diffusion of Sn occurs from the Cu–Sn alloy to Nb3Sn. In order to account for the occurrence of the uphill
diffusion quantitatively, the phase equilibria in the ternary Cu–Nb–Sn system have been theoretically analyzed in the present study. A thermodynamic model developed by Hillert and Staffansson14)has been used for the analysis. In the (Cu– 7.4Sn)/Nb diffusion couple,10)the grain boundary diffusion contributes to the rate-controlling process at 973–1023 K, and the volume diffusion governs the rate-controlling process at 1073 K. In such a case, the local equilibrium is realized at each moving interface during the reactive diffusion at 973– 1073 K. On the other hand, in the (Cu–8.3Sn)/Nb diffusion couple,13)the interface reaction is the rate-controlling process at 923–973 K, and the interdiffusion mainly governs the rate-controlling process at 1053 K. In this case, the local equilibrium at the moving interface cannot be actualized at 923–973 K, and hence the phase equilibria have a less physical meaning.15) Thus, the present analysis has been carried out at a temperature of 1053 K. On the basis of the phase equilibria, the driving force for the uphill diffusion will be estimated quantitatively.
2. Experimental Summary
As already mentioned in Section 1, the growth behavior of the Nb3Sn layer was experimentally examined for the (Cu–
7.4Sn)/Nb diffusion couple by Osamuraet al.10)and for the (Cu–8.3Sn)/Nb diffusion couple in a previous study.13)The experimental results for these diffusion couples will be summarized briefly in this section. For simplicity, however, the type of diffusion couple is hereafter merely denoted by the composition of the Cu–Sn alloy in the diffusion couple.
In those experiments, the mean thickness l of the Nb3Sn
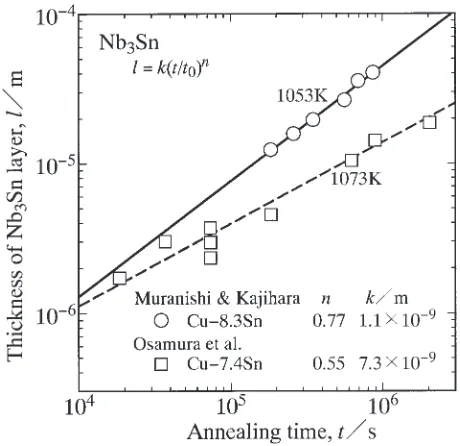
layer was determined as a function of the annealing time t. The results for the Cu–7.4Sn and Cu–8.3Sn diffusion couples are indicated as open squares and circles, respectively, in Fig. 1. In this figure, the ordinate and the abscissa show the logarithms oflandt, respectively. As can be seen in Fig. 1, the thickness l monotonically increases with increasing annealing time t. Furthermore, the plotted points for each diffusion couple lie well on a straight line. This indicates that
lis mathematically described as a power function oftby the equation
l¼kðt=t0Þn; ð1Þ
wheret0 is unit time, 1 s. It is adopted to make the ratiot=t0
dimensionless. The proportionality coefficientkhas the same dimension as the thickness l, but the exponent n is dimensionless. From the plotted points in Fig. 1, we obtain
k¼7:3109m and n¼0:55for the Cu–7.4Sn diffusion couple andk¼1:1109m andn¼0:77for the Cu–8.3Sn diffusion couple by the least-squares method. Using these
values of kand n,l was calculated as a function of t from eq. (1). The results for the Cu–7.4Sn and Cu–8.3Sn diffusion couples are shown as dashed and solid straight lines, respectively, in Fig. 1. As can be seen, the growth rate of the Nb3Sn layer is greater for the Cu–8.3Sn diffusion couple
than for the Cu–7.4Sn diffusion couple, even though the annealing temperature is lower by 20 K for the former diffusion couple than for the latter diffusion couple. Con-sequently, it is concluded that the addition of Sn with 1 at% into the Cu–7.4Sn alloy considerably accelerates the growth rate of the Nb3Sn layer at annealing temperatures around
1000 K.
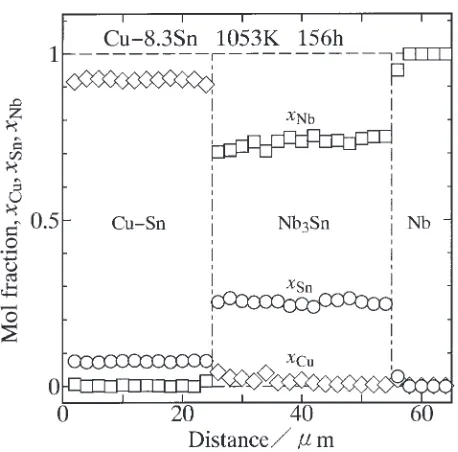
Typical concentration profiles of Cu, Nb and Sn across the Nb3Sn layer in the Cu–8.3Sn diffusion couple are shown as
open rhombuses, squares and circles, respectively, in Fig. 2. In this figure, the abscissa indicates the distance, and the ordinate shows the mol fractionxi of componenti(i¼Cu,
Nb, Sn). The annealing temperature and time of this diffusion couple are 1053 K and 156 h (5:62105s), respectively. As can be seen, the Nb3Sn layer with l¼30mmis recognized
between the Cu–Sn alloy and Nb. The concentration of Cu monotonically decreases from the Cu–Sn alloy to Nb, and that of Nb from Nb to the Cu–Sn alloy. However, the concentration of Sn is higher in the Nb3Sn layer than in the
Cu–Sn alloy. This means that the uphill diffusion of Sn occurs from the Cu–Sn alloy to the Nb3Sn layer.
3. Analysis
A thermodynamic model for phases with different sub-lattices was recently developed by Hillert and Staffansson.14) In this model, the fraction of sites in each sublattice occupied by a component is expressed by the site fraction. The sum of site fractions in each sublattice is equal to unity by definition. Their thermodynamic model was used to calculate the phase
Fig. 1 The thicknesslof the Nb3Sn layer versus the annealing timetfor
the Cu–8.3Sn diffusion couple at 1053 K in a previous study13)and for the
Cu–7.4Sn diffusion couple at 1073 K by Osamuraet al.10)Straight lines
[image:2.595.312.542.71.294.2]equilibria in the ternary Cu–Nb–Sn system. The expression of the Gibbs energy for each phase will be explained below.
3.1 Liquid, Fcc and Bcc
The Gibbs energyGmis described with a single-sublattice model for the liquid phase, the Cu-rich solid-solution phase with face-centered cubic (fcc), the Nb-rich solid-solution phase with body-centered cubic (bcc) and the bcc-
compound phase in the binary Cu–Sn system. It was assumed that Cu, Nb and Sn could substitute for one another on a single sublattice and there was no ternary interaction among these components. These assumptions result in the following equation forGm per mol of atoms.
Gm ¼yCuGCuþyNbGNbþySnGSn
þRTðyCulnyCuþyNblnyNbþySnlnySnÞ þEGm ð2Þ
Here, the excess Gibbs energyEGmis represented by
EG
m¼yCuyNbLCu,NbþyCuySnLCu,SnþyNbySnLNb,Sn: ð3Þ
In these equations,yidenotes the site fraction of componenti
on the sublattice. In the case of the single-sublattice model, however, the site fractionyicoincides with the mol fractionxi
of componenti. Furthermore,Tis the absolute temperature,R
is the gas constant, G
i is the molar Gibbs energy of pure
component i, and Li;j is the interaction parameter between
componentsiandjdescribed as a function of the composition according to a Redlich–Kister polynomial as follows.16)
Li;j¼0Li;jþ1Li;jðyiyjÞ þ2Li;jðyiyjÞ2
i;j¼Cu, Nb, Sn ð4Þ
The numerical value of G
i is given relative to the molar
enthalpy HSERi of a selected reference state for pure component or element i at 298.15 K. This state is denoted by SER (stable element reference).16)
3.2 Nb3Sn
According to the concentration profiles in Fig. 2, the solubility of Cu in Nb3Sn is very small. Thus, Nb3Sn was
assumed to be a binary Nb–Sn compound. The same assumption was applied to all the other Nb–Sn compounds. However, a different sublattice model was used for each compound. As to Nb3Sn, a two-sublattice model was adopted
according to a treatment by Toffolonet al.17)In this model, Nb and Sn can substitute for each other on both sublattices. The chemical formula of Nb3Sn is expressed as
(Nb,Sn)3(Nb,Sn). It yields the following expression of Gm for one formula unit.
Gm¼ysNby
t
Nb G
Nb:NbþysSny
t
Nb G
Sn:NbþysNby
t
Sn G
Nb:Sn
þysSnytSnGSn:SnþRT½3ðysNblny
s
Nbþy
s
Snlny
s
SnÞ
þytNblnytNbþySnt lnytSn þEGm ð5Þ
In this equation, ys
i is the site fraction of component i on
sublattices, andyt
iis that of componention sublatticet. Here,
the number of sites is three times greater for sublatticesthan for sublattice t. Furthermore, G
Nb:Nb and GSn:Sn are the Gibbs energies for hypothetical states where all of the sublattices are filled with Nb and Sn, respectively. On the other hand, G
Nb:Sn is the Gibbs energy for an ideal state where sublattices s and t are occupied by Nb and Sn, respectively, andG
Sn:Nbis that for a hypothetical state where sublatticessandtare filled with Sn and Nb, respectively. The excess Gibbs energyEGm in eq. (5) is described as
EG
m¼ysNby
s
Snðy
t
NbLNb,Sn:NbþytSnLNb,Sn:SnÞ
þytNbytSnðysNbLNb:Nb,SnþysSnLSn:Nb,SnÞ: ð6Þ
Here,Li;j:iis the interaction parameter between componentsi
and j on sublattice s with sublattice t occupied by only componenti, andLj:i;jis that between componentsiandjon
sublattice t with sublattice s filled with only component j. The colon distinguishes sublattices, and the comma separates components interacting in the same sublattice. The site fractionsys
iandytiare converted into the mol fractionxiby the
following equation.
xi¼ ð3ysiþy t
iÞ=4 ð7Þ
3.3 Nb6Sn5
A three-sublattice model was used for Nb6Sn5to express
the chemical formula as Nb24Sn16(Nb,Sn)4.17)In this model,
the following expression ofGm is obtained for one formula unit.
Gm¼yNbGNb:Sn:NbþySnGNb:Sn:Sn
þ4RTðyNblnyNbþySnlnySnÞ þEGm ð8Þ
According to a treatment by Toffolonet al.,17)EG
min eq. (8) is omitted also in the present study.
3.4 NbSn2
It is assumed by Toffolonet al.17)that NbSn2 is a binary
line compound. Their assumption was adopted also in the present study. Thus, Gm for NbSn2 becomes equal to the
Gibbs energyG
Nb:Snfor one formula unit.
Fig. 2 Concentration profiles of Cu, Nb and Sn across a Nb3Sn layer in the
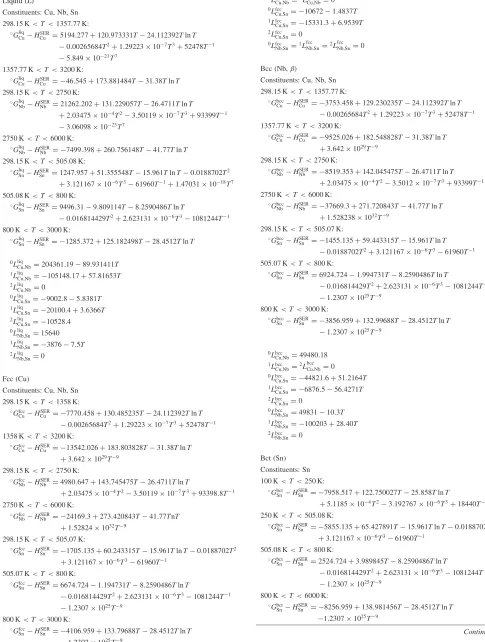
[image:3.595.55.284.67.293.2]Table 1 Summary of thermodynamic parameters. The numbers are in SI units withR¼8:31451J/molK.
Liquid (L)
Constituents: Cu, Nb, Sn 298.15 K<T<1357.77 K:
Gliq CuH
SER
Cu ¼5194:277þ120:973331T24:112392TlnT 0:00265684T2þ1:29223107T3þ52478T1 5:8491021T7
1357.77 K<T<3200 K: Gliq
CuHSERCu ¼ 46:545þ173:881484T31:38TlnT 298.15 K<T<2750 K:
Gliq NbH
SER
Nb ¼21262:202þ131:229057T26:4711TlnT
þ2:03475104T23:50119107T3þ93399T1 3:060981023T7
2750 K<T<6000 K: Gliq
NbHNbSER¼ 7499:398þ260:756148T41:77TlnT 298.15 K<T<505.08 K:
Gliq
SnHSnSER¼1247:957þ51:355548T15:961TlnT0:0188702T2 þ3:121167106T361960T1þ1:470311018T7 505.08 K<T<800 K:
Gliq
SnHSnSER¼9496:319:809114T8:2590486TlnT
0:016814429T2þ2:623131106T31081244T1 800 K<T<3000 K:
Gliq
SnHSnSER¼ 1285:372þ125:182498T28:4512TlnT
0Lliq
Cu,Nb¼204361:1989:931411T
1Lliq
Cu,Nb¼ 105148:17þ57:81653T
2Lliq Cu,Nb¼0
0Lliq
Cu,Sn¼ 9002:85:8381T
1Lliq
Cu,Sn¼ 20100:4þ3:6366T
2Lliq
Cu,Sn¼ 10528:4
0Lliq
Nb,Sn¼15640
1Lliq
Nb,Sn¼ 38767:5T
2Lliq Nb,Sn¼0
Fcc (Cu)
Constituents: Cu, Nb, Sn 298.15 K<T<1358 K:
Gfcc CuH
SER
Cu ¼ 7770:458þ130:485235T24:112392TlnT 0:00265684T2þ1:29223107T3þ52478T1 1358 K<T<3200 K:
Gfcc
CuHCuSER¼ 13542:026þ183:803828T31:38TlnT þ3:6421029T9
298.15 K<T<2750 K: Gfcc
NbHNbSER¼4980:647þ143:745475T26:4711TlnT
þ2:03475104T23:50119107T3þ93398:8T1 2750 K<T<6000 K:
Gfcc
NbHNbSER¼ 24169:3þ273:420843T41:77TnT þ1:528241032T9
298.15 K<T<505.07 K: Gfcc
SnHSnSER¼ 1705:135þ60:243315T15:961TlnT0:0188702T2 þ3:121167106T361960T1
505.07 K<T<800 K: Gfcc
SnHSnSER¼6674:7241:194731T8:2590486TlnT
0:016814429T2þ2:623131106T31081244T1 1:23071025T9
800 K<T<3000 K: Gfcc
SnHSnSER¼ 4106:959þ133:79688T28:4512TlnT 1:23071025T9
Continued
Table 1 (Continued)
0Lfcc
Cu,Nb¼88888:843:22785T
1Lfcc Cu,Nb¼2L
fcc Cu,Nb¼0
0Lfcc
Cu,Sn¼ 106721:4837T
1Lfcc
Cu,Sn¼ 15331:3þ6:9539T
2Lfcc Cu,Sn¼0
0Lfcc Nb,Sn¼1L
fcc Nb,Sn¼2L
fcc Nb,Sn¼0
Bcc (Nb,)
Constituents: Cu, Nb, Sn
298.15 K<T<1357.77 K: Gbcc
CuHSERCu ¼ 3753:458þ129:230235T24:112392TlnT 0:00265684T2þ1:29223107T3þ52478T1 1357.77 K<T<3200 K:
Gbcc CuH
SER
Cu ¼ 9525:026þ182:548828T31:38TlnT þ3:6421029T9
298.15 K<T<2750 K: Gbcc
NbHSERNb ¼ 8519:353þ142:045475T26:4711TlnT þ2:03475104T23:5012107T3þ93399T1 2750 K<T<6000 K:
Gbcc
NbHSERNb ¼ 37669:3þ271:720843T41:77TlnT þ1:5282381032T9
298.15 K<T<505.07 K: Gbcc
Sn HSERSn ¼ 1455:135þ59:443315T15:961TlnT 0:0188702T2þ3:121167106T361960T1 505.07 K<T<800 K:
Gbcc
Sn HSERSn ¼6924:7241:994731T8:2590486TlnT
0:016814429T2þ2:623131106T31081244T1 1:23071025T9
800 K<T<3000 K: Gbcc
Sn H SER
Sn ¼ 3856:959þ132:99688T28:4512TlnT 1:23071025T9
0Lbcc
Cu,Nb¼49480:18
1Lbcc Cu,Nb¼2L
bcc Cu,Nb¼0
0Lbcc
Cu,Sn¼ 44821:6þ51:2164T
1Lbcc
Cu,Sn¼ 6876:556:4271T
2Lbcc Cu,Sn¼0
0Lbcc
Nb,Sn¼4983110:3T
1Lbcc
Nb,Sn¼ 100203þ28:40T
2Lbcc Nb,Sn¼0
Bct (Sn)
Constituents: Sn 100 K<T<250 K:
Gbct
SnHSnSER¼ 7958:517þ122:750027T25:858TlnT
þ5:1185104T23:192767106T3þ18440T1 250 K<T<505.08 K:
Gbct
SnHSnSER¼ 5855:135þ65:427891T15:961TlnT0:0188702T2 þ3:121167106T361960T1
505.08 K<T<800 K: Gbct
SnH SER
Sn ¼2524:724þ3:989845T8:2590486TlnT
0:016814429T2þ2:623131106T31081244T1 1:23071025T9
800 K<T<6000 K: Gbct
SnHSnSER¼ 8256:959þ138:981456T28:4512TlnT 1:23071025T9
4. Results and Discussion
4.1 Isothermal section
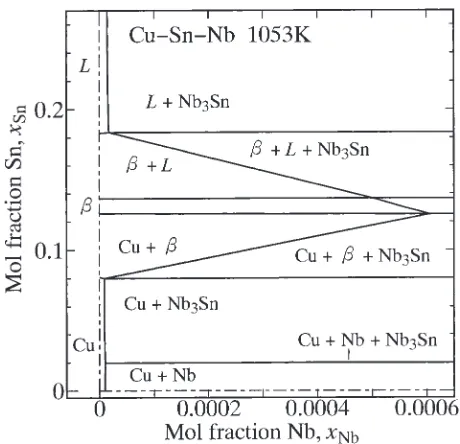
According to the sublattice models mentioned in the previous section, there is no ternary interaction among Cu, Nb and Sn in all the phases. Thus, the Gibbs energy Gm of each phase is described with the thermodynamic parameters of the relevant binary systems. The numerical values of the thermodynamic parameters in the binary Cu–Nb, Cu–Sn and Nb–Sn systems17–19) are listed in Table 1. In this table, however, the values are shown only for the phases stable at 1053 K. Using these values, an isothermal section at 1053 K of the phase diagram in the ternary Cu–Nb–Sn system was calculated by a technique reported in a previous study.20)The result is shown in Fig. 3. In this figure, the ordinate indicates the mol fraction xSn of Sn, and the abscissa shows the mol fraction xNb of Nb. Furthermore, the Cu-rich and Nb-rich solid-solution phases are merely denoted by Cu and Nb, respectively, and the liquid phase is indicated as L. In the present study, however, attention is focused on the phase equilibria relevant to the Cu, Nb and Nb3Sn phases.
There-fore, only an area at xSn<0:27of the isothermal section is indicated in Fig. 3. As can be seen in this figure, Nb3Sn is in
equilibrium with the Cu, Nb, and L phases. As a result, triangles for the three-phase equilibria of Cu + Nb + Nb3Sn, Cu + + Nb3Sn and L + + Nb3Sn appear in
the isothermal section. The calculation also indicates that the three-phase equilibria of L+ Nb3Sn + Nb6Sn5 and L+
Nb6Sn5 + NbSn2 emerge in an area at xSn>0:27 of the isothermal section. Such three-phase equilibria are actually observed at an experimental phase diagram in the ternary Cu–Nb–Sn system.21)
Since the solubility of Nb is very small for the Cu,andL
phases, the phase boundary of single-phase region is not clearly distinguishable for these phases in Fig. 3. Thus, an area atxNb<6:5104of Fig. 3 is magnified in Fig. 4. As can be seen, the solubility of Nb is aroundxNb¼1105for
the Cu phase,xNb¼5104{6104 for thephase and
xNb¼1:4105{1:8105 for theLphase. According to the result in Fig. 3, the solubility of Cu in the Nb phase is also very small. As already mentioned in the previous section, the ternary interaction is omitted for all the phases. For phases with small solubility of the third component, the ternary interaction is actually considered negligible.
4.2 Activity Diagram
The kinetics of reactive diffusion is theoretically analyzed for a hypothetical binary A–B system consisting of two primary solid-solution phases and one compound phase in a previous study.22) In that analysis, the growth of the
Fig. 3 Area atxSn<0:27of isothermal section calculated at 1053 K in the
ternary Cu–Nb–Sn system.
[image:5.595.312.543.71.293.2]Fig. 4 Magnified area atxNb<6:5104 of the isothermal section in
Fig. 3. Table 1 (Continued)
Nb3Sn
2 sublattices, sites 3:1 Constituents: Nb, Sn: Nb, Sn
GNb3Sn Nb:Nb4G
bcc
Nb¼20000þ37T GNb3Sn
Sn:Nb3G bct SnG
bcc
Nb¼86260þ20000þ37Tþ27T GNb3Sn
Nb:Sn3GbccNbGbctSn¼ 66260þ37T27T GNb3Sn
Sn:Sn 4GbctSn¼20000þ37T LNb3Sn
Nb:Nb,Sn¼179808142T LNb3Sn
Sn:Nb,Sn¼LNb3SnNb,Sn:Nb¼LNb3SnNb,Sn:Sn¼0
Nb6Sn5
3 sublattices, sites 24:16:4 Constituents: Nb: Sn: Nb, Sn
GNb6Sn5 Nb:Sn:Nb28G
bcc Nb16G
bct
Sn¼200086:5 GNb6Sn5
Nb:Sn:Sn24G bcc Nb20G
bct
Sn¼ 651845:7þ80:95T
NbSn2
2 sublattices, sites 1:2 Constituents: Nb: Sn
GNbSn2 Nb:SnG
bcc Nb2G
bct
[image:5.595.311.541.353.575.2]compound layer formed at the interface between the two primary solid-solution phases with a semi-infinite thickness is mathematically described with diffusion equations. The analysis indicates that the growth rate of the compound layer is predominantly determined by the interdiffusion across the compound layer. The interdiffusion coefficient Dis related with the intrinsic diffusion coefficients DA and DB of
components A and B, respectively, by the following equa-tion.23)
D¼xBDAþxADB ð9Þ
Here,xAandxBare the mol fractions of componentsAandB,
respectively. As already shown in Fig. 2, the solubility of Cu is very small for Nb3Sn in the ternary Cu–Nb–Sn system.
Thus, the growth rate of the Nb3Sn layer is affected
predominantly by the diffusional fluxes of Nb and Sn but scarcely by that of Cu. As a consequence, Nb3Sn is
approximately considered as a binary Nb–Sn compound. For the binary Nb3Sn phase withxNb¼0:75andxSn¼0:25, the interdiffusion coefficient Dis related with the intrinsic diffusion coefficientsDNbandDSnof Nb and Sn, respective-ly, as D¼xSnDNbþxNbDSn¼0:25DNbþ0:75DSn by eq. (9). The observation by Osamura et al.10) implies that
DSn is much greater than DNb and thus D0:75DSn. This means that the intrinsic diffusion of Sn governs the interdiffusion across the Nb3Sn layer and thus the growth
rate of the Nb3Sn layer. In quantitative explanation for the
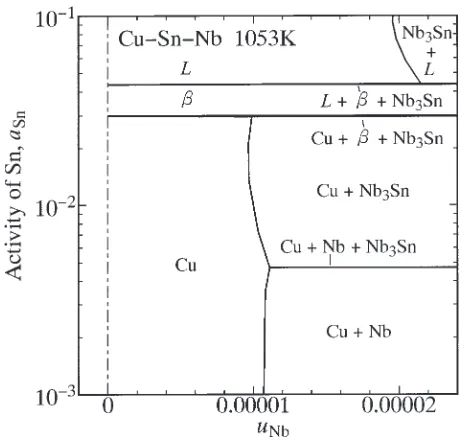
occurrence of the uphill diffusion, it is convenient to consider the activity instead of the composition. Consequently, the isothermal section in Fig. 3 is represented in a different manner in Fig. 5. In this figure, the ordinate indicates the activityaSnof Sn with a reference state of theLphase of pure Sn, and the abscissa shows the compositional parameteruNb between Nb and Cu defined as uNb¼xNb=ðxNbþxCuÞ. In such an activity diagram, a three-phase equilibrium is shown as a horizontal straight line but not a triangle. As can be seen in Fig. 5, the activity of Sn isaSn¼0:0047, 0.030 and 0.044
for the three-phase equilibria of Cu + Nb + Nb3Sn, Cu + + Nb3Sn and L + + Nb3Sn, respectively. As
men-tioned earlier, however, the solubility is very small for Nb in the Cu,andLphases and for Cu in the Nb phase. Thus, the single-phase regions of the, Cu and Nb phases in Fig. 5 are magnified in Figs. 6, 7 and 8, respectively. As already shown in Fig. 4, the solubility of Nb is greater in thephase than in theLand Cu phases. As a result, in Fig. 6, the,Land Nb3Sn
phases construct a peritectic type of invariant reaction, whereas the , Cu and Nb3Sn phases compose a eutectoid
type of invariant reaction. Therefore, the phase is only stable between these two invariant reactions. On the contrary, in Fig. 7, the Cu phase is in equilibrium with the Nb and Nb3Sn phases as well as thephase. The activity of Sn for
the three-phase equilibrium of Cu + Nb + Nb3Sn is greater
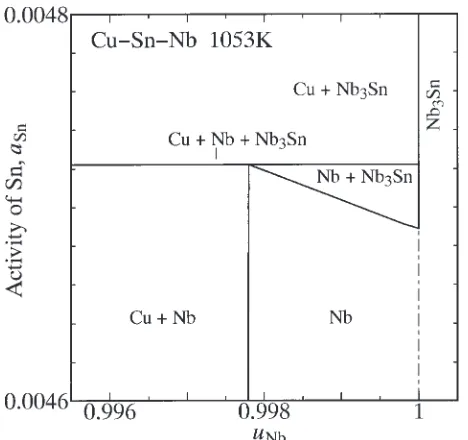
than that for the Cu + Nb two-phase region but smaller than that for the Cu + Nb3Sn two-phase region. At the Nb-rich Fig. 5 ActivityaSnof Sn versus compositional parameteruNb
correspond-ing to the result in Fig. 3.
[image:6.595.54.287.69.290.2] [image:6.595.311.539.70.278.2] [image:6.595.311.541.318.538.2]corner in Fig. 8, the solubility of Cu is very small in the Nb phase, but completely zero in Nb3Sn according to the
assumption. As a consequence, the Cu, Nb and Nb3Sn phases
construct a peritectoid type of invariant reaction. On the basis of the phase equilibria in Figs. 6–8, the characteristic feature of the activity diagram in Fig. 5 is schematically indicated in Fig. 9. In this figure, however, each single-phase region is exaggerated extremely. Furthermore, a capable diffusion path in the bronze method is sketchily depicted as a dotted curve. An open circle shows the activity of Sn for a binary Cu–Sn alloy, and an open triangle indicates that for pure Nb. Since the activity of Sn monotonically decreases from the open circle to the open triangle along the dotted curve in Fig. 9, the diffusion of Sn spontaneously occurs from the binary Cu–Sn alloy to pure Nb through Nb3Sn. This is the
reason why the uphill diffusion of Sn takes place from the Cu–Sn alloy to Nb3Sn.
4.3 Comparison with Observation
Since the activity of Sn is surely greater for the binary Cu– Sn alloy than for pure Nb, we may expect that Nb3Sn is
always produced in the bronze method. In order for Nb3Sn to
form spontaneously, however, the activity of Sn should be greater for the Cu–Sn alloy than for the three-phase equilibrium of Cu + Nb + Nb3Sn. In Fig. 9, abSn is the activity of Sn for the Cu–Sn alloy, and acSn is that for the three-phase equilibrium of Cu + Nb + Nb3Sn. Furthermore,
open squares and rhombuses illustrate the local equilibria at the Cu/Nb3Sn and Nb3Sn/Nb interfaces, respectively. The
difference between the activities of Sn for the open squares and rhombuses causes the driving force for the diffusion of Sn across the Nb3Sn layer. However, the locations of the
open squares and rhombuses cannot be determined only from the activity diagram in Fig. 5. For the determination, mobility of each component should be known for all the phases. On the other hand, the driving force for the spontaneous formation of Nb3Sn is attributed to the
differ-ence between the values ofab
SnandacSn. In this case, bothabSn andac
Snare evaluated from the activity diagram.
The formation of Nb3Sn was experimentally studied at
923–1123 K by Wada et al.5) using various (Cu–Sn)/Nb diffusion couples with different compositions. In their experiment, binary Cu–Sn alloys with xSn¼0:035, 0.05, 0.06 and 0.07 were used to prepare the diffusion couples. After annealing for 100 h, Nb3Sn was observed to form at
1023–1123 K for xSn¼0:035 and at 923–1123 K for
xSn¼0:05, 0.06 and 0.07. Thus, Nb3Sn will be formed also
at 1053 K for all the compositions. Using the thermodynamic parameters in Table 1,ab
Sn is calculated by the equation 24)
abSn¼ySnexpðf=RTÞ; ð10Þ
where f is defined as
f GfccSn GliqSn
þyCu2½0LfccCu,Snþ
1Lfcc
Cu,SnðyCu3ySnÞ: ð11Þ
For the Cu phase with the single-sublattice,ySnandyCuare readily obtained from xSn by the equations ySn¼xSn and
yCu¼1xSn, respectively. From eqs. (10) and (11), values of ab
Sn¼0:0093, 0.015, 0.019 and 0.024 are evaluated for
xSn¼0:035, 0.05, 0.06 and 0.07, respectively, at 1053 K. Since these values of ab
Sn are greater than acSn¼0:0047, Nb3Sn can be produced spontaneously in all the diffusion
couples.
A similar experiment was carried out at 973–1123 K by Reddi et al.8)They used binary Cu–Sn alloys with compo-sitions of xSn¼0:0109{0:0613 for preparation of various (Cu–Sn)/Nb diffusion couples. After annealing up to 226 h, Nb3Sn was observed to form for xSn¼0:0179, 0.0246, 0.0387, 0.0466 and 0.0613 at 1023 K and forxSn¼0:0109, 0.0179, 0.0246, 0.0387 and 0.0466 at 1123 K. Hence, Nb3Sn
may be produced for xSn¼0:0179{0:0613 also at 1053 K. From eqs. (10) and (11), values of ab
Sn¼0:0042, 0.0061, 0.0106, 0.0136 and 0.0199 are evaluated for xSn¼0:0179, 0.0246, 0.0387, 0.0466 and 0.0613, respectively, at 1053 K.
Fig. 8 Single-phase region of the Nb phase in Fig. 5.
[image:7.595.53.287.70.290.2] [image:7.595.54.283.336.555.2]Since most of the values exceptabSn¼0:0042are greater than
ac
Sn¼0:0047, the evaluation rather quantitatively explains the observation by Reddiet al.8)
The value ofac
Snis predominantly determined by the phase stability of Nb3Sn in the binary Nb–Sn system. The phase
stability of Nb3Sn was carefully considered in an assessment
of the thermodynamic parameters in the binary Nb–Sn system by Toffolonet al.17)In their assessment, the enthalpy of formation for Nb3Sn was experimentally measured by
themselves. Although experimental information was not available for the activities of Sn and Nb, their thermodynamic parameters deduced reliable phase equilibria relevant to Nb3Sn in the binary Nb–Sn system. On the other hand, in the
binary Cu–Sn system, the activity of Sn in the Cu phase was experimentally determined by Alcock and Jacob25) and by Sommer et al.26) Such experimental results were used by Shim et al.19) for an assessment of the thermodynamic parameters in the binary Cu–Sn system. Their thermody-namic parameters provide values ofab
Snslightly smaller than the experimental results. This may be one of the reasons why
ab
Sn¼0:0042 for xSn¼0:0179 is slightly smaller than
ac
Sn¼0:0047. However, the difference between abSn¼
0:0042 and ac
Sn¼0:0047 is rather small. Therefore, it is concluded that the thermodynamic parameters in Table 1 result in satisfactorily reliable phase stability of Nb3Sn in the
ternary Cu–Nb–Sn system.
As mentioned earlier, the formation of Nb3Sn was
experimentally observed at 973–1073 K for the Cu–7.4Sn diffusion couple by Osamuraet al.10)and at 923–1053 K for the Cu–8.3Sn diffusion couple in a pervious study.13)From eqs. (10) and (11), a value of ab
Sn¼0:026 is evaluated for
xSn¼0:074at 1053 K. According to the isothermal section in Fig. 4, however, the solubility of Sn in the Cu phase of the binary Cu–Sn system is xSn¼0:081 at 1053 K. Hence, the compositionxSn¼0:083is located in the Cu +two-phase region. Actually, a small amount of thephase was observed in the Cu–8.3Sn alloy at 1053 K.13)From the activity diagram in Fig. 6, a value ofab
Sn¼0:030is obtained for the Cu + two-phase region in the binary Cu–Sn system. Since both values of ab
Sn¼0:026 and 0.030 are much greater than
acSn¼0:0047, Nb3Sn is spontaneously produced in the Cu–
7.4Sn and Cu–8.3Sn diffusion couples at 1053 K. The chemical potentials GbSn and GcSn of Sn for the binary Cu– Sn alloy and the three-phase equilibrium of Cu + Nb + Nb3Sn are related withabSnanda
c
Snby the equations
GbSn¼GfccSn þRTlnabSn ð12aÞ
and
GcSn¼GfccSn þRTlnacSn; ð12bÞ
respectively. Thus, the chemical driving forceGSnfor the uphill diffusion of Sn is evaluated by the following equation.
GSn¼GbSnG c
Sn¼RTlnða b Sn=a
c
SnÞ ð13Þ
WhenabSn is greater than acSn,GSn takes a positive value. The positive value of GSn also yields the spontaneous formation of Nb3Sn. The greater the value ofGSn is, the faster the formation of Nb3Sn occurs. InsertingabSn¼0:026 and 0.030 andacSn¼0:0047into eq. (13), we obtainGSn¼
15and 16 kJ/mol for the Cu–7.4Sn and Cu–8.3Sn diffusion
couples, respectively, at 1053 K. Thus,GSn is greater for the latter diffusion couple than for the former diffusion couple. This is the reason why the growth rate of the Nb3Sn
layer is greater in the Cu–8.3Sn diffusion couple than in the Cu–7.4Sn diffusion couple as shown in Fig. 1. In order to analyze the growth rate theoretically, the mobility should be known for each component in all the phases. Unfortunately, however, such information is very limited in the ternary Cu– Nb–Sn system.
5. Conclusions
The uphill diffusion of Sn occurs from the binary Cu–Sn alloy to Nb3Sn during annealing at temperatures around
1000 K in the bronze method. In order to explain the occurrence of the uphill diffusion quantitatively, the phase equilibria in the ternary Cu–Nb–Sn system were theoretically analyzed using the thermodynamic model developed by Hillert and Staffansson.14) Since the solubility of the third component is very small for all the phases, the ternary interaction was assumed negligible. Thus, the Gibbs energy
Gm of each phase was described with the thermodynamic parameters of the relevant binary systems. An isothermal section at 1053 K of the phase diagram in the ternary Cu–Nb– Sn system was calculated by the technique reported in a previous study.20)In the isothermal section, the three-phase equilibrium of Cu + Nb + Nb3Sn appears at an activity of
Sn with 0.0047. When the activityabSn of Sn for the binary Cu–Sn alloy is greater than the activity acSn of Sn for the three-phase equilibrium of Cu + Nb + Nb3Sn, Nb3Sn is
spontaneously formed due to the reactive diffusion between the Cu–Sn alloy and Nb. In such a case, the uphill diffusion of Sn takes place from the Cu–Sn alloy to Nb3Sn. The chemical
driving forceGSnfor the uphill diffusion is evaluated by the equation GSn¼RTlnðabSn=acSnÞ. This equation also pro-vides a semi-quantitative explanation for the growth behavior of Nb3Sn.
Acknowledgements
The authors are grateful to Messrs. S. Meguro, K. Wada and H. Sakamoto at Furukawa Electric Co. Ltd., Japan for stimulating discussions. They also wish to thank Professor H. Ohtani at Kyushu Institute of Technology, Japan and Ms. T. Yamashita at JFE Steel Co., Japan for valuable comments. Thanks are due to Professor R. Kainuma and Professor X. J. Liu at Tokohu University, Japan for their helpful information of the thermodynamic parameters. The present study was supported by Furukawa Electric Co. Ltd. The study was also partially supported by a Grant-in-Aid for Scientific Research from the Ministry of Education, Culture, Sports, Science and Technology of Japan.
REFERENCES
1) H. H. Farrell, G. H. Gilmer and M. Suenaga: J. Appl. Phys.45(1974) 4025–4035.
2) H. H. Farrell, G. H. Gilmer and M. Suenaga: Thin Solid Films25
(1975) 253–264.
3) H. Dew-Hughes, T. S. Luhman and M. Suenaga: Nucl. Technol.29
4) S. Murase, Y. Koike and H. Shiraki: J. Appl. Phys.49(1978) 6020– 6026.
5) H. Wada, M. Kimura and K. Tachikawa: J. Mater. Sci.13(1978) 1943– 1950.
6) K. Kwasnitza, A. V. Narlikar, H. U. Nissen and D. Salathe´: Cryogenics (1980) 715–718.
7) P. Upadhyay, S. B. Samanta and A. V. Narlikar: Mater. Res. Bull.16
(1981) 741–748.
8) B. V. Reddi, V. Raghavan, S. Ray and A. V. Narlikar: J. Mater. Sci.18
(1983) 1165–1173.
9) C. C. Cheng and J. D. Verhoeven: J. Less-Com. Met.139(1988) 15–27. 10) K. Osamura, S. Ochiai, S. Kondo, M. Namatame and M. Nosaki:
J. Mater. Sci.21(1986) 1509–1516.
11) Y. L. Corcoran, A. H. King, N. de Lanerolle and B. Kim: J. Electron. Mater.19(1990) 1177–1183.
12) T. Takenaka, S. Kano, M. Kajihara, N. Kurokawa and K. Sakamoto: Mater. Sci. Eng. A396(2005) 115–123.
13) Y. Muranishi and M. Kajihara: Mater. Sci. Eng. A404(2005) 33–41. 14) M. Hillert and L.-I. Staffansson: Acta Chem. Scand.24(1970) 3618–
3626.
15) A. P. Sutton and R. W. Balluffi:Interfaces in Crystalline Materials (Oxford Science Publications, Clarendon Press, Oxford, 1995) pp. 603– 604.
16) M. Hillert:Computer Modeling of Phase Diagrams, ed. L. H. Bennett (TMS-AIME, Warrendale, PA, 1986) pp. 1–17.
17) C. Toffolon, C. Servant, J. C. Gachon and B. Sundman: J. Phase Equil.
23(2002) 134–139.
18) A. Dinsdale: Calphad15(1991) 317–425.
19) J.-H. Shim, C.-S. Oh, B.-J. Lee and D. N. Lee: Z. Metallkd.87(1996) 205–212.
20) M. Kajihara and M. Hillert: Metall. Trans. A21A(1990) 2777–2787. 21) W. L. Neijmeijer and B. H. Kolster: Z. Metallkd.78(1987) 730–737. 22) M. Kajihara: Acta Mater.52(2004) 1195–1200.
23) L. S. Darken and R. W. Gurry:Physical Chemistry of Metals (McGraw-Hill, New York, NY, 1953) p. 457.
24) N. Goukon, T. Ikeda and M. Kajihara: Acta Mater.48(2000) 2959– 2968.
25) C. B. Alcock and K. T. Jacob: Acta Metall.22(1974) 539–544. 26) F. Sommer, W. Balbach and B. Predel: Thermochim. Acta33(1979)