ORIGINAL ARTICLE
Personal exposure to static and time-varying
magnetic
fi
elds during MRI procedures in clinical
practice in the UK
Evridiki Batistatou,
1Anna Mölter,
2Hans Kromhout,
3Martie van Tongeren,
4Stuart Crozier,
5Kristel Schaap,
3Penny Gowland,
6Stephen F Keevil,
7,8Frank de Vocht
9▸Additional material is published online only. To view please visit the journal online (http://dx.doi.org/10.1136/ oemed-2015-103194).
For numbered affiliations see end of article.
Correspondence to Dr Frank de Vocht, School of Social and Community Medicine, University of Bristol, Canynge Hall, 39 Whatley Road, Bristol BS8 2PS, UK; [email protected]
Received 17 July 2015 Revised 15 October 2015 Accepted 28 October 2015 Published Online First 16 December 2015
To cite:Batistatou E, Mölter A, Kromhout H,et al. Occup Environ Med 2016;73:779–786.
ABSTRACT
Background MRI has developed into one of the most important medical diagnostic imaging modalities, but it exposes staff to static magneticfields (SMF) when present in the vicinity of the MR system, and to radiofrequency and switched gradient electromagnetic
fields if they are present during image acquisition. We measured exposure to SMF and motion-induced time-varying magneticfields (TVMF) in MRI staff in clinical practice in the UK to enable extensive assessment of personal exposure levels and variability, which enables comparison to other countries.
Methods 8 MRI facilities across National Health Service sites in England, Wales and Scotland were included, and staff randomly selected during the days when measurements were performed were invited to wear a personal MRI-compatible dosimeter and keep a diary to record all procedures and tasks performed during the measured shift.
Results 98 participants, primarily radiographers (71%) but also other healthcare staff, anaesthetists and other medical staff were included, resulting in 149
measurements. Average geometric mean peak SMF and TVMF exposures were 448 mT (range 20–2891) and 1083 mT/s (9–12 355 mT/s), and were highest for radiographers (GM=559 mT and GM=734 mT/s). Time-weighted exposures to SMF and TVMF (GM=16 mT (range 5–64) and GM=14 mT/s (range 9–105)) and exposed-time-weighted exposures to SMF and TVMF (GM=27 mT (range 11–89) and GM=17 mT/s (range 9– 124)) were overall relative low—primarily because staff were not in the MRI suite for most of their shifts—and did not differ significantly between occupations.
Conclusions These results are comparable to the few data available from the UK but they differ from recent data collected in the Netherlands, indicating that UK staff are exposed for shorter periods but to higher levels. These data indicate that exposure to SMF and TVMF from MRI scanners cannot be extrapolated across countries.
INTRODUCTION
Magnetic resonance imaging (MRI) has developed into one of the most important medical diagnostic imaging modalities and has an important role in preclinical research in, for example, the pharma-ceutical industry. The advantages of MRI include
demonstrable clinical benefits as well as elimination of ionising radiation exposure for both patients and healthcare workers. An estimated 60 million MRI scans are performed annually worldwide,1and the growing importance of the modality is illustrated by the number of scanners in the UK, which has increased from approximately 10 in 1991 to over 500 in 2008, doing over 1.4 million scans a year (2.5% of the population having a scan annually).2 Thisfigure has further increased subsequently with additional scanners purchased by the UK National Health Service (NHS).3Alongside increased use of MRI, the strength of the magnetic field used has increased from as low as 0.04 tesla (T) in the 1980s to up to 11.7 T with the introduction of ultra-high field scanner systems.4
Despite the advantages of MRI, a potential dis-advantage is increased exposure of patients and staff to static magnetic fields (SMFs) as well as radiofrequency and switched gradient electromag-neticfields (EMF). MRI staff are exposed to static fields when present in the vicinity of the MR system during, for example, patient positioning
What this paper adds
▸ Staff working with MRI are exposed to static magneticfields and motion-induced
time-varying magneticfields when present near MR systems.
▸ Data on personal exposure of MRI staff in clinical practice to static and motion-induced time-varying magneticfields are scarce ▸ In this UK-based study, time-weighted average
exposure was highest for MR radiographers, compared to other healthcare staff, anaesthetists and other medical staff. ▸ Exposure patterns were comparable between
the UK and the Netherlands, but levels and correlations between different exposure metrics differed substantially.
prior to scanning. Exposure to switched gradientfields may also occur when staff are present during image acquisition; for example, during interventional procedures guided by MRI, anaesthetists monitoring anaesthetised patients or nurses accom-panying anxious or young patients.5 Medical diagnosis using MRI is now the main source of exposure of humans to high SMFs, and while in, for example, welding, aluminium produc-tion, the chloralkali industry and direct current train systems6 people are exposed to SMFs in the microtesla (μT) range, MRI in routine clinical settings exposes patients to SMFs in the range of 0.5 to 3.0 T, while personnel are exposed in the millitesla (mT) to tesla range.7 Exposure will most likely continue to increase in the future because of increase in the number of scans, advent of systems with stronger fields, and development of new interventional procedures guided by real-time MRI.8
Subclinical effects on well-being have been reported by staff routinely working with MRI.9–13 Recently, increased risk of accidents among MR engineers has also been reported.14 However, epidemiological data on the long-term health effects of protracted exposure to the magneticfields required for MRI are non-existent and therefore, it cannot entirely be ruled out that such effects may exist.6 In controlled trials, exposure of humans and animals to magnetic fields—more specifically to temporal changes in SMF exposure caused by movement in the static fields around MRI scanners—has been associated with acute and temporal neurobehavioural effects15–19and biological mechanisms for these interactions have been proposed.20–22
To address the acute effects, limits on exposure to static and time-varying electromagnetic fields have been proposed by various organisations, including the International Commission on Non-ionizing Radiation Protection (ICNIRP)23 and in the UK, the National Radiological Protection Board (NRPB).24 In the European Union, The Physical Agents (EMF) Directive (2013/35/EU), which is largely based on the ICNIRP guidelines, will need to be implemented by member states by 1 July 2016.25 In this Directive, MRI is considered as a controlled environment and is subject to a specific, non-discretionary dero-gation from exposure limits during the installation, testing, use, development, maintenance of or research related to MRI equip-ment for patients in the health sector, and as long as certain conditions are met. However, due to the absence of data, at present these exposure limit values explicitly exclude consider-ation of long-term health effects.
It is important to collect data on exposure of staff to SMFs, and to time-varying magneticfields as a result of movement in the strayfields surrounding MRI systems, both to assess compli-ance with exposure limits and for (future) epidemiological studies to determine whether protracted occupational exposure may be associated with adverse health effects. Exposure to SMF has been estimated using a variety of methods,10 26–29but only recently have personal dosimeters become available that enable individual measurement. Only limited data are currently avail-able on actual personal occupational exposure levels. In the Netherlands, personal exposure studies have been conducted in human MRI facilities, experimental animal research and veterin-ary clinics,29and specifically for engineers in an MRI manufac-turing department.10 Other studies have been conducted in the UK (for MRI radiographers),30in Australia (for a small number of healthcare workers),31in Spain (for extremely low frequency magneticfields, rather than SMFs, for hospital personnel),32in Japan for four technologists only,33and for nurses during con-trast administration in Poland.34Since it is known that standard MRI procedures can differ between countries, for example, for administration of contrast medium in the Netherlands compared
to Poland,29 34 extrapolating results from one country to the other may not be possible.
This paper describes the results of a large personal exposure measurement survey among healthcare staff routinely working with MRI throughout the UK. Here, we will assess MRI-related exposure to static and motion-induced time-varying magnetic fields, variability in this exposure between different occupations and between workers with the same occupations.
MATERIALS AND METHODS Study design
MRI facilities across NHS sites in England, Wales and Scotland were invited to participate in the study through researchers’ contacts and via an open call for participants at the Institute of Physics and Engineering in Medicine (IPEM) annual conference (2012). Once a site had agreed to participate, a researcher (AM or FV) visited the site on 2–5 consecutive days. Staff working in the MRI facility on the days of the visits were asked to partici-pate in the study. On arrival of the staff in the morning, all were provided with a study information sheet and written consent was obtained prior to distributing any questionnaires and con-ducting measurements. The number of participants measured on a given day was limited by the number of available dosimeters; this was generally three, although for some site visits six dosi-meters were available.
Ethical approval was obtained from the University of Manchester’s Research Ethics Committee (reference number: 12066) and NHS R&D approval was obtained individually for each of the participating sites.
Data acquisition
Personal exposure to SMF (B) and to motion-induced time-varying magneticfields (dB/dt) was measured during work shifts in the MRI facilities, using personal dosimeters with a reso-lution of ±0.5 mT and ±2 mT/s, and an accuracy of ±10 mT (50 mT between 1 and 7 T) and ±10 mT/s for staticfield and gradientfield measurements, respectively (Magnetic Dosimeter, University of Queensland31). The dosimeter was worn on the hip (on participant’s preferred side) of the participant for the entire duration of the shift.
Each personal dosimeter measured, simultaneously, the SMF (Bx,y,z) and temporal changes in the SMF (dBx,y,z/dt) in all three orthogonal directions (x, y, z) with a sampling frequency of 50 Hz. The datafiles were converted to textfiles and through averaging, reduced to a measurement rate of 10 Hz to enable data handling. The exposure values of B (in mT) and dB/dt (in mT/s) were calculated using the following formulae:
B¼ ffiffiffiffiffiffiffiffiffiffiffiffiffiffiffiffiffiffiffiffiffiffiffiffiffiffiffiffiffiffi(B2 xþB2yþB2z)
q
ð1Þ
and
dB dt¼
ffiffiffiffiffiffiffiffiffiffiffiffiffiffiffiffiffiffiffiffiffiffiffiffiffiffiffiffiffiffiffiffiffiffiffiffiffiffiffi
dB dt2xþ
dB dt2yþ
dB dt2z
! v
u u
t ð2Þ
In this study, second generation dosimeters were used, removing the need to correct for baseline drift as in previous studies using first generation dosimeters.29
number between 0.05 mT (the average value of the earth’s mag-netic field) and 10 mT. There was no need to impute dB/dt values for LOD.
Questionnaire and diary
A baseline questionnaire was completed on the first measure-ment day by all participants. The questionnaire included ques-tions regarding current job title, occupation history, types of MRI systems used, personal characteristics and incidence of symptoms that might be related to exposure. A work practice diary was also provided to each participant to keep a record of all procedures that required access to the MRI suite on the measurement days and details of the MRI systems used. The questionnaires and associations with effects on health and well-being were reported in more detail in de Vochtet al.9
For the purpose of the analyses in this paper, occupations were aggregated into four groups: radiographers, other health-care professionals (OHCP) (eg, radiographer assistants and staff nurses), medical staff (eg, consultant cardiologists and clinical fellows) and anaesthetists; although anaesthetists are also medical staff, they were classified separately because a priori we expected that their exposure would differ significantly from that of other medical staff due to the nature of the tasks performed.
Statistical analysis
As the exposure data was positively skewed, all data were log-transformed prior to analysis. For each measurement file, we calculated the following B and dB/dt exposure metrics: instant-aneous peak, shift-weighted average (SWA) and exposure-weighted average (XWA) exposures; the latter being calculated by post hoc processing of the data as average exposure during the periods that the staff were in the MRI room, thus exclud-ing, for example, periods of image acquisition when staff were in a separate control room. For each exposure metric, we esti-mated the arithmetic mean (AM) and the geometric mean (GM). Also, we estimated the within-person and between-person geometric standard deviation (GSD) and Pearson correl-ation coefficients between the exposure metrics. In addition, and for comparability with the study in the Netherlands,29 the probability ( p) of non-compliance with exposure limit values from the European Union Physical Agents (EMF) Directive was also estimated. Peak B exposure was compared to the 2 and 8 T exposure limit values for instantaneous peak B exposure. Exposure limit values for time-varying magnetic fields in the directive are expressed in terms of induced electric field strength, which cannot be measured directly, with subsidiary action levels given in terms of magneticflux density calculated from the exposure limits using a conservative model. In order to compare our dB/dt exposure measurements with these action levels, we derived dB/dt action levels using equation 3, as pro-posed by McRobbie.1The root-mean-square (RMS) low action level for frequencies (f ) of 1–8 Hz as proposed in the EMF Directive25 is 2×10⁵/f2mT, resulting in a minimum dB/dt action level at 8 Hz of 222.5 mT/s and a maximum action level at 1 Hz of 1780 mT/s.
dB dt pk¼
ffiffiffiffiffiffiffiffiffiffiffiffiffiffiffiffiffiffiffiffiffiffiffiffiffiffiffiffi
22pfBL
p
ð3Þ
Exposure data were modelled for each job type using multilevel mixed effect models, where job type was considered as afixed effect. Data was analysed using Stata V.13 (StataCorp 2013) using therunmlwincommand.35
RESULTS
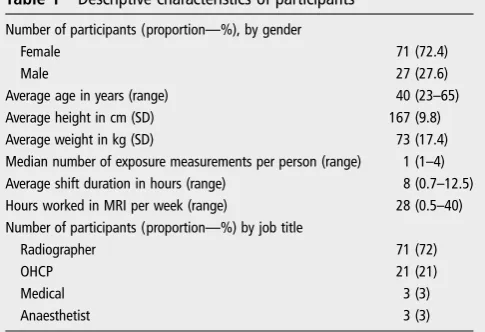
A total of 115 participants across 8 NHS sites were recruited and 175 personal SMF exposure measurements were collected. Ten participants were non-exposed controls (at least one per site) and were excluded from analysis (but used to determine the dosimeters’ LOD). Of the remaining 105 participants, exposure information was not retrieved for 1 health worker— this participant was also excluded from the analysis, resulting in 104 participants in total. In addition, 11 measurementfiles (of 6 participants) had to be excluded due to faulty dosimeters. Thus in total, 98 participants and 149 personal SMF exposure measurements were included in this analysis.Table 1 shows the descriptive characteristics of the participants.
The majority of the participants were females (71%) and radiographers (71%). All participants worked with cylindrical MRI systems, with magnet strengths of 1.5 T, 3.0 T or both. Participants worked, on average, about 8 h per shift in the MRI facility. Radiographers and most OHCP spend their whole working shifts in the MRI facility, mainly in the control room where exposure was minimal. The longest shift duration, about 12.5 h, was observed for a radiographer, followed by an OHCP (12.4 h). Exposure of medical staff (for this purpose including anaesthetists) was only measured during work in the MRI facil-ity, since full shift measurements would have been difficult logis-tically and there is no exposure elsewhere. This generally resulted in shorter measurement durations, with the shortest being 0.7 h for a radiologist present during scanning of one patient only. Radiographers reported that they work in MRI, on average, about 30 h per week, followed by OHCP (23 h), while medical staff (18 h) and anaesthetists (3 h) were in the MRI facility for much shorter periods. In total, 4809 individual MRI scans were recorded during the measurement sessions. In these 4809 recorded MRI scans, radiographers were involved in 2210 scans, OHCPs in 427, anaesthetists in 39 scans and other medical staff in 39 (only staff for whom exposure measurements were performed are included in thesefigures).
For illustrative purposes, typical static field and motion-induced time-varying magnetic field exposure patterns for two randomly selected radiographers are shown in online supplementaryfigures S1 and S2.
[image:3.595.310.553.560.726.2]Table 2 indicates that low to moderate correlations (range r=0.13–0.54) were observed between the different exposure metrics, with the exception of a very high correlation between
Table 1 Descriptive characteristics of participants
Number of participants (proportion—%), by gender
Female 71 (72.4)
Male 27 (27.6)
Average age in years (range) 40 (23–65)
Average height in cm (SD) 167 (9.8)
Average weight in kg (SD) 73 (17.4)
Median number of exposure measurements per person (range) 1 (1–4)
Average shift duration in hours (range) 8 (0.7–12.5)
Hours worked in MRI per week (range) 28 (0.5–40)
Number of participants (proportion—%) by job title
Radiographer 71 (72)
OHCP 21 (21)
Medical 3 (3)
Anaesthetist 3 (3)
shift-weighted average (SWA) and exposure-weighted average (XWA) dB/dt levels (r=0.96).
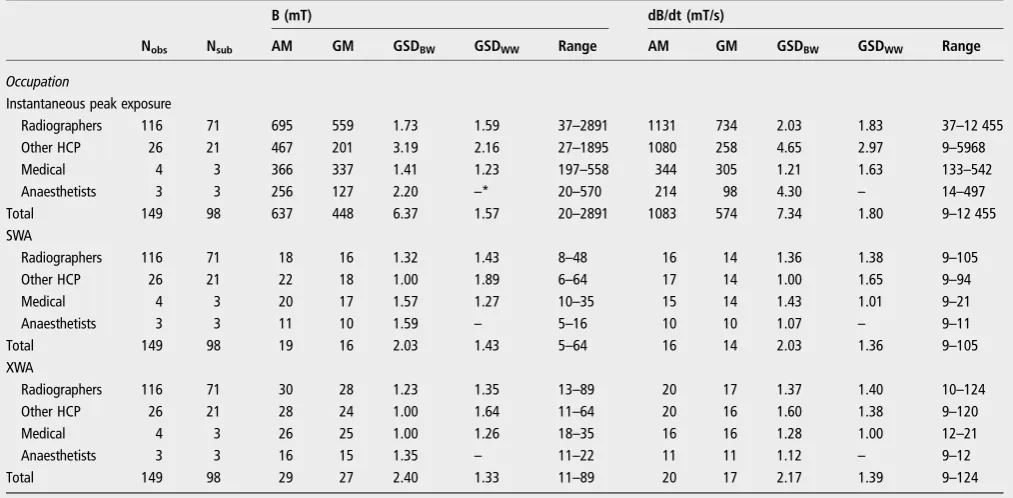
Table 3shows that the highest peak exposures were measured for radiographers ( peak B=559 mT; peak dB/dt=734 mT/s). The anaesthetists in our study have the lowest peak exposures, both for B (127 mT) and dB/dt (98 mT/s). In this population, average static field and time-varying magnetic field exposure (weighted for shift duration) was observed for the OHCP group, although dB/dt was comparable to that of radiographers. OHCP, on average, spent a larger proportion of their time in the MRI facility in the scanner room itself, followed by medical staff (66%), radiographers (56%, but note that, in contrast to other occupations, radiographers are in the MRI facility for vir-tually their complete shifts) and anaesthetists (52%). When in the MR scanner room itself, the highest B and dB/dt exposure was observed for radiographers (28 mT and 17 mT/s, respectively).
As further shown in table 3, between-participant variability was generally larger than within-participant variability,
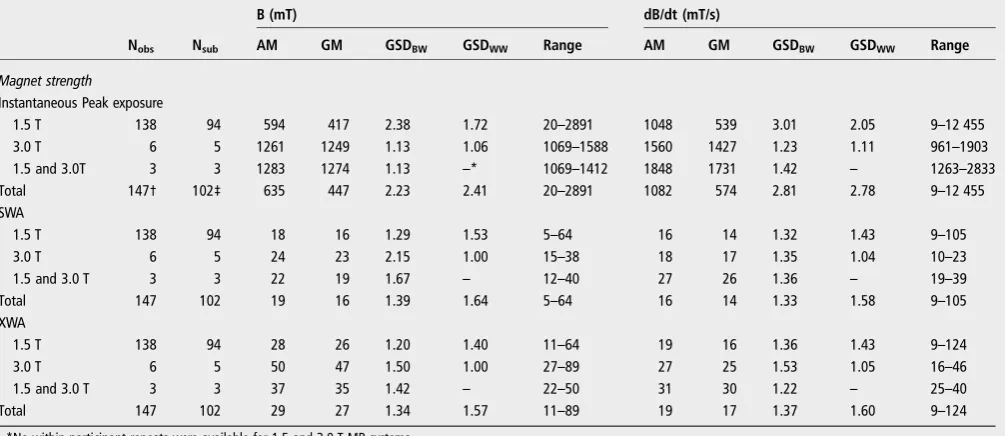
regardless of exposure metric, and accounted for 58% to 100% of the total exposure variability. Table 4 shows the exposure metrics stratified by strength of the MR scanner magnet, of which the majority (94%) were at 1.5 T systems. Peak staticfield exposure was about twice as high when 3 T systems were used (GM=1249–1274 mT) compared to when scanning was only performed on 1.5 T systems (GM=417 mT). The highest peak exposure observed at a 1.5 T system in this study was almost 3 T. When being present very close to the bore entrance of a 1.5 T scanner, for example, when leading into the bore, expos-ure to the staticfield can be considerably higher than 1.5 T as a result of the interplay of the primary and shielding coils towards the end of the magnet. Depending on the cryostat arrangement, thefield just inside the bore nearest to the coil can be as high as 3 T.31 However, it can also not be excluded that this may have occurred when a staff member working with a 1.5 T system also entered a 3 T system MRI suite during their shift, but this was not recorded. Interestingly, arithmetic mean peak exposure to motion-induced time-varying magnetic fields is about 50% higher when scanning involves 3 T systems (1560–1848 mT/s) compared to 1.5 T systems only (1048 mT), while geometric mean peak exposure is three times as high, indicating that high peaks at 1.5 T are relatively rare. Average static field exposure was only 18–24 mT (SWA) or 28–50 mT (XWA), with average dB/dt exposure being similarly low (SWA 16 mT/s; XWA 19 mT/s), indicating that during most of the shifts staff are not in the scanner room, and when they are they are not very close to the MR system itself for most of the time.
Although the ratios of within-worker and between-worker variabilities differ for the different exposure metrics, overall these are relatively comparable; indicating that exposures differ as much between different staff as they do when staff are mea-sured on multiple days. The probability of exceeding the 2 T limit was only 1.7% for radiographers, while during these
Table 2 Pearson’s correlation coefficients for exposure measures
Exposure type
B B B dB/dt dB/dt dB/dt
Metric Peak SWA XWA Peak SWA XWA
B Peak 1 0.13 0.46 0.54 0.19 0.28
B SWA 1 0.38 0.20 0.25 0.13
B XWA 1 0.17 0.17 0.34
dB/dt Peak 1 0.54 0.54
dB/dt SWA 1 0.96
dB/dt XWA 1
[image:4.595.45.552.471.720.2]Peak, instantaneous peak exposure; SWA, shift-weighted average; XWA, exposure-weighted average.
Table 3 Exposure metrics by job category: instantaneous peak exposure levels, average exposure levels weighted for the duration of the shift (shift-weighted average; SWA) and average exposure levels weighted for the time exposed to SMF (exposure-weighted average; XWA)
B (mT) dB/dt (mT/s)
Nobs Nsub AM GM GSDBW GSDWW Range AM GM GSDBW GSDWW Range
Occupation
Instantaneous peak exposure
Radiographers 116 71 695 559 1.73 1.59 37–2891 1131 734 2.03 1.83 37–12 455
Other HCP 26 21 467 201 3.19 2.16 27–1895 1080 258 4.65 2.97 9–5968
Medical 4 3 366 337 1.41 1.23 197–558 344 305 1.21 1.63 133–542
Anaesthetists 3 3 256 127 2.20 –* 20–570 214 98 4.30 – 14–497
Total 149 98 637 448 6.37 1.57 20–2891 1083 574 7.34 1.80 9–12 455
SWA
Radiographers 116 71 18 16 1.32 1.43 8–48 16 14 1.36 1.38 9–105
Other HCP 26 21 22 18 1.00 1.89 6–64 17 14 1.00 1.65 9–94
Medical 4 3 20 17 1.57 1.27 10–35 15 14 1.43 1.01 9–21
Anaesthetists 3 3 11 10 1.59 – 5–16 10 10 1.07 – 9–11
Total 149 98 19 16 2.03 1.43 5–64 16 14 2.03 1.36 9–105
XWA
Radiographers 116 71 30 28 1.23 1.35 13–89 20 17 1.37 1.40 10–124
Other HCP 26 21 28 24 1.00 1.64 11–64 20 16 1.60 1.38 9–120
Medical 4 3 26 25 1.00 1.26 18–35 16 16 1.28 1.00 12–21
Anaesthetists 3 3 16 15 1.35 – 11–22 11 11 1.12 – 9–12
Total 149 98 29 27 2.40 1.33 11–89 20 17 2.17 1.39 9–124
*No within-participant repeats were available for anaesthetists.
AM, arithmetic mean; GM, geometric mean; GSDBW, between-participant geometric SD; GSDWW, within-participant geometric SD; HCP, healthcare professional; Nobs, number of
measurements other healthcare professionals, medical staff and anaesthetists did not exceed the 2 T limit (table 5). Since this study only included 1.5 and 3 T MR systems the 8 T level was never exceeded. Peak dB/dt exposure during a shift exceeded the 222.5 mT/s action level (relevant to 8 Hz field variation) during most shifts, and the action level was most often exceeded by radiographers (93% of shifts), while the 1780 mT/s threshold (relevant to 1 Hzfield variation) was exceeded during only 10% of shifts; most often by OHCP (23%). For time-varying mag-neticfields, the lower 222.5 mT/s threshold was exceeded in the vast majority of procedures using 1.5 T systems (95%) and in all 3 T procedures, while the higher 11 780 mT/s threshold was exceeded in only 9% (1.5 T) and 17% (3 T) of shifts.
DISCUSSION
This paper describes the results of a large measurement survey of shift-based personal exposure to SMFs and motion-induced time-varying magnetic fields among healthcare staff routinely
working with MRI in the NHS. To our knowledge, this is the most comprehensive study to date of personal occupational exposure to MRI-related SMF and time-varying magneticfields among healthcare staff in the UK.
Our results show that staff routinely working with MRI to scan patients, not surprisingly, are exposed to SMFs from the magnet and to time-varying magnetic fields as a result of motion to and from the scanner in the strayfield of the magnet. Exposure to the static as well as to the motion-induced time-varying fields is highly variable within as well as between sub-jects and between shifts, and is driven by movement close to the MRI system. Nonetheless, on average, exposures are 2–3 times higher when working with 3 T systems compared to working with 1.5 T systems. Staff moving through the SMF will experi-ence transient magneticfield changes containing a range of fre-quency components, making comparison of our results with ICNIRP limits complex. A 222.5 mT/s action level derived from the time-varying magnetic field exposure limit at 8 Hz is exceeded in the majority of shifts, while a value of 1780 mT/s derived from the limit at 1 Hz, as well as 2 T limit for static fields, are only exceeded in a few situations. With respect to the 17% of shifts on 3 T systems during which the 1780 mT/s value is exceeded, it is important to further determine if these are for specific procedures only so that possible changes to these proce-dures to lower exposure may be explored. Reference levels to prevent peripheral nerve stimulation and phosphenes due to field changes of <1 Hz have been provided by ICNIRP23 for controlled (2.7 T/s) and uncontrolled (2.7 T/s or 1.8/f T/s, depending on the exposure condition) environments. If we con-sider MRI to be a controlled environment, we noted 10 occur-rences in which peak dB/dt exposure exceeded the 2.7 T/s reference level.
[image:5.595.49.552.77.295.2]Average exposure levels to both the static and the time-varying magneticfields are comparable between different occu-pations; this is primarily because staff are not present in the MRI room during most of their shifts. Instantaneous peak
Table 4 Exposure metrics by MR magnet strength: instantaneous peak exposure levels, average exposure levels weighted for the duration of the shift (shift-weighted average; SWA) and average exposure levels weighted for the time exposed to SMF (exposure-weighted average; XWA)
B (mT) dB/dt (mT/s)
Nobs Nsub AM GM GSDBW GSDWW Range AM GM GSDBW GSDWW Range
Magnet strength
Instantaneous Peak exposure
1.5 T 138 94 594 417 2.38 1.72 20–2891 1048 539 3.01 2.05 9–12 455
3.0 T 6 5 1261 1249 1.13 1.06 1069–1588 1560 1427 1.23 1.11 961–1903
1.5 and 3.0T 3 3 1283 1274 1.13 –* 1069–1412 1848 1731 1.42 – 1263–2833
Total 147† 102‡ 635 447 2.23 2.41 20–2891 1082 574 2.81 2.78 9–12 455
SWA
1.5 T 138 94 18 16 1.29 1.53 5–64 16 14 1.32 1.43 9–105
3.0 T 6 5 24 23 2.15 1.00 15–38 18 17 1.35 1.04 10–23
1.5 and 3.0 T 3 3 22 19 1.67 – 12–40 27 26 1.36 – 19–39
Total 147 102 19 16 1.39 1.64 5–64 16 14 1.33 1.58 9–105
XWA
1.5 T 138 94 28 26 1.20 1.40 11–64 19 16 1.36 1.43 9–124
3.0 T 6 5 50 47 1.50 1.00 27–89 27 25 1.53 1.05 16–46
1.5 and 3.0 T 3 3 37 35 1.42 – 22–50 31 30 1.22 – 25–40
Total 147 102 29 27 1.34 1.57 11–89 19 17 1.37 1.60 9–124
*No within-participant repeats were available for 1.5 and 3.0 T MR systems.
†No information on magnet strength was reported in two MR procedures.
‡Higher number of participants (compared totable 3) because some of the participants worked on different MR systems from day-to-day.
AM, arithmetic mean; GM, geometric mean; GSDBW, between-participant geometric SD; GSDWW, within-participant geometric SD; Nobs, number of observations; Nsub, number of
individual participants; SMF, static magnetic fields.
Table 5 Probability (p) (%) of non-compliance with exposure limit value of 2 T and derived action levels of 222.5 mT/s and 1780 mT/s
Nobs Nsub p (2 T) p (222.5 mT/s) p(1780 mT/s)
Occupation
Radiographers 116 71 1.7 93.1 8.6
Other HCP 26 21 0.0 57.7 23.1
Medical 4 3 0.0 75.0 0.0
Anaesthetists 3 3 0.0 33.3 0.0
Overall 149 98 1.3 85.2 10.7
Magnet strength
1.5 T only 138 94 1.5 84.8 9.4
3.0 T only 6 5 0.0 100.0 16.7
HCP, healthcare professional; Nobs, number of observations; Nsub, number of
[image:5.595.44.286.606.742.2]exposures, however, were on average highest for radiographers compared to other staff, with geometric mean peaks (both B and dB/dt) about 1.5 to three time as high as those of other healthcare staff and medical staff. Since radiographers prepare the MRI room for the next patient and generally accompany patients to prepare them for the scan or guide them out of the MR room after the scan, these results confirm our a priori hypothesis. For example, we observed that in most monitored hospitals, patients were cannulated in the scan room, that is, while sitting on the patient table right next to the scanner. These results are also in line with recent work in the Netherlands where magneticfield strength and the specific tasks in the MRI room performed by staff were identified as main determinants of exposure.36
Previous personal exposure data from the UK are available,30 but it is difficult to directly compare the results of the studies because different measurement equipment were used, circum-stances differed and data from the 2007 study were not stratified by occupation. Nonetheless, with respect to the strength of the magnets, our results are broadly comparable to those reported in Bradleyet al.30Internationally not much data is available, but our study is most comparable to a recent study conducted in the Netherlands.29 When interpreting these results, it is important to note that the study in the Netherlands included participants working with MRI systems with magneticfield strengths of up to 7 T, and also included data from non-clinical settings. Schaap et alfurther measured personal exposure at chest level (using a custom-designed harness) while we measured at the hip. Nonetheless, compared to the Dutch study, correlations between the different exposure metrics in our study are 33–81% lower for peak exposures, depending on exposure metric and field strength. Correlation between shift-weighted and exposure-weighted metrics for static exposure are much lower in our study (about 46%), while it is higher (about 19%), and nearly perfect, for time-varying magneticfields. Overall, instantaneous B peak exposure in healthcare (human MRI facilities) in the Dutch study was 15–28% higher (depending on magneticfield) than the exposure we measured in the UK, while the relative between-participant variability was much higher in our study; this may indicate that tasks are more standardised in the Netherlands. Regarding overall shift-weighted average exposure in healthcare, exposure-weighted averages are 2.5-fold higher and 1.3-fold lower for SMF and time-varying magnetic field, respectively, in the Dutch study. Although hypothetical, this seems to indicate that the Dutch staff moved more slowly through the strayfields, but stayed in the MRI suite for a longer time. An alternative explanation for the observed differences in exposure is that in the Dutch study the dosimeters were attached to a harness around the breast, while in our study, these were worn at the hip. No data are available that directly compare the impact of these different positions of the dosimeter on exposure levels, but it is likely that exposure measured at the upper body is generally higher than that measured at the hip because more rotational movements are made and also staff will lean forward during certain tasks which puts their torso closer to the magnet bore than the hip. Different methods of data handling between both studies may also, to some extent, explain any differences. We observed the highest exposure for radiographers compared to other occupations in our study, but since the occupations differ from those in the Dutch study, these results cannot be dir-ectly compared.
The main advantages of our study is that with the use of the personal dosimeters, we were able to collect a large number (about 150) of personal shift measurements for staff routinely
working with MRI in NHS healthcare in the UK, thereby pro-viding reference exposure estimates for comparison with other countries and for use in quantitative exposure estimates in future epidemiological studies. The random selection of hospital sites, measurement days and participating staff should ensure that our results describe exposure conditions in England, Wales and Scotland; however, given the nature of the participating sites, the exposure estimates are more representative of larger tertiary sites than smaller sites. Another advantage of this study was that we were able to use second generation dosimeters which did not require additional, somewhat arbitrary, data manipulation to account for baseline drifts as was required in earlier studies.
Unfortunately, within the time frame of this study we were not able to collect more exposure data from occupations other than radiographers, and we were also not able to collect data from other occupations such as, for example, hospital cleaners who can also receive high exposure to MRI-generated magnetic fields in these settings.29Another limitation of our methodology was that, for reasons of logistics, we were not able to perform measurements for the full shifts of medical staff who were only in the MRI facility for a short time. Although this is likely to be negligible, since in most cases they would not have received add-itional exposure, we cannot completely exclude these. Also, it makes exposure-weighted average exposure measures more comparable with radiographers’ exposures than shift-weighted averages, although again, the differences are likely to be minimal. We performed measurements at the hip, which was done so that wearing the dosimeter would not interfere with participants’work, but as outlined above this may have underes-timated exposure to the head, which is generally considered the target organ for the observed effects.37 We opted not to measure nearer the head, for example, at the chest as was done in the Dutch study,29because it is fairly unlikely that if in the future routine monitoring of staff is introduced, it will be carried out using relatively inconvenient protocols. Nonetheless, as it is difficult to determine whether the location of the dosim-eter at the hip systematically overestimates or underestimates exposure measured at the chest, future work will need to assess correlations of exposures measured at different places on the body during simultaneous measurements of different movement patterns.
CONCLUSIONS
but it may also imply that differences between procedures exist, leading to different exposure patterns in the two countries: UK staff seem to be in the MR suites for shorter duration than their Dutch colleagues, but either moved faster (on average), maybe because more patients had to be scanned in a shift, or were closer to the bore, maybe to assist or comfort patients prior to a scan.
Future analyses at task level will hopefully shed some light on this because for exposure prediction it is important to gain as much insight as possible into determinants of exposure differ-ences. With respect to future cohort studies of long-term health effects, these data indicate that exposure prediction models cannot be straightforwardly adopted by different countries, and that a measurement of baseline exposure in normal practice is needed for each country.
Author affiliations
1Centre for Occupational and Environmental Health, University of Manchester, Manchester, UK
2Department of Environmental and Radiological Health Sciences, Colorado State University, Fort Collins, Colorado, USA
3Institute for Risk Assessment Sciences (IRAS), Utrecht University, Utrecht, The Netherlands
4Centre for Human Exposure Science, Institute of Occupational Medicine, Edinburgh, UK
5School of Information Technology and Electrical Engineering, University of Queensland, Brisbane, Queensland, Australia
6School of Physics and Astronomy, The University of Nottingham, Nottingham, UK 7
Department of Medical Physics, Guy’s and St Thomas’NHS Foundation Trust, London, UK
8
Department of Biomedical Engineering, King’s College London, London, UK 9School of Social and Community Medicine, University of Bristol, Bristol, UK
Twitter Follow Frank de Vocht at @frankdevocht
Acknowledgements The authors would like to thank all participants who volunteered for this study, as well as all site coordinators ( Judith Kilgallon, Andrew Jones, Annette Dahl, Paul Harris, Tim Relf, Mike Hutton, Nick Weir, Donald McRobbie and Janine Sparkes). The authors would further like to thank Sumaiya Patel for assistance with data preparation.
Contributors AM and FdV collected the data. EB conducted the statistical analyses and drafted the manuscript. All authors were involved in the planning of the study. All authors were involved in interpretation of the data and provided input in the consecutive iterations of the manuscript. All authors read and approved of thefinal version of the manuscript. FdV is the guarantor for this work.
Funding The study was funded by a research grant from The COLT Foundation (grant number CF/01/11).
Competing interests SC developed, produces and licenses the dosimeters used in this study through a University of Queensland company.
Ethics approval University of Manchester’s Research Ethics Committee. Provenance and peer reviewNot commissioned; externally peer reviewed. Open Access This is an Open Access article distributed in accordance with the Creative Commons Attribution Non Commercial (CC BY-NC 4.0) license, which permits others to distribute, remix, adapt, build upon this work non-commercially, and license their derivative works on different terms, provided the original work is properly cited and the use is non-commercial. See: http://creativecommons.org/ licenses/by-nc/4.0/
REFERENCES
1 McRobbie DW. Occupational exposure in MRI.Br J Radiol2012;85:293–312. 2 HPA.Protection of patients and volunteers undergoing MRI procedures, documents
of the Health Protection Agency RCE-7. Chilton, UK: Health Protection Agency (now Public Health England), 2008.
3 Keevil S.MRI and the physical agents (EMF) directive. London: The Institute of Physics, 2008. https://www.iop.org/publications/iop/2008/file_38215.pdf (accessed 14 Oct 2015).
4 Hu X, Norris DG. Advances in high-field magnetic resonance imaging.Annu Rev Biomed Eng2004;6:157–84.
5 Capstick M, McRobbie DW, Hand J,et al.An investigation into occupational exposure to electro-magneticfields for personnel working with and around medical magnetic resonance imaging equipment. Report on Project VT/2007/017 of
European Commission DG Employment, Social Affairs and Equal Opportunities. 2008. http://www.itis.ethz.ch/assets/Downloads/Papers-Reports/Reports/ VT2007017FinalReportv04.pdf (accessed 14 Oct 2015).
6 Feychting M. Health effects of static magneticfields—a review of the epidemiological evidence.Prog Biophys Mol Biol2005;87:241–6.
7 HSE.Assessment of electromagneticfields around magnetic resonance imaging (MRI) equipment. Sudbury: Health & Safety Exectuive, 2007.
8 Gowland PA. Present and future magnetic resonance sources of exposure to static fields.Prog Biophys Mol Biol2005;87:175–83.
9 de Vocht F, Batistatou E, Mölter A,et al. Transient health symptoms of MRI staff working with 1.5 and 3.0 Tesla scanners in the UK.Eur Radiol2015;25: 2718–26.
10 de Vocht F, van Drooge H, Engels H,et al. Exposure, health complaints and cognitive performance among employees of an MRI scanners manufacturing department.J Magn Reson Imaging2006;23:197–204.
11 Schaap K, Christopher-de Vries Y, Mason CK,et al. Occupational exposure of healthcare and research staff to static magnetic strayfields from 1.5–7 Tesla MRI scanners is associated with reporting of transient symptoms.Occup Environ Med 2014;71:423–9.
12 Wilén J, de Vocht F. Health complaints among nurses working near MRI scanners— a descriptive pilot study.Eur J Radiol2011;80:510–13.
13 Hansson Mild K, Hand J, Hietanen M,et al. Exposure classification of MRI workers in epidemiological studies.Bioelectromagnetics2013;34:81–4.
14 Bongers S, Slottje P, Portengen L,et al. Exposure to static magneticfields and risk of accidents among a cohort of workers from a medical imaging device manufacturing facility.Magn Reson Med2015.
15 de Vocht F, Glover P, Engels H,et al. Pooled analyses of effects on visual and visuomotor performance from exposure to magnetic strayfields from MRI scanners: application of the Bayesian framework.J Magn Reson Imaging 2007;26:1255–60.
16 van Nierop L, Slottje P, van Zandvoort M,et al. 0137 Acute cognitive effects of MRI related magneticfields: the role of vestibular sensitivity.Occup Environ Med 2014;71(Suppl 1):A16.
17 van Nierop LE, Slottje P, Kingma H,et al. MRI-related static magnetic strayfields and postural body sway: a double-blind randomized crossover study.Magn Reson Med2013;70:232–40.
18 van Nierop LE, Slottje P, van Zandvoort M,et al. Simultaneous exposure to MRI-related static and low-frequency movement-induced time-varying magnetic fields affects neurocognitive performance: a double-blind randomized crossover study.Magn Reson Med2015;74:840–9.
19 van Nierop LE, Slottje P, van Zandvoort MJ,et al. Effects of magnetic strayfields from a 7 tesla MRI scanner on neurocognition: a double-blind randomised crossover study.Occup Environ Med2012;69:759–66.
20 Glover PM. Interaction of MRIfield gradients with the human body.Phys Med Biol 2009;54:R99–115.
21 Glover PM, Cavin I, Qian W,et al. Magnetic-field-induced vertigo: a theoretical and experimental investigation.Bioelectromagnetics2007;28:349–61.
22 Glover PM, Li Y, Antunes A,et al. A dynamic model of the eye nystagmus response to high magneticfields.Phys Med Biol2014;59:631–45.
23 ICNIRP. Guidelines for limiting exposure to electricfields induced by movement of the human body in a static magneticfield and by time-varying magneticfields below 1 Hz.Health Physics2014;106:418–25.
24 NRPB. Advice on Limiting Exposure to Electromagnetic Fields (0–300 GHz). Documents of the NRPB2004;15:35.
25 EU. Directive 2013/35/EU of the European Parliament and of the Council of 26 June 2013 on the minimum health and safety requirements regarding the exposure of workers to the risks arising from physical agents (electromagneticfields) (20th individual directive within th meaning of article 16(1) of directive 89/391/EEC) and repealing directive 2004/40/EC. Official Journal of the European Union 2013;L 179:21. 26 Atkinson IC, Renteria L, Burd H,et al. Safety of human MRI at staticfields above
the FDA 8 T guideline: sodium imaging at 9.4 T does not affect vital signs or cognitive ability.J Magn Reson Imaging2007;26:1222–7.
27 Crozier S, Liu F. Numerical evaluation of thefields induced by body motion in or near high-field MRI scanners.Prog Biophys Mol Biol2005;87:267–78. 28 Riches SF, Collins DJ, Charles-Edwards GD,et al. Measurements of occupational
exposure to switched gradient and spatially-varying magneticfields in areas adjacent to 1.5 T clinical MRI systems.J Magn Reson Imaging 2007;26:1346–52.
29 Schaap K, Christopher-De Vries Y, Crozier S,et al. Exposure to static and time-varying magneticfields from working in the static magnetic strayfields of MRI scanners: a comprehensive survey in the Netherlands.Ann Occup Hyg
2014;58:1094–110.
30 Bradley JK, Nyekiova M, Price DL,et al. Occupational exposure to static and time-varying gradient magneticfields in MR units.J Magn Reson Imaging2007;26:1204–9. 31 Fuentes MA, Trakic A, Wilson SJ,et al. Analysis and measurements of magnetic
32 Úbeda A, Martínez MA, Cid MA,et al. Assessment of occupational exposure to extremely low frequency magneticfields in hospital personnel.Bioelectromagnetics2011;32:378–87. 33 Yamaguchi-Sekino S, Nakai T, Imai S,et al. Occupational exposure levels of static
magneticfield during routine MRI examination in 3 T MR system. Bioelectromagnetics2014;35:70–5.
34 Karpowicz J, Gryz K. The pattern of exposure to static magneticfield of nurses involved in activities related to contrast administration into patients diagnosed in 1.5 T MRI scanners.Electromagn Biol Med2013;32:182–91.
35 Leckie G, Charlton C. runmlwin—A Program to Run the MLwiN
Multilevel Modelling Software from within Stata.Journal of Statistical Software 2013;52:40.
36 Schaap K, Christopher-De Vries Y, Cambron-Goulet E,et al. Work-related factors associated with occupational exposure to static magnetic strayfields from MRI scanners.Magn Reson Med2015.