1
Quantified economic and environmental values through Functional
Productization - A simulation approach
Sean Reed, Magnus Karlberg, Petter Kyösti, Daria Sas
Abstract
Industrial companies rely on hardware and services from external providers to deliver functions that are critical to their operations, increasingly demanding solutions that not only meet technical and availability requirements but are sustainable too. Traditionally, industrial companies choose and purchase hardware and maintenance support to fulfil their functional requirements. An alternative arrangement, known as Functional Product (FP), involves external providers supplying customers with the functionality they require through contracts that specify guaranteed functional availability whilst giving providers freedom to choose and retain ownership of the supplied hardware and services. This paper describes an innovative simulation modelling and optimization approach to quantitatively compare economic and environmental values resulting from transition from traditional to FP arrangements. The approach is demonstrated through the analysis of a scenario involving a hydraulic drive system provider and set of customers in Sweden, with the results exhibiting simultaneous improvement in economic and environmental values at each stage of the transition.
1
Introduction
The earth is facing an increasing population (United Nations 2013) who, by following the same consumption pattern as historically, will require increased resource extraction (Wiedmann et al. 2015). In addition, it is expected that growth will be sustainable such that the global mean welfare will continue to increase and that the global environment will not be deteriorated to a hazardous level. Since natural resources are limited, these conditions cannot be simultaneously fulfilled meaning that actions need to be taken to change the resource extraction and the environmental impact. A substantial amount of research has been conducted to address sustainability challenges from different perspectives (Arena et al. 2009; Delai and Takahashi 2011; Morlet et al. 2016; Bratt et al. 2011). In particular Bond et al. (2012) conducted a state-of-art analysis regarding sustainability assessment. They found that since the early 1990s the amount of research has increased rapidly and claim that sustainability assessment is one of the most important factors to actually increase sustainability.
Many of the current mega trends of globalization, informatization, move toward a network economy, lean and “just in time” production, concentration of core business, shift to two income families, more single-person households, more time pressure on citizens and individualization inherently lead to a greater demand on product-service solutions rather than products. A customer often does not have the time, knowledge or resources necessary to evaluate all available solutions from all vendors. Therefore if the customer chooses the product constituents to purchase (as a solution to their functional requirements) the risk is high that the sustainability of the solution will be suboptimal (Tukker and Tischner 2006).
2
pure sales, research has shown that environmental impact depends on different assumptions and context and can even be an environmentally inferior alternative (Agrawal et al. 2012; Agrawal and Bellos 2017).
It has been shown that industry is one important stakeholder affecting the sustainability development (Lindahl et al. 2014). Therefore, different aspects of how industries can contribute to sustainability have been studied (Joung et al. 2012; Lindahl et al. 2014). One such aspect regards transformation from traditional product provision to performance based innovations such as Product Service Systems (PSS) (Mont 2002), Through-life Engineering Services (TES) (Roy et al. 2013) and Functional Products (FP) (Alonso-Rasgado et al. 2004) – the latter of which is targeted in the research presented in this paper. Among these business concepts, a defining feature of FP is its total care guarantee, incentivizing and empowering the provider to consider the whole value-chain in a life cycle perspective when developing solutions. Within the area of life cycle simulation, there exist some pioneering work regarding evaluation of environmental and economic impact e.g. Johansen et al. (1997) and Umeda et al. (2000). However, in these examples the flexibility and level of detail of the support system is limited. In addition, Fujimoto et al. (2003) illustrated, through simulations, the potential of service oriented products in terms of both environmental load and business opportunities. Simulation has been widely used to model the environmental performance of product lifecycles, for example in cement manufacturing (Gäbel et al. 2004), due to its flexibility and ability to perform detailed analysis. Garetti et al. (2012) proposed a reference architecture for life cycle simulation for PSS which included both a product model and a service model instance. They concluded “the use of simulation for the virtual emulation of a service network could offer strong support to engineers to develop a comprehensive PSS.” Tukker (2004) performed a qualitative evaluation of the economic and environmental sustainability characteristics of eight types of PSS. The conclusion was that most PSS types will likely result in marginal environmental improvements at best and that the idea that PSS development will automatically result in an environmental-economic win-win situation seems to be a myth. The exception was the PSS type known as functional results, where the result rather than product is sold by the provider, which Tukker deemed most promising in environmental terms primarily due to the greater freedom for the provider to design a low-impact system. FP is most closely related to functional results PSS (also known as result-oriented PSS), however FP is constituted by a specifically developed integration of hardware, software, service support system and management of operation (Lindström et al. 2012) and places greater focus on the delivered function rather than enabling constituents (Lindström et al., 2014). Under FP, customers enter a contract that gives the provider freedom to choose the appropriate solution to achieve the agreed upon functionality for the customer industrial applications. The provider retains ownership of all constituents and the contracts stipulate performance-based guarantees (e.g. functional availability) to incentivize the provider to meet the functional performance levels required by the customer. On the other hand, under traditional product provision, customers themselves choose and take ownership of the product constituents, by purchasing them from the third-party providers, to provide the required functionality for their industrial applications.
3
remanufacture, down cycle and recycle the constituents to remain resource efficient over the life cycle (Mont 2001). These efficiency improvements can then be shared within the FP value chain. In addition, other tangible and in-tangible values are typically generated through FP innovations (risk sharing, partnerships, even cash flows etc.) which hence promotes sustainable value chain win-win over the life cycle (Lindström et al. 2014).
Although qualitative research exists indicating sustainability advantages by transformations into FP businesses (Functional Productization) there is still a lack of quantified results (Markeset and Kumar 2005; Brännström et al. 2001). One reason for this is that very few FP businesses exist (i.e. where the constituents have been specifically developed for FP provision) that could generate real data as evidence. In addition, many contributions utilize quite general sustainability impact assumptions (e.g. assumed differences in durability between products when leased or sold (Agrawal et al. 2012)), hence the relationships to the physical events vanish, resulting in limited validity. However, a possible strategy to quantify sustainability gains is to explicitly model the functional provision events that occur when FP and alternatives are implemented and then measure the resultant differences in economic and environmental impact. To make a fair comparison, the different scenarios should all be optimized and evaluated at the same level of production and with equal boundary conditions. Such a fair comparison is lacking in existing literature. Research has previously been published on modelling and simulation FP constituents to predict measures other than sustainability e.g. hardware availability (Löfstrand et al. 2014) and service support system costs (Kyösti and Reed 2015), and also on how to integrate constituents in simulation models to assess and optimize these metrics (Löfstrand et al. 2011). However, despite the existence of these prediction strategies, there still exist no results quantifying the sustainability improvements, if any, that result from Functional Productization. Therefore, the hypothesis for this research is that:
Transformation from traditional product trade to FP can simultaneously improve economic and environmental sustainability.
Thus, the objective for this paper is to provide evidence to justify this hypothesis. The study is limited to one scenario based on a real industrial situation and excludes the social sustainability dimension.
2
Research Approach
To provide quantitative evidence of sustainability improvement through Functional Productization a hypothesis testing approach was applied (Spector 1981). To test the hypothesis, the characteristics of business cases representing the transition from traditional to FP must be identified and indicators of economic and environmental sustainability performance must be measured for each. These measures can then be compared between the cases to detect whether Functional Productization leads to economic and environmental sustainability improvements. Industrial situations that would enable direct and fair comparison between functional provision and traditional product trade do not currently exist. This could possibly be solved by developing FP at some existing industry, which could then be studied when provided to customers to obtain empirical evidence. This strategy was considered as infeasible due to time limitations, complexity of establishing comparable situations and lack of possibilities to control the study. Therefore, a model approach based on an existing industry situation was selected for the research presented in this paper.
4
were selected for the common scenario. The data needed to set up the scenario was collected by a systematic analysis of existing information regarding value chains in manufacturing and process industry from previous research projects carried out within VINNOVA Excellence Centre the Faste Laboratory since 2007. In particular, material from interviews and workshops with personnel at a hydraulic drive manufacturer in Sweden as well as with personnel at some of their customers was considered. To further ensure scenario relevance, the current hydraulic value chain was thoroughly analyzed. For confidentiality reasons, a tentative value chain was developed based on current hydraulic drive value chains.
Several intermediate business models exist between the extreme traditional and FP cases outlined in the introduction, representing the transition in responsibility, choice and ownership of the functional provision constituents from the customer to the provider. It was decided that four cases representing different progression steps towards provision of FP should be modelled. Three existing business cases, which will be referred to as the traditional cases, that represent the transition toward FP were found when analyzing the existing value chain. Since implementation for the FP case does not currently exist, a fourth case was developed to represent this based on existing knowledge on FP (Lindström et al. 2015). The characteristics of these four cases were identified and are discussed in Section 3.
The hypothesis testing requires simultaneous evaluation of economic and environmental sustainability. For a fair comparison, it is necessary to compare optimal outcomes between the four cases. Due to the large solution space and dual dimensions of economic and environmental sustainability performance, the use of a multi-objective heuristic search technique was deemed necessary to find high quality solutions in reasonable time frames. With multi-objective optimization, the aim was to find Pareto optimal solutions, thus giving an output representing solutions with the best available trade-offs between economic and sustainability performance. Various optimization methodologies and implementations were considered and tested, including a simulated annealing heuristic algorithm (Kirkpatrick et al. 1983) and the multi-objective genetic algorithm from the Global Optimization Toolbox within the MATLAB software (MathWorks 2017). The NSGA-II genetic algorithm (Deb et al. 2002) was eventually chosen as it performed best in terms of the fitness and spread across the Pareto front of the solutions found. It is important to note that the method does not guarantee that the absolute optimal solutions will be found, however the NSGA-II algorithm has been shown to consistently find solutions that are close to the true Pareto curve in numerous benchmark test problems (Deb et al. 2002).
A literature review was conducted to support the choice of economic and environmental sustainability performance indicators. It found that common environmental sustainability indicators were: materials, energy, water, emissions, waste, and biodiversity while common economic sustainability indicators included economic performance, investors, profit and value (Arena et al. 2009; Delai and Takahashi 2011). However, to facilitate clear comparison between the cases, single indicators for each of environmental and economic sustainability must be chosen. For quantitative measurement of the indicators in each case, the events that contribute toward them in the scenario over the life cycle of functional provision such as vehicle travel, component manufacture, spares inventory storage, equipment energy consumption must be modelled.
5
of a spare part and repair completion). The choice of economic and environmental sustainability indicators, development of the discrete event simulation model and implementation of the optimization heuristic for quantitative comparison of Pareto optimal solutions between the four cases is described in Section 4.
3
Scenario and cases
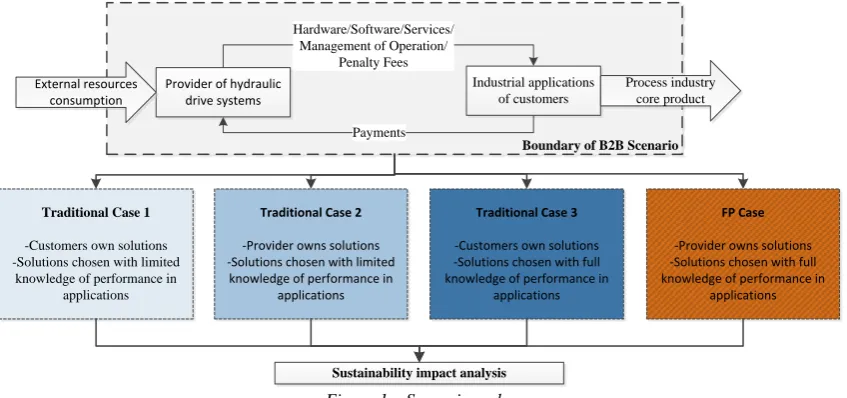
As shown in Figure 1, the analysis of environmental and economic impact was conducted through a comparison between four cases in the same business-to-business (B2B) scenario. The B2B scenario consisted of a provider of hydraulic drive systems and set of process industry customers based in a region of Sweden with industrial applications that require the provision of rotational power, within a limited speed and torque range. The B2B scenario was constrained to a single provider since, in general, the functional provision from different providers are isolated and therefore can be considered separately without altering sustainability impact. In contrast, the scenario set up was extended to cover multiple customers since it was considered important to capture the influence on sustainability impact from the interactions due to the sharing of resources between customers.
Industrial applications of customers
Provider of hydraulic drive systems
Hardware/Software/Services/ Management of Operation/
Penalty Fees
Payments
Boundary of B2B Scenario
Traditional Case 2
-Provider owns solutions -Solutions chosen with limited knowledge of performance in
applications
Traditional Case 3
-Customers own solutions -Solutions chosen with full knowledge of performance in
applications
Traditional Case 1
-Customers own solutions -Solutions chosen with limited
knowledge of performance in applications
Sustainability impact analysis
FP Case
-Provider owns solutions -Solutions chosen with full knowledge of performance in
applications
Process industry core product
[image:5.595.79.503.297.496.2]External resources consumption
Figure 1 – Scenario and cases.
The sustainability impact analysis was based on considering certain consumption of external resources within the B2B Scenario and certain process core product under four different cases. Therefore, the internal negotiations, i.e. payments and penalties fee, provision of hardware, service etc. between the provider and customers are not of interest for this study. Thus, by altering constraints (e.g. available choices for locations of spare parts, locations of service support site and hardware system specifications) and knowledge available for use during optimization (e.g. reliability performance of particular hardware systems under the demands of particular functional applications), the following four cases were generated: Traditional case 1, 2, 3 and Functional product.
The sustainability impact analysis included all the hardware events from manufacture to disposal (but excluded earlier events such as development and manufacturing setup) and all the provision events except support site setup and closure. The four cases represent the transition from traditional to FP and the positioning of each in terms of ownership and knowledge of the solution is illustrated in Figure 2.
6
on lowest purchase cost. Whilst customers will often understand their industrial applications very well, due to it being a fundamental part of their business, their knowledge of the available solution constituents is often outside the core competencies of their business and, additionally, certain knowledge may be proprietary or kept secret by the provider for commercial reasons. For example, providers may present customers with general information on product reliability such as mean time to failure (MTTF) under a standardized usage demand but would not usually give detailed information that enables a customer to determine failure rates under the stresses of operational profiles belonging to specific applications. Since in traditional case 1 the customer owns the hardware and support services they purchase, it was also assumed they were unable to take advantage of any optimizations that might be gained from coordinated choices across different industrial applications and customers. For the same reasons, it was also assumed each customer kept spares locally for their own exclusive use. Traditional case 1 is representative of a very common procurement arrangement within industry at the present time.
Functional Product Case
Traditional Case 2 Traditional Case 3
Traditional Case 1
Functional provision solutions chosen with full knowledge of performance in specific applications
E ac h c u sto m er o w n s fu n cti o n al p ro vi si o n s o lu ti o n s fo r th ei r ap p lic ati o n s P ro vid er reta in s o w n er sh ip o f f u n cti o n a l p ro vis io n so lu ti o n s f o r a ll a p p lic a ti o n s
Functional provision solutions chosen with limited knowledge of performance in specific applications
Figure 2 – Positioning of the four cases in terms of knowledge and ownership of the chosen functional provision solutions for customer applications.
Traditional case 2 is the same as traditional case 1 except that the provider retains ownership of the solutions purchased by the customers thus allowing the provider to share spares across customers. This is therefore similar to a leasing arrangement, where customers choose the solution specification they desire but never own them.
Traditional case 3 was the same as traditional case 1 with the difference that customers are assumed to have full knowledge of the performance of the available solutions in their applications. This is therefore a best-case scenario for customers procuring functionality through purchase and ownership, representative of cases where the available solution technologies are well-known (i.e. not innovative or state-of-the-art) to the customer and customers have comprehensive knowledge and experience in operating them within their applications.
7
that are shared by the customers, to deliver highly optimized solution constituents for the functional provision. For the functional product case it is also assumed that retention of ownership of the solution allows the provider to rationalize, pool and share the solution constituents, such as spares, across the customer base.
4
Calculation
To quantify sustainability differences between the four cases, a model for quantifying the predicted sustainability of solutions in an example scenario was constructed and is described in this section.
4.1 Scenario Conceptual Model Development
A scenario was developed consisting of a set of customers from the process industry, located across the north of Sweden, with industrial applications that require rotational power (comprising torque and speed) and a provider of hydraulic drive systems. For the example scenario, 20 customer functional applications requiring rotational power at distinct locations distributed across the north of Sweden were defined. For each customer, unique functional requirements in terms of rotational torque, speed and operating durations were defined. The types of industrial applications represented by these requirements include conveyors, crushers, mills and rotary kilns. Data on the customer locations (and driving times and distances between them) and the functional requirements of the industrial applications can be found in A.1 and Table B.1 of the supporting information. A conceptual model of the provider product elements (comprising hardware, software, services and management of operation) used to provision functionality to the customer applications was also constructed. For the example scenario, the provider delivers solutions for rotational power by provisioning hydraulic drive systems, comprising hardware and software, and support services.
Hydraulic drive systems are suited to provide rotational power to industrial applications that require high torque and low speed with several advantages over the main alternative, electric motors coupled with a gearbox, including: near constant torque throughout speed range, low inertia and ability to cope with shock loads as well as frequent stops and starts. The three major component types in the considered hydraulic drive systems are electric motors, hydraulic pumps and hydraulic motors. Real world hydraulic drive systems include several other auxiliary components, however to simplify the analysis in the modelled scenario, the reliability, efficiency and sustainability impact from all other components and software were not considered. This include those components within the power supply, control, piping, filtration, cooling, charge pump and condition monitoring systems.
8
specifications is given in Table B.4 of the supporting information). The efficiency of a hydraulic motor is comprised from the volumetric loss, pressure loss and mechanical efficiency. These efficiencies, as well as the failure rate vary according to the operating point in terms of flow rate and pressure (these variations are described by the plots in Figures B.4 and B.5 of the supporting information). From these component specifications, eight different hydraulic drive system configurations were defined (data on these specifications is provided in Table B.5 of the supporting information). Furthermore, the modelling assumption was made that the drive system includes a condition monitoring system, comprising of sensors and data stream analysis software amongst other components, that detects when any of the major components has failed and responds by shutting the system down and notifying the maintenance service provider. The number of these drive system specifications that can provide a given speed and torque output from the hydraulic motor are shown in Figure 3.
A mathematical model of the operation of a drive system was developed from fundamental hydraulic relations (see e.g. Yeaple (1995)) to calculate the operating point of each component in a system (and hence determine the corresponding efficiencies and failure rates) based on a specified speed and torque output along with the system configuration and the data defining the specifications of the constituent components. This shows that there are multiple choices of system specification that can perform in certain speed and torque operating regions, with the number of choices increasing as the required torque and speed decreases as would be expected.
9
Figure 3 - Hydraulic drive system selection diagram showing the number of system specifications that can operate at different speed and torque outputs.
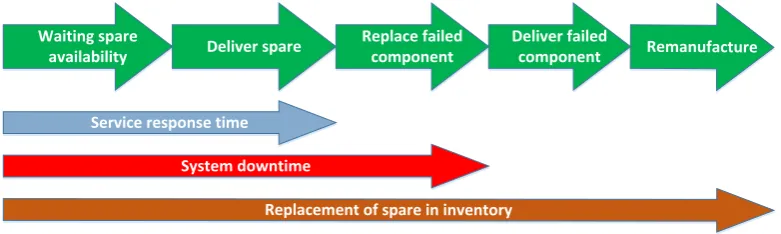
The customer technicians then replace the failed component with the spare, restoring functionality to the hydraulic drive system. The provider then delivers the failed component back to the support site by motor vehicle, from where it is returned to the provider for remanufacture. Once remanufactured, the provider is delivered back to the customer and added to the available spares inventory. Figure 4 shows the timeline of events involved in the replacement and remanufacture of a failed component from the point of failure. The mean times for replacement of a failed component with a working spare for the different component types are given in Table B.6 of the supporting information.
Replacement of spare in inventory System downtime
Service response time Waiting spare
availability Deliver spare
Replace failed component
Deliver failed
component Remanufacture
Figure 4 - Timeline for maintenance service provision after component failure.
10
support site, where each level specifies the maximum allowable mean waiting time for spares ranging, from 10 available options ranging from 3 minutes to 5 hours mean waiting time (see the plot given in Figure B.6 of the supporting information).
The key events involved in the functional provision that may have a sustainability impact were identified as follows:
Manufacture of electric motor, hydraulic pump or hydraulic motor components for an installed system or spare.
Operation of an installed system to provide functionality for a customer functional application.
Storage of a component in spare inventory at a support site.
Delivery by motor vehicle of a component (either spare or failed) between a support site and a system installation site.
Failure of a component during operation of an installed system.
Replacement of failed component with a spare of the same specification.
Remanufacture of a component. 4.2 Sustainability Impact Measurement
In line with Abramovici et al. (2014) the single indicator “CO2 emissions” was chosen to quantify the environmental sustainability impact. CO2 emissions can be related to many other sustainability indicators (CO2 equivalents), making this a fair choice. To quantify the CO2 equivalent, numerous and disparate sources must be combined. In this model, the sources related to CO2 emissions are: travelled distance, production-related energy consumption, hardware manufacturing and hardware remanufacturing. Hence,
𝐶𝑂2𝑡𝑜𝑡𝑎𝑙 = 𝐶𝑂2𝑒𝑛𝑒𝑟𝑔𝑦+ 𝐶𝑂2𝑡𝑟𝑎𝑣𝑒𝑙+ 𝐶𝑂2𝑚𝑎𝑛𝑢𝑓𝑎𝑐𝑡𝑢𝑟𝑒+ 𝐶𝑂2𝑟𝑒𝑚𝑎𝑛𝑢𝑓𝑎𝑐𝑡𝑢𝑟𝑒
Economic sustainability impact was assessed by the expected value for the overall financial cost of the combined solution across all customer applications. The impact equivalent 1000 Swedish Krona was used as single indicator influenced by costs related to energy, downtime, travel, spares inventory, component replacement, hardware manufacturing and hardware remanufacturing. Hence,
𝐶𝑜𝑠𝑡𝑡𝑜𝑡𝑎𝑙 = 𝐶𝑜𝑠𝑡𝑒𝑛𝑒𝑟𝑔𝑦+ 𝐶𝑜𝑠𝑡𝑑𝑜𝑤𝑛𝑡𝑖𝑚𝑒 + 𝐶𝑜𝑠𝑡𝑡𝑟𝑎𝑣𝑒𝑙+
𝐶𝑜𝑠𝑡𝑠𝑝𝑎𝑟𝑒𝑠 𝑖𝑛𝑣𝑒𝑛𝑡𝑜𝑟𝑦+𝐶𝑜𝑠𝑡𝑐𝑜𝑚𝑝𝑜𝑛𝑒𝑛𝑡 𝑟𝑒𝑝𝑙𝑎𝑐𝑒𝑚𝑒𝑛𝑡+ 𝐶𝑜𝑠𝑡𝑚𝑎𝑛𝑢𝑓𝑎𝑐𝑡𝑢𝑟𝑒+ 𝐶𝑜𝑠𝑡𝑟𝑒𝑚𝑎𝑛𝑢𝑓𝑎𝑐𝑡𝑢𝑟𝑒
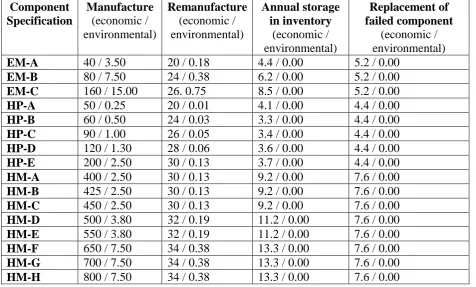
To derive quantitative sustainability impact predictions from the model, input data for the sustainability impact of individual events involved in the functional provision had to be derived. Whilst the exact sustainability impact of events was not critical provided that identical data was used for all compared cases, relevant data sourced from the public domain was used to increase realism. Data on the derived sustainability impact values are given in the supporting information, see Table B.7 for those corresponding to the event of system downtime and Table B.8 for those corresponding to the events of component manufacture, remanufacture, annual storage in spares inventory and replacement with a spare after failure.
4.3 Model Implementation
11
4.3.1 Implementation of the functional provision model
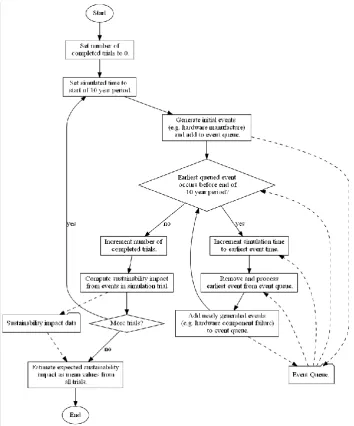
[image:11.595.77.432.125.552.2]A discrete event simulation (Leemis and Park 2005) implementation of the conceptual model was developed in the C# programming language (Hejlsberg et al. 2010).
Figure 5 - Overview of the discrete event simulation process.
12
functional provision over a 10-year period. During each trial, the sustainability impact in the economic and environmental dimensions from those events is recorded and total values for the 10-year period are then calculated. Expected values for the economic and environmental sustainability impact are then estimated as the average impact over repeated simulation trials. An overview of the discrete event simulation process is shown in Figure 5.
A difference from existing lifecycle simulation models, such as those from Fujimoto et al (Fujimoto et al. 2003) and Gäbel et al (Gäbel et al. 2004), lies in the explicit modelling of the distributed support network (as suggested by Garetti et al. (2012)) and of the interaction between each customer’s unique functional requirement and the performance of the installed hardware system. This facilitates analysis of the impact on sustainability from differences in the extent of rationalisation of chosen hardware and support sites that occur in the transition from traditional to FP arrangements.
4.3.2 Implementation of the optimization model
To conduct a fair comparison between the cases, the Pareto optimal solutions in terms of economic and environmental sustainability impact must be found. An implementation of the NSGA-II (Deb et al. 2002) multi-objective genetic algorithm was used for this purpose.
Solutions were encoded as genomes (see Figure 6) comprising of a sequence of integers representing the choices of hardware system, support site and minimum service level for each customer functional application (with actual service level at each support site then defined as the maximum service level across all functional applications supported by that site).
[image:12.595.71.520.406.427.2]H1 … H20 C1 … C20 S1 … S20
Figure 6- Genome representing a solution to the customer functional requirements, where Hnis an integer representing the choice from the feasible set of hardware for functional application n, Cn is an integer representing the choice of customer
support site for functional application n and Sn is the minimum service level for support of functional application n.
The variables that were set as free for optimization and those that were fixed were set differently for each case so that the resultant optimal solutions corresponded to those that would occur with the constraints of that B2B scenario (see Section 3). In traditional cases 1 and 2, the hardware system with the lowest manufacturing cost from the feasible set for each application was set as a fixed choice. In contrast, for traditional case 3 and the FP case, the choice within the feasible set was set as a free variable for optimization. For traditional cases 1 and 3, the local support site was set as a fixed choice for each customer functional application. In traditional case 2 and the FP case however, the choice of support site for each customer functional application was set as a free variable for optimization. The minimum service level for each support site was set as a free variable for all of the cases.
13
solutions both from the same front, then the solution that had the largest crowding distance. The crowding distance metric therefore helped to ensure a wider spread of solutions across the Pareto front. Single-point crossover and random bit flip mutation were then used to generate offspring solutions from the selected parent solutions, following the standard genetic algorithm process (Srinivas and Patnaik 1994). Solutions from the current generation and offspring were then combined and the next generation is formed by filling each domination front until the population size reaches the desired size. This process is then repeated for the desired number of generations at which point the Pareto optimal solutions are output as the result of the automated design synthesis process.
The settings for the NSGA-II algorithm were chosen as follows based on recommended settings for genetic algorithms (De Jong and Spears 1991) and trial and error: population size of 120, cross-over probability of 0.6, mutation probability 0.02 and number of generations of 100,000.
4.4 Solution Generation
For each case, generating the Pareto optimal solutions took approximately 5 minutes using a standard desktop computer. The economic and environmental sustainability impact for the Pareto optimal solutions were plotted for each of the four cases. A representative solution was also chosen for each case to enable comparison of the contributors to sustainability impact and identification of any differences in the solution properties.
5
Results
14
[image:14.595.87.513.75.304.2]
Figure 7 - Plots of the economic and environmental impact for the solutions from the Pareto optimal set for each case.
A single solution from the Pareto set of each case was selected, as shown in Figure 7, for further analysis of the areas from which economic and environmental impact was incurred. Figure 8 and Figure 9 show the contributors to economic and environmental impact respectively for the selected solutions from each of the cases. They show that for all cases in the example scenario, energy and downtime are the highest contributors to economic impact, whilst energy and hardware manufacture are the highest contributors to environmental impact. Manufacture also contributes significantly to both economic and environmental sustainability due to the high cost and amount of materials and processing involved in the production of the drive systems.
Figure 8 - Plot of economic impact from selected solutions for each case.
0 20000 40000 60000 80000 100000 120000
Energy Downtime Travel Spares
Inventory
Hardware Remanufacture
Hardware Manufacture
Component Replacement
Econ
m
o
ic Su
sta
in
ab
ili
ty
Im
p
act
(10
00
Sw
ed
is
h
Kron
a)
[image:14.595.75.561.479.686.2]15
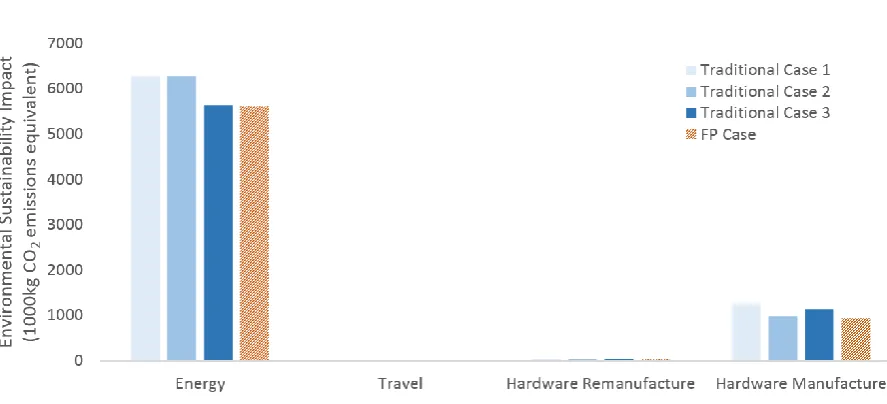
Figure 9 – Plot of environmental impact from selected solutions for each case.
Hardware remanufacture and storage of spares in inventory each give a small contribution to economic impact, whilst travel and component replacement have negligible impact for sustainability in the example scenario. Energy has a considerable impact on sustainability in the example scenario, since although the impact per kilowatt hour consumed is very low and drive systems are efficient, the functional applications in the example scenario require sustained high power outputs. Downtime is also a major contributor to economic impact in the scenario, despite the high reliability of the drive systems, since the functional applications are critical to the operation of the customers’ businesses. The contributions to sustainability from component replacement, remanufacture, travel and inventory storage are small primarily due to the hydraulic drive systems having high reliability thus meaning that service support involving component replacement and remanufacture occur only infrequently and small component inventories at each support site are sufficient for maintaining high availability.
Comparing the selected solutions from the four cases, traditional cases 1 and 2 have higher economic and environmental sustainability impact from energy consumption than the other cases due to the use of the hardware systems with the lowest manufacture cost amongst the feasible set which may not be the most energy efficient in the applications. In terms of the economic impact from downtime, traditional case 2 is the worst and significantly higher than traditional case 1 which in turn is higher than in traditional case 3. The higher economic impact from downtime in traditional case 2 can therefore be attributed to the combination of (1) hardware systems that are lowest cost rather than optimized for reliability and (2) extended restoration times when failure occurs due to the use of non-local shared support sites causing delays obtaining spares and longer spare inventory replacement times.
16
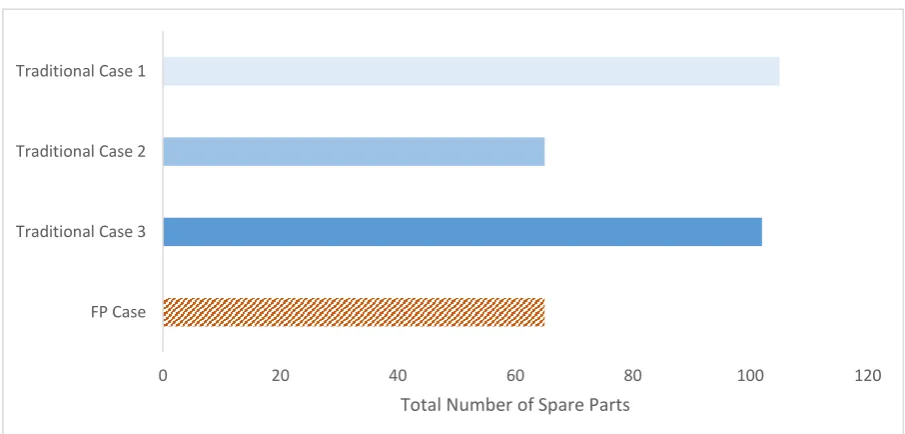
[image:16.595.76.529.164.381.2]inventories, explaining the higher sustainability impact from hardware manufacture in these cases. Another finding was that the hardware system specification for every customer application varied between the selected Pareto optimal solutions in each case, for example the chosen hardware was different for 65% of the customer applications when comparing the selected solutions in traditional case 1 and the FP case.
Figure 10 - Comparison of total number of spares from selected solutions for each case.
6
Conclusions
Based on existing research, the hypothesis that Functional Productization could simultaneously improve economic and environmental sustainability was formulated, in part due to the freedom of choice for the provider and retained ownership of solutions. To fairly test this, a simulation modelling approach was developed to compare Pareto optimal solutions at different stages of the transition to Functional Products. This was applied to analyze four different cases in one example scenario (i.e. same for all cases) within northern Sweden involving a hydraulic drive provider and set of customers with rotational power applications. The four cases represented the transition from traditional products to FP, with the results showing a substantial advantage in both economic and environmental sustainability for the FP case in the scenario.
These results provide quantified evidence that when a provider is given the freedom to choose the product constituents and will be responsible for the costs of functional provision through an FP arrangement, sustainability benefits can be obtained compared to the traditional arrangement – thus indicating that the hypothesis is justified. In scenarios where the same dual advantages exist of increased scope for optimization through use of the provider’s superior knowledge of solution performance and freedom of the provider to rationalize the service support system across customers, it is expected this result will also hold. The variation in hardware system from the Pareto optimal solutions between traditional and FP cases found in the example scenario indicates that FP businesses might also benefit from developing specific hardware, an interesting area for future research.
0 20 40 60 80 100 120
FP Case Traditional Case 3 Traditional Case 2 Traditional Case 1
17
7
Acknowledgement
The researchers gratefully acknowledge the contribution from the Swedish Governmental Agency for Innovation Systems (VINNOVA) for funding The Faste Laboratory, Centre for Functional Product Innovation at Luleå University of Technology.
8
References
Abramovici, M., Y. Aidi, A. Quczada, and T. Schindler. 2014. PSS Sustainability Assessment and Monitoring framework (PSS-SAM) - Case study of a multi-module PSS solution.
Procedia CIRP 16: 140–145.
Agrawal, V. V. and I. Bellos. 2017. The Potential of Servicizing as a Green Business Model.
Management Science 63(5): 1545–1562. https://doi.org/10.1287/mnsc.2015.2399.
Agrawal, V. V., M. Ferguson, L.B. Toktay, and V.M. Thomas. 2012. Is Leasing Greener
Than Selling? Management Science 58(3): 523–533.
https://doi.org/10.1287/mnsc.1110.1428.
Alonso-Rasgado, T., G. Thompson, and B.-O. Elfström. 2004. The design of functional (total care) products. Journal of Engineering Design 15(6): 515–540. http://dx.doi.org/10.1080/09544820412331271176.
Arena, M., N.D. Ciceri, S. Terzi, I. Bengo, G. Azzone, and M. Garetti. 2009. A state-of-the-art of industrial sustainability : definitions , tools and metrics. International Journal of
Product Lifecycle Management 4(1–3): 207–251.
https://doi.org/10.1504/IJPLM.2009.031674.
Bakshi, N., S.-H. Kim, and N. Savva. 2015. Signaling New Product Reliability with
After-Sales Service Contracts. Management Science 61(8): 1812–1829.
https://doi.org/10.1287/mnsc.2014.2029.
Bond, A., A. Morrison-Saunders, and J. Pope. 2012. Sustainability assessment: The state of the art. Impact Assessment and Project Appraisal 30(1): 53–62.
Brännström, O., B.-O. Elfström, and G. Thompson. 2001. Functional products widen the scope of product development and create new demands on product development organisations. International Conference on Engineering Design.
Bratt, C., S. Hallstedt, K.H. Robèrt, G. Broman, and J. Oldmark. 2011. Assessment of eco-labelling criteria development from a strategic sustainability perspective. Journal of
Cleaner Production 19(14): 1631–1638.
http://dx.doi.org/10.1016/j.jclepro.2011.05.012.
Deb, K., A. Pratap, S. Agarwal, and T. Meyarivan. 2002. A fast and elitist multiobjective genetic algorithm: NSGA-II. IEEE Transactions on Evolutionary Computation 6(2): 182–197. http://dx.doi.org/10.1109/4235.996017.
Delai, I. and S. Takahashi. 2011. Sustainability measurement system: a reference model
proposal. Social Responsibility Journal 7(3): 438–471.
http://dx.doi.org/10.1108/17471111111154563.
Fujimoto, J., Y. Umeda, T. Tamura, T. Tomiyama, and F. Kimura. 2003. Development of Service-Oriented Products Based on the Inverse Manufacturing Concept.
Environmental Science and Technology 37(23): 5398–5406.
Gäbel, K., P. Forsberg, and A.M. Tillman. 2004. The design and building of a lifecycle-based process model for simulating environmental performance, product performance and cost in cement manufacturing. Journal of Cleaner Production 12(1): 77–93. Garetti, M., P. Rosa, and S. Terzi. 2012. Life Cycle Simulation for the design of
Product-Service Systems. Computers in Industry 63: 361–369.
Gautam, N. 2012. Analysis of Queues: Methods and Applications. CRC Press.
Guajardo, J.A., M.A. Cohen, S.-H. Kim, and S. Netessine. 2012. Impact of Performance-Based Contracting on Product Reliability: An Empirical Analysis. Management Science 58(5): 961–979. https://doi.org/10.1287/mnsc.1110.1465.
Hejlsberg, A., M. Torgersen, S. Wiltamuth, and P. Golde. 2010. C# Programming
Language. 4th ed. Addison-Wesley Professional.
Hillbom, J. 1997. Powerful Engineering. Hägglunds Drives.
18
sustainable model of products. In Re-Engineering for Sustainable Industrial
Production, ed. by L. M. Camarinha-Matos, 247–258. Springer.
Jong, K.A. De and W.M. Spears. 1991. An analysis of the interacting roles of population size and crossover in genetic algorithms. In Parallel Problem Solving from Nature: 1st
Workshop, ed. by Hans-Paul Schwefel and Reinhard Männer, 38–47. Berlin,
Heidelberg: Springer Berlin Heidelberg. http://dx.doi.org/10.1007/BFb0029729. Joung, C.B., J. Carrell, P. Sarkar, and S.C. Feng. 2012. Categorization of indicators for
sustainable manufacturing. Ecological Indicators 24: 148–157.
http://dx.doi.org/10.1016/j.ecolind.2012.05.030.
Kim, S.-H., M.A. Cohen, and S. Netessine. 2017. Reliability or Inventory? An Analysis of Performance-Based Contracts for Product Support Services. In Handbook of
Information Exchange in Supply Chain Management, ed. by Albert Y Ha and
Christopher S Tang, 65–88. Springer International Publishing.
https://doi.org/10.1007/978-3-319-32441-8_4.
Kirkpatrick, S., C.D. Gelatt, and M.P. Vecchi. 1983. Optimization by Simulated Annealing.
Science 220(4598): 671–680. https://doi.org/10.1126/science.220.4598.671.
Kyösti, P. and S. Reed. 2015. Prediction of service support costs for functional products.
Simulation Modelling Practice and Theory 59: 52–70.
https://doi.org/10.1016/j.simpat.2015.09.001.
Leemis, L. and S.K. Park. 2005. Discrete Event Simulation: A First Course. 1st ed. Prentice Hall. https://doi.org/10.1057/palgrave.jos.4250012.
Lindahl, P., K.H. Robèrt, H. Ny, and G. Broman. 2014. Strategic sustainability considerations in materials management. Journal of Cleaner Production 64: 98–103. http://dx.doi.org/10.1016/j.jclepro.2013.07.015.
Lindström, J., A. Dagman, and M. Karlberg. 2014. Functional Products Lifecycle: Governed
by sustainable Win-Win Situations. Procedia CIRP 22: 163–168.
https://doi.org/10.1016/j.procir.2014.06.154.
Lindström, J., M. Löfstrand, M. Karlberg, and L. Karlsson. 2012. A development process for Functional Products: hardware, software, service support system and management of operation. International Journal of Product Development 16(3/4): 284–303. https://doi.org/10.1504/IJPD.2012.049831.
Lindström, J., D. Sas, H. Lideskog, M. Löfstrand, and L. Karlsson. 2015. Defining “Functional Products” through their constituents. International Journal of Product
Development 20(1). http://dx.doi.org/10.1504/IJPD.2015.067273.
Löfstrand, M., J. Andrews, M. Karlberg, and L. Karlsson. 2011. Functional product system availability : simulation-driven design and operation through coupled multi-objective optimisation. International Journal of Product Development 13(2): 119–131. https://doi.org/10.1504/IJPD.2011.038868.
Löfstrand, M., P. Kyösti, S. Reed, and B. Backe. 2014. Evaluating availability of functional products through simulation. Simulation Modelling Practice and Theory 47: 196–209. https://doi.org/10.1016/j.simpat.2014.05.011.
Markeset, T. and U. Kumar. 2005. Product support strategy: conventional versus functional products. Journal of Quality in Maintenance Engineering 11(1): 53–67. http://www.emeraldinsight.com/10.1108/13552510510589370.
MathWorks. 2017. Global Optimization Toolbox [Computer Software]. Massachusetts, USA. https://www.mathworks.com/. Accessed October 1, 2017.
Miller, B.L. and D.E. Goldberg. 1995. Genetic Algorithms, Tournament Selection and the Effects of Noise. Complex Systems 9.
Mont, O. 2001. Introducing and developing a Product-Service System (PSS) concept in
Sweden. The International Institute for Industrial Environmental Economics.
Mont, O.. 2002. Clarifying the concept of product–service system. Journal of Cleaner
Production 10(3): 237–245. https://doi.org/10.1016/S0959-6526(01)00039-7.
Morlet, A., J. Blériot, R. Opsomer, M. Linder, A. Henggeler, A. Bluhm, and A. Carrera. 2016. Intelligent Assets: Unlocking the Circular Economy Potential. Ellen MacArthur
Foundation.
19
Reliability 35(2): 4–19. http://dx.doi.org/10.1080/09617353.2015.11691038.
Reiskin, E.D., A.L. White, J.K. Johnson, and T.J. Votta. 1999. Servicizing the chemical
supply chain. Journal of Industrial Ecology 3(2–3): 19–31.
https://doi.org/10.1162/108819899569520.
Roy, R., A. Shaw, J.A. Erkoyuncu, and L. Redding. 2013. Through-Life Engineering
Services. Measurement and Control 46(6): 172–175.
https://doi.org/10.1177/0020294013492283.
Spector, P.E. 1981. Reseach Designs: Quantitative Applications in the Social Sciences. Sage Publications.
Srinivas, M. and L.M. Patnaik. 1994. Genetic Algorithms: A Survey. Computer 27(6): 17– 26.
Tukker, A. 2004. Eight types of product–service system: eight ways to sustainability? Experiences from SusProNet. Business Strategy and the Environment 13(4): 246– 260. https://doi.org/10.1002/bse.414.
Tukker, A. and U. Tischner. 2006. Product-services as a research field: past, present and future. Reflections from a decade of research. Journal of Cleaner Production 14(17): 1552–1556. https://doi.org/10.1016/j.jclepro.2006.01.022.
Umeda, Y., A. Nonomura, and T. Tomiyama. 2000. Study on life-cycle design for the post mass production paradigm. Artificial Intelligence for Engineering Design, Analysis and
Manufacturing: AIEDAM 14(2): 149–161.
United Nations. 2013. World Population Prospects: The 2012 Revision. Population and
Development Review 36: 775–801.
Wiedmann, T.O., H. Schandl, M. Lenzen, D. Moran, S. Suh, J. West, and K. Kanemoto. 2015. The material footprint of nations. PNAS 112(20): 6271–6276. https://doi.org/10.1073/pnas.1220362110.
Yeaple, F. 1995. Fluid Power Design Handbook. Third. CRC Press.
9
Supporting Information
9.1 Appendix A
20 9.2 Appendix B
Table B.1 - Customer functional applications.
Customer Application
Name
Location Functional operating profile – (percent time / speed in
RPM / torque in kNm)
1 Kiruna Central (30 / 55 / 45); (20 / 70 / 40); (30 / 45 / 30); (20 / 20 / 25). 2 Kiruna East (15 / 0 / 0); (30 / 30 / 35); (55 / 35 / 28).
3 Rautas (10 / 0 / 0); (30 / 95 /20); (30 / 95 / 30); (30 / 95 / 40). 4 Pajala (20 / 0 / 0); (80 / 25 / 130).
5 Gällivare (50 / 0 / 0); (10 / 20 / 30); (10 / 25 / 30); (30 / 35 / 30). 6 Koskullskulle (45 / 100 / 10); (15 / 90 / 10); (30 / 80 / 10); (10 / 70 / 10). 7 Jokkmokk (10 / 0 / 0); (50 / 150 / 10); (40 / 150 / 5).
8 Porjus (15 / 0 / 0); (85 / 100 / 20).
9 Nattavarra (20 / 0 / 0); (70 / 20 / 60); (10 / 15 / 40). 10 Granan (10 / 0 / 0); (90 / 40 / 25).
11 Kalix (5 / 0 / 0); (55 / 20 / 95); (10 / 25 / 40); (30 / 15 / 40). 12 Boden (20 / 45 / 25); (35 / 20 / 45); (15 / 40 / 20).
13 Luleå (20 / 0 / 0); (80 / 160 / 8).
14 Kallax (30 / 0 / 0); (15 / 30 / 40); (55 / 35 / 30).
15 Piteå (30 / 25 / 35); (30 / 60 / 45); (10 / 45 / 30); (30 / 45 / 25). 16 Rosvik (10 / 0 / 0); (25 / 45 / 25); (35 / 20 / 40); (30 / 35 / 25). 17 Storsund (5 / 0 / 0); (60 / 90 / 30); (15 / 75 / 40); (20 / 15 / 25). 18 Överkalix (70 / 5 / 115); (30 / 10 / 80).
[image:20.595.73.526.494.566.2]19 Älvsbyn (45 / 100 / 10); (15 / 90 / 10); (30 / 80 / 10); (10 / 70 / 10). 20 Skaulo (15 / 0 / 0); (55 / 10 / 100); (5 / 25 / 120); (25 / 5 / 4).
Table B.2 - Electric motor component specifications.
Electric motor component specification Maximum power output (kW) when
operating at a speed of 1500 RPM
EM-A 140
EM-B 280
EM-C 550
Table B.3 - Hydraulic pump module specifications.
Hydraulic pump component specification Maximum flow rate (litres per minute)
HP-A 250
HP-B 300
HP-C 500
HP-D 750
[image:20.595.76.533.599.686.2]21
Table B.4 - Hydraulic motor module specifications.
Hydraulic motor module
Displacement (litres)
Maximum speed (RPM)
Maximum pressure (bar)
HM-A 3 200 300
HM-B 7 170 300
HM-C 12 120 300
HM-D 18 100 250
HM-E 21 80 250
HM-F 25 55 250
HM-G 38 35 250
[image:21.595.73.527.284.472.2]HM-H 45 35 250
Table B.5 - Hydraulic Drive System specifications.
System specification
Electric motor specification
Hydraulic pump specification
Number of electric motor
and pump pairs
Hydraulic motor specification
A C E 1 A
B A A 5 B
C B B 5 C
D B C 4 D
E B C 4 E
F C D 2 F
G C D 2 G
H B C 3 H
Table B.6 - Component replacement and remanufacture times.
Component Type Time to replace failed
component with spare
Time to remanufacture component
Electric Motor 5 hours 21 days
Hydraulic Pump 4 hours 14 days
[image:21.595.67.531.502.576.2]22
Table B.7 – Sustainability impact per hour downtime in each customer functional application.
Customer functional application name
Economic impact per hour downtime (e.g. lost
production)
Customer functional
application name
Economic impact per hour downtime (e.g. lost
production)
1 120 11 125
2 50 12 60
3 220 13 120
4 50 14 80
5 200 15 200
6 90 16 25
7 400 17 5
8 75 18 90
9 40 19 40
[image:22.595.62.539.368.655.2]10 15 20 20
Table B.8 - Sustainability impact from events for components of each specification.
Component Specification
Manufacture
(economic / environmental)
Remanufacture
(economic / environmental)
Annual storage in inventory
(economic / environmental)
Replacement of failed component
(economic / environmental)
EM-A 40 / 3.50 20 / 0.18 4.4 / 0.00 5.2 / 0.00
EM-B 80 / 7.50 24 / 0.38 6.2 / 0.00 5.2 / 0.00
EM-C 160 / 15.00 26. 0.75 8.5 / 0.00 5.2 / 0.00
HP-A 50 / 0.25 20 / 0.01 4.1 / 0.00 4.4 / 0.00
HP-B 60 / 0.50 24 / 0.03 3.3 / 0.00 4.4 / 0.00
HP-C 90 / 1.00 26 / 0.05 3.4 / 0.00 4.4 / 0.00
HP-D 120 / 1.30 28 / 0.06 3.6 / 0.00 4.4 / 0.00
HP-E 200 / 2.50 30 / 0.13 3.7 / 0.00 4.4 / 0.00
HM-A 400 / 2.50 30 / 0.13 9.2 / 0.00 7.6 / 0.00
HM-B 425 / 2.50 30 / 0.13 9.2 / 0.00 7.6 / 0.00
HM-C 450 / 2.50 30 / 0.13 9.2 / 0.00 7.6 / 0.00
HM-D 500 / 3.80 32 / 0.19 11.2 / 0.00 7.6 / 0.00
HM-E 550 / 3.80 32 / 0.19 11.2 / 0.00 7.6 / 0.00
HM-F 650 / 7.50 34 / 0.38 13.3 / 0.00 7.6 / 0.00
HM-G 700 / 7.50 34 / 0.38 13.3 / 0.00 7.6 / 0.00
23
Figure B.1 - Plot showing efficiency and failure rate acceleration factor of electric motors against proportion of maximum output power when operating at a speed of 1500 RPM.
Figure B.2 - Plot showing variation in the efficiency for hydraulic pumps with proportion of maximum flow rate and pressure.
0 0.2 0.4 0.6 0.8 1 1.2 1.4 1.6 1.8 2
0 10 20 30 40 50 60 70 80 90 100
0 10 20 30 40 50 60 70 80 90 100
Failu
re
ra
te a
cce
le
ra
tio
n
f
act
o
r
Ef
fici
en
cy
(%
)
Power output (% maximum)
[image:23.595.115.513.451.603.2]24
Figure B.3 – Failure rate acceleration factor plot for hydraulic pump.
Figure B.4 – Plot for hydraulic motors showing variation in volumetric loss against pressure differential and variation in pressure loss against speed.
0 10 20 30 40 50 60 70 80 90 100
0 2 4 6 8 10 12 14 16 18 20
0 5 10 15 20 25 30 35 40 45
0 10 20 30 40 50 60 70 80 90 100
Speed (% Maximum)
Pres
su
re
los
s
(b
ar
)
Volu
m
etric
los
s
(li
tres
p
er
m
in
u
te)
Pressure differential (% maximum)
[image:24.595.82.521.275.553.2]25
[image:25.595.90.505.185.530.2]Figure B.5 – Failure rate acceleration factor plot for hydraulic motor.