A COMPARATIVE STUDY ON THE PERFORMANCE OF INDEX FUNDS
Associate Professor, Department of Commerce, Christ University,
ARTICLE INFO ABSTRACT
An Index Fund is a passively managed scheme investing mainly in equity shares of only those companies comprised in indices like the S&P CNX Nifty that may be defined from time to time. Investors need to know how risky index schemes are and what would be its contribution to the total risk of a portfolio. Before investing investors would also want to know which funds gives more return, which fund is performing well, which fund is more risky e
performance of the selected index funds by comparing it with the benchmark S&P CNX Nifty. The present study does these using certain key statistics. With the help of these key statistics an investor can analyze different Index F
A sample of 10 Index Funds have been taken for the analysis. For the analysis of risk of these funds Standard deviation and Beta is used. For the performance on Risk
along with ratios such as Treynor ratio and Jensen Alpha. Also, the sample funds are compared with a benchmark Nifty to find out how well they are performing with respect to the market. Based on the quantitative study conducted between
2005 to 2011 it is found that there is no significant difference of volatility between the two.
Copyright©2017, Dr. Sivakumar. This is an open access article distributed under the Creative distribution, and reproduction in any medium, provided the original work is properly cited.
INTRODUCTION
An index fund is a passively managed scheme investing mainly in equity shares of only those companies comprised in the stock index as may be defined from time to time. Before investing investors would want to know which funds give more return, which fund is performing well, which fund is more risky etc. The index funds have a similar return as that of the tracking index. So much cannot be said about the performance of index funds based on return alone. Investors would also need to know how risky index funds are and what would be its contribution to the total risk of a portfolio. In this study, the performance of the index funds i
the level of risk each fund possesses and the risk analysis. The comparison of these funds with S&P CNX Nifty also gives an idea about the fund’s growth.
LITERATURE REVIEW
Dr. Narayan Rao evaluated the performance of Indian
Mutual Fund Schemes in a bear market using relative performance index, risk-return analysis, Treynor’s ratio, Sharpe’s ratio, Jensen’s measure, Fama’s measure.
*Corresponding author: Dr. Sivakumar, S.,
Associate Professor, Department of Commerce, Christ University, Hosur Road, Bengaluru -560029, Karnataka, India
ISSN: 0975-833X
Article History: Received 18th July, 2017
Received in revised form 24th August, 2017
Accepted 15th September, 2017
Published online 31st October, 2017
Citation:Dr. Sivakumar, S.2017. “A comparative study on the performance of index funds 60011. Key words: Index schemes, Return, risk, Benchmark, Volatility.
RESEARCH ARTICLE
A COMPARATIVE STUDY ON THE PERFORMANCE OF INDEX FUNDS
*Dr. Sivakumar, S.
Associate Professor, Department of Commerce, Christ University, Hosur Road, Bengaluru
Karnataka, India
ABSTRACT
An Index Fund is a passively managed scheme investing mainly in equity shares of only those companies comprised in indices like the S&P CNX Nifty that may be defined from time to time. estors need to know how risky index schemes are and what would be its contribution to the total risk of a portfolio. Before investing investors would also want to know which funds gives more return, which fund is performing well, which fund is more risky e
performance of the selected index funds by comparing it with the benchmark S&P CNX Nifty. The present study does these using certain key statistics. With the help of these key statistics an investor can analyze different Index Funds and put his/her money in a fund which suits his/her risk perception. A sample of 10 Index Funds have been taken for the analysis. For the analysis of risk of these funds Standard deviation and Beta is used. For the performance on
Risk-along with ratios such as Treynor ratio and Jensen Alpha. Also, the sample funds are compared with a benchmark Nifty to find out how well they are performing with respect to the market. Based on the quantitative study conducted between the schemes and the S&P CNX Nifty for the study period i.e. 2005 to 2011 it is found that there is no significant difference of volatility between the two.
is an open access article distributed under the Creative Commons Attribution License, which reproduction in any medium, provided the original work is properly cited.
An index fund is a passively managed scheme investing mainly in equity shares of only those companies comprised in index as may be defined from time to time. Before investing investors would want to know which funds give more return, which fund is performing well, which fund is more risky etc. The index funds have a similar return as that of cannot be said about the performance of index funds based on return alone. Investors would also need to know how risky index funds are and what would be its contribution to the total risk of a portfolio. In this study, the performance of the index funds is measured using the level of risk each fund possesses and the risk-return analysis. The comparison of these funds with S&P CNX Nifty
evaluated the performance of Indian Mutual Fund Schemes in a bear market using relative return analysis, Treynor’s ratio, Sharpe’s ratio, Jensen’s measure, Fama’s measure.
ssor, Department of Commerce, Christ University, 560029, Karnataka, India.
The study finds that Medium Term Debt Funds were the best performing funds during the bear period of September 98-April 2002 and 58 of 269 open ended mutual funds provided better returns than the overall market returns.
Prof. Ashok Banerjee et al
Style Analysis to evaluate equity mutual funds in India using quadratic optimization of an asset class factor model proposed by William Sharpe and analysis of the relative performance of the funds with respect to their style benchmarks. Their study found that the mutual funds generated positive monthly returns on the average, during the study period of January 2000 through June 2005. The ELSS funds lagged the Growth funds or all funds taken together, with respect to returns generated. The mean returns of the growth funds or all funds were not only positive but also significant. The ELSS funds also demonstrated marginally higher volatility than the Growth funds.
Sharad Panwar and Dr. Madhumathi (2006)
identified differences in characteristics of public sponsored & private-sector sponsored mutual funds find the extent of diversification in the portfolio of securities of public-sector sponsored and private
mutual funds and compar
sector sponsored and privatesector sponsored mutual
International Journal of Current Research
Vol. 9, Issue, 10, pp.60007-60011, October, 2017
A comparative study on the performance of index funds”,International Journal of Current Research
Available online at http://www.journalcra.com
A COMPARATIVE STUDY ON THE PERFORMANCE OF INDEX FUNDS
Hosur Road, Bengaluru -560029,
An Index Fund is a passively managed scheme investing mainly in equity shares of only those companies comprised in indices like the S&P CNX Nifty that may be defined from time to time. estors need to know how risky index schemes are and what would be its contribution to the total risk of a portfolio. Before investing investors would also want to know which funds gives more return, which fund is performing well, which fund is more risky etc. This study analyses the performance of the selected index funds by comparing it with the benchmark S&P CNX Nifty. The present study does these using certain key statistics. With the help of these key statistics an investor unds and put his/her money in a fund which suits his/her risk perception. A sample of 10 Index Funds have been taken for the analysis. For the analysis of risk of these funds -Return - Sharpe ratio has been used along with ratios such as Treynor ratio and Jensen Alpha. Also, the sample funds are compared with a benchmark Nifty to find out how well they are performing with respect to the market. Based on the the schemes and the S&P CNX Nifty for the study period i.e. 2005 to 2011 it is found that there is no significant difference of volatility between the two.
ribution License, which permits unrestricted use,
The study finds that Medium Term Debt Funds were the best performing funds during the bear period of April 2002 and 58 of 269 open ended funds provided better returns than the overall
et al. (2007), used Return Based
Style Analysis to evaluate equity mutual funds in India using quadratic optimization of an asset class factor model proposed by William Sharpe and analysis of the relative performance of the funds with respect to their heir study found that the mutual funds generated positive monthly returns on the average, during the study period of January 2000 through June 2005. The ELSS funds lagged the Growth funds or all funds taken together, with respect to returns mean returns of the growth funds or all funds were not only positive but also significant. The ELSS funds also demonstrated marginally higher volatility than the Growth funds.
Sharad Panwar and Dr. Madhumathi (2006),
identified differences in characteristics of public-sector sector sponsored mutual funds find the extent of diversification in the portfolio of securities sector sponsored and private-sector sponsored mutual funds and compare the performance of public-sector sponsored and privatepublic-sector sponsored mutual
INTERNATIONAL JOURNAL OF CURRENT RESEARCH
60007-funds using traditional investment measures. They primarily use Jensen’s alpha, Sharpe information ratio, excess standard deviation adjusted return and find out that portfolio risk characteristics measured through private-sector Indian sponsored mutual funds seems to have outperformed both Public- sector sponsored and Private-sector foreign sponsored mutual funds and the general linear model of analysis of covariance establishes differences in performance among the three classes of mutual funds in terms of portfolio diversification.
Need for the Study
Index fund is a passively managed scheme investing mainly in equity shares of only those companies comprised in the S&P CNX Nifty Index as may be defined from time to time. Hence comparison of these funds with S&P CNX Nifty Index gives an idea about the fund’s growth. This study analyses the performance of selected index funds compared with the benchmark S&P CNX Nifty which tells about the volatility of both the funds and the benchmark index. Then a comparative analysis of the mutual fund schemes is done to see which fund has performed the best.
Objectives of the Study
To study the performance of the selected index funds.
To make a comparison between the NAVs of the selected index funds and S&P CNX Nifty.
To offer suggestion to the investors for the selection of index funds.
Period of the Study
The study covered a period of 7 years from 2010 to 2016 to assess the performance of the schemes in terms of returns.
Data Collection
A major portion of the data in this study has been collected through secondary sources of data. They are from:
Published material and annual reports of mutual fund companies
Other published material of mutual funds.
Research based online portals.
Official websites of AMCs.
AMFI website.
Basis of selection of the index funds
The funds selected for the purpose of analysis are on the basis of the following criteria:
All the funds are open ended funds.
All the funds are growth funds.
All the funds are based on the benchmark S&P CNX Nifty Index.
The funds selected have an inception date before 5 years.
Tools used in the study
Beta: It describes the relationship between the stock’s return
and the index returns. The beta value may be interpreted in the following manner, ‘a 1% change in Nifty index would cause a 1.042% (beta) change in the particular fund. It signifies that a fund with a beta of more than 1 will rise more than the market and also fall more than market. Thus, if one likes to beat the market on the upside, it is best to invest in a high-beta fund.
But one must keep in mind that such a fund will also fall more than the market on the way down. So, over an entire cycle, returns may not be much higher than the market. Mathematically,
Beta (β) = Covariance (portfolio’s NAV, Market Index) Variance (Market Index)
Sharpe Ratio
While an investor seeks to generate high returns the question arises, how high? Though the sky is the limit, usually one asks for returns, which are higher than those, which we are normally accustomed to. These are returns from risk-less instruments like treasury bills, government securities or bank saving deposits. So the aim of investing seems to be to generate returns in excess of the risk free return.
Mathematically, Sharpe Ratio = (rp - rf)/ σp
[image:2.595.128.472.370.554.2]List of Selected funds
Table 1.2
Index fund Index Launched Issuer
1 Principal Index Fund S&P CNX Nifty Jul 1999 Principal PNB AMC Pvt. Ltd
2 UTI Nifty Index Fund S&P CNX Nifty Mar 2000 UTI AMC Pvt. Ltd.
3 Franklin India Index
Fund
S&P CNX Nifty Jun 2000 Franklin Templeton
AMC (India) Pvt. Ltd.
4 SBI Magnum Index
Fund
S&P CNX Nifty Dec 2001 SBI Funds
Management Ltd.
5 ICICI Prudential Index
Fund
S&P CNX Nifty Feb 2002 ICICI Prudential AMC
Ltd.
6 HDFC Index Fund –
Nifty Plan
S&P CNX Nifty Jul 2002 HDFC AMC Ltd.
7 Birla Sun Life Index
Fund
S&P CNX Nifty Sep 2002 Birla Sun Life AMC
Ltd.
8 LICMF Index Fund –
Nifty Plan
S&P CNX Nifty Nov 2002 LIC Mutual Fund
AMC Ltd
9 Tata Index Fund-Nifty
Plan
S&P CNX Nifty Feb 2003 Tata AMC Pvt. Ltd
10 ING Large Cap Equity
Fund
S&P CNX Nifty Jan 2004 ING Investment
where:
rp = Expected Portfolio return rf = Risk Free Rate
σp= Portfolio Standard Deviation
Jensen’s Alpha
The basic idea is that to analyze the performance of an investment is not only to look at the overall return of a portfolio, but also at the risk of that portfolio. For example, if there are two mutual funds that both have a 12% return, a rational investor will want the fund that is less risky. Jensen’s measure is one of the ways to help determine if a portfolio is earning the proper return for its level of risk. If the value is positive, then the portfolio is earning excess returns. In other words, a positive value for Jensen’s alpha means a fund manager has “beat the market” with his or her stock picking skills.
Mathematically, Jensen’s alpha = rp – [ rf + βp ( rm - rf )]
where:
rp = Expected Portfolio return rf = Risk Free Rate
βp= Beta of the portfolio rm = Expected market return
Treynor Ratio
The Treynor Ratio helps analyze returns in relation to the market risk of the fund. The Ratio, also known as the reward-to-volatility ratio, provides a measure of performance adjusted for market risk. Higher the Treynor Ratio, the better the performance of the fund under analysis.
Mathematically, Treynor Ratio = (rp - rf )/ βp
where:
rp = Expected Portfolio return rf = Risk Free Rate
βp= Beta of the portfolio
Standard Deviation
Standard deviation is a statistical measure that uses past performance of an investment or portfolio to determine the potential range of future performance and assess the probability of that performance. Standard deviations can be calculated for an individual security or for the entire portfolio. While standard deviation depicts how much the returns have deviated from the mean level, but it may not necessarily mean that a fund with low standard deviation is good and vice versa.
Table 2.1. Analysis of the index funds for the year 2010
Interpretation
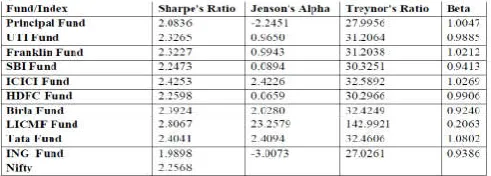
The above Table 2.1 shows that LICMF Index Fund – Nifty Plan has a higher Sharpe’s ratio than all other funds and also
[image:3.595.307.559.161.254.2]has a higher Sharpe’s ratio than the Nifty Index. It also has the highest positive Jenson's Alpha among the index funds. The fund also has a very high Treynor's Ratio among its peers. The fund also has a very low Beta of 0.2063, which means that it is has a very low risk. For the year ended 2010, LICMF Index Fund – Nifty Plan was the best performer. It even outperformed its benchmark Nifty Index.
Table 2.2. Analysis of the index funds for the year 2011
Interpretation
[image:3.595.308.562.406.517.2]The above Table 2.2 shows that SBI Magnum Index Fund has a higher Sharpe’s ratio than all other funds and also has a higher Sharpe’s ratio than the Nifty Index. It also has the highest positive Jenson's Alpha among the index funds. The fund also has a very high Treynor's Ratio among its peers. The fund also has a Beta of 0.9494, which means that it moves along with the Nifty Index. For the year ended 2011, SBI Magnum Index Fund was the best performer. It even outperformed its benchmark Nifty Index.
Table 2.3. Analysis of the index funds for the year 2012
Interpretation
[image:3.595.42.288.664.752.2]The above Table 2.3 shows that ICICI Prudential Index Fund has a higher Sharpe’s ratio than all other funds and also has a higher Sharpe’s ratio than the Nifty Index. It also has the highest positive Jenson's Alpha among the index funds. The fund also has a very high Treynor's Ratio among its peers. The fund also has a Beta of 0.9774, which means that it moves along with the Nifty Index. For the year ended 2012, ICICI Prudential Index Fund was the best performer. It even outperformed its benchmark Nifty Index.
Interpretation
[image:4.595.40.292.153.263.2]The year 2013 was a very bad year for the world’s economy as a whole. The stock markets were not spared either. All the Index Funds performed very badly. Even the Nifty Index performed very badly.
Table 2.5. Analysis of the index funds for the year 2014
Interpretation
[image:4.595.38.290.426.528.2]The above Table 2.5 shows that Franklin India Index Fund has a higher Sharpe’s ratio than all other funds and also has a higher Sharpe’s ratio than the Nifty Index. It also has the highest positive Jenson's Alpha among the index funds. ING Fund has a very high Treynor's Ratio among its peers. Beta of all the funds is similar and close to 1.0, which means that all the funds moved along with the Nifty Index. For the year ended 2014, Franklin India Index Fundwas the best performer. It even outperformed its benchmark Nifty Index.
Table 2.6. Analysis of the index funds for the year 2015
Interpretation
The above Table 2.6 shows that Birla Sun Life Index Fund has a higher Sharpe’s ratio than all other funds and also has a higher Sharpe’s ratio than the Nifty Index. It also has the highest positive Jenson's Alpha among the index funds. The fund also has a very high Treynor's Ratio among its peers. The fund also has a Beta of 0.9354, which means that it moves along with the Nifty Index. For the year ended 2015, Birla Sun Life Index Fund was the best performer. It even outperformed its benchmark Nifty Index.
Table 2.7. Analysis of the index funds for the year 2016
Interpretation
The year 2016 was very bad year for the stock markets. All the indices were down. The Index Funds which are based on the indices were also down.
FINDINGS
From the analysis of the NAV of the fund, the followings are found:
The moving averages of NAV of all the funds show that the upward swing started in the month of May 2010 and continued till the month of January 2013. The NAV’s of the schemes reached its peak in the month of January 2013.
From the month of February 2013, there was a downward plunge till the month of March 2014. The NAV’s of the schemes reached its lowest in the month March 2014.The recovery has started from the period of April 2014.
The analysis of the schemes and the S&P CNX Nifty for the study period i.e. 2010 to 2016 indicates that there is no significant difference between the two. This shows that the volatility of both is very similar.
Only during 2010, the best performing index fund i.e. LICMF Index Fund – Nifty Plan outperformed all other index funds on all parameters. During the rest of the study period the best performing index did not outperform the other index funds on all parameters.
Tata Index Fund-Nifty Plan, HDFC Index Fund – Nifty Plan and Principal Index Fund did not outperform the other index funds even on a single parameter during the study period.
BestPerformerduringthestudyPeriod
ICICI Prudential Index Fund had the most number of highest Sharpe’s Ratios during the study period.
ICICI Prudential Index Fund had the most number of highest Treynor’s Ratios during the study period.
ICICI Prudential Index Fund had the most number of highest Jensen’s Alphas during the study period.
ING Large Cap Equity Fund had the most number of lowest Betas during the study period.
It is also found that ING Large Cap Equity Fund was the least volatile index fund during the study period and ICICI Prudential Index Fund gave the highest return to the risk taken during the study period.
Conclusion
The study done on the performance evaluation of index funds was fruitful as all the objectives of the study were successfully achieved. The following are the findings from this study.
The index funds selected for the study gave returns in synchronization with the markets. When there was boom in the stock market the funds gave positive returns. During the recessionary phase the markets declined steadily and so did the fund returns.
[image:4.595.37.284.695.800.2]– Nifty Plan and the Principal Index Fund were outliers and gave returns very less than the market and also when compared to the other funds.
It can be easily concluded that most of the fund returns can be attributed to the market. There has been a tremendous growth in the mutual fund industry in India, attracting large investments not only from the domestic investments but also from the foreign investors
REFERENCES
Books
Kothari, C. R “Research Methodology – Methods and Techniques”, Wishwa Prakashan, New Delhi.
Ken Black, “Business Statistics for contemporary decision making”, Wiley India (P) Ltd., Fourth Edition.
Gupta, S.P. “Statistical Methods”, Sultan Chand & Sons Educational Publishers, New Delhi.
Journals
Carlos, Juan 2005. “Portfolio Performance: Factors or Benchmarks?”
Dr. Rao, Narayan “Performance Evaluation of Indian Mutual Funds”.
Panwar, Sharad and Dr. Madhumathi, 2006. “Characteristics and performance evaluation of selected mutual funds in India”.
Prof. Banerjee, Ashok et al., 2007. ”Performance Evaluation of Indian Mutual Funds vis-à-vis their style benchmarks” Rao, D.N 2006. “Investment styles and Performance of Equity
Mutual Funds in India”
Stehle, Richard and Grewe, Olaf 2001. Long-Run Performance of German Stock Mutual Funds”.