ISSN Print: 1940-9893
DOI: 10.4236/jssm.2019.122007 Feb. 1, 2019 116 Journal of Service Science and Management
Analysis of TJ Economic Vulnerability Based on
Set Pair Analysis
Lixia Zhang
Management School, Tianjin Normal University, Tianjin, China
Abstract
The vulnerability evaluation index system of Tianjin urban economic system was established; entropy method was used to determine the weight of each evaluation index. Then, the vulnerability of Tianjin urban economic system was measured from the perspectives of economy sensitivity and resilience using set pair analysis method. Studies show that during 2000-2014, the sen-sitivity of the Tianjin urban economic system to cope with adverse distur-bance, showing upward fluctuation, while the resilience showed a trend of rising. Generally, the vulnerability of Tianjin urban economic system is rising frequently and slowly.
Keywords
Vulnerability, Sensitivity, Resilience, Set Pair Analysis, Tianjin
1. Introduction
Timmerman P. first proposed the concept of vulnerability in 1981. Vulnerability refers to the ability of system or system components to bear and restore risk events, and it is used in the field of natural science [1]. Briguglio L. is the first person to apply the concept of vulnerability to the field of economy, and estab-lish the economic vulnerability index [2]. In 1999, UNDP formally puts forward the concept of “economic vulnerability”, defining the economic vulnerability as “the capacity of enduring the damage due to suffer from unexpected events in the process of economic development” [3]. Since then, a large number of re-search findings on economic vulnerability have emerged.
Summary on these articles about economic vulnerability mainly focuses on the tourism economic vulnerability [4], coalmine economic vulnerability [5], petroleum economic vulnerability [6], regional economic vulnerability [7], and
How to cite this paper: Zhang, L.X. (2019) Analysis of TJ Economic Vulnerability Based on Set Pair Analysis. Journal of Ser-vice Science and Management, 12, 116-125. https://doi.org/10.4236/jssm.2019.122007
Received: January 13, 2019 Accepted: January 29, 2019 Published: February 1, 2019 Copyright © 2019 by author(s) and Scientific Research Publishing Inc. This work is licensed under the Creative Commons Attribution International License (CC BY 4.0).
DOI: 10.4236/jssm.2019.122007 117 Journal of Service Science and Management
financial economic vulnerability [8], however, the study of a particular city eco-nomic vulnerability is relatively few.
Tianjin is located in the center of the Bohai coastal region in China, and only 120 km away from the capital city. The area of Tianjin is 11.9 thousand square kilometers, and the resident population is 10.1 million. Tianjin is the largest port city in North China as well as one of the earliest eastern coastal port cities in China. Early, Tianjin is the national business development center, even is at the core position in the economic development of Asia. After the liberation of Chi-na, Tianjin gradually fades out of the stage of economic development. In the past 10 years, the central government puts forward “the collaborative development of Beijing Tianjin Hebei”, “Bohai coastal region economic circle” and other major strategies, which make the economic development of Tianjin meet a new op-portunity. This paper takes Tianjin economy as the example, on the basic of economic vulnerability theory, using entropy method to analyze the economic vulnerability, sensitivity and resilience from 2000 to 2014, and further discusses the factors that cause Tianjin economic vulnerability increase slowly.
2. The Construction of Index System and the
Determination of Weight
2.1. The Construction of Index System
Urban economic vulnerability is a comprehensive attribute of a variety of eco-nomic indicators of a city, including two aspects of sensitivity and resilience. Sensitivity refers to the ability to withstand destruction when the economic sys-tem suffers the internal disorder and external shocks, the weaker the sensitivity is, and the less vulnerable the economic system is. Resilience refers to the ability to quickly adjust the economic system from crisis to security and stability, the stronger the resilience is, the stronger the self maintenance ability of the eco-nomic system is, and it can recover quickly from the adverse influence. The in-teraction of economic sensitivity and resilience jointly determine the economic vulnerability. When the economic vulnerability is large, the ability of the econ-omy to withstand all kinds of crisis destruction is worse, and the speed of economy returns to steady state is slower, the whole economic system is in a un-safe state, whereas the economic system is more secure.
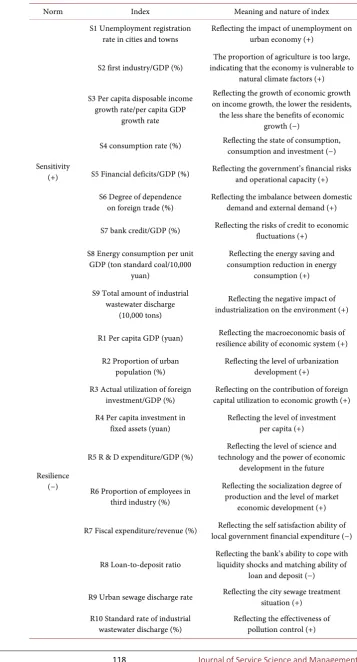
Economy sensitivity and resilience are multiple structural variables, which contain very complex economic environmental factors. In order to comprehen-sively reflect the degree of Tianjin economic vulnerability, this paper combines with the actual situation of Tianjin’s social economy, finance and energy devel-opment, and with reference to the vulnerability index selection method from Yang Aiting and Wujian [9], to establish the vulnerability evaluation index sys-tem of Tianjin urban economic syssys-tem, the specific contents are as shown in Ta-ble 1.
DOI: 10.4236/jssm.2019.122007 118 Journal of Service Science and Management
Table 1. The vulnerability evaluation index system of Tianjin urban economic system.
Norm Index Meaning and nature of index
Sensitivity (+)
S1Unemployment registration
rate in cities and towns Reflecting the impact of unemployment on urban economy (+)
S2 first industry/GDP (%) indicating that the economy is vulnerable to The proportion of agriculture is too large, natural climate factors (+) S3Per capita disposable income
growth rate/per capita GDP growth rate
Reflecting the growth of economic growth on income growth, the lower the residents, the less share the benefits of economic
growth (−)
S4consumption rate (%) Reflecting the state of consumption, consumption and investment (−)
S5 Financial deficits/GDP (%) Reflecting the government’s financial risks and operational capacity (+) S6 Degree of dependence
on foreign trade (%) Reflecting the imbalance between domestic demand and external demand (+) S7 bank credit/GDP (%) Reflecting the risks of credit to economic fluctuations (+)
S8 Energy consumption per unit GDP (ton standard coal/10,000
yuan)
Reflecting the energy saving and consumption reduction in energy
consumption (+) S9 Total amount of industrial
wastewater discharge (10,000 tons)
Reflecting the negative impact of industrialization on the environment (+)
Resilience (−)
R1 Per capita GDP (yuan) resilience ability of economic system (+) Reflecting the macroeconomic basis of R2 Proportion of urban
population (%) Reflecting the level of urbanization development (+) R3 Actual utilization of foreign
investment/GDP (%) capital utilization to economic growth (+) Reflecting on the contribution of foreign R4 Per capita investment in
fixed assets (yuan) Reflecting the level of investment per capita (+)
R5 R & D expenditure/GDP (%) technology and the power of economic Reflecting the level of science and development in the future
R6 Proportion of employees in third industry (%)
Reflecting the socialization degree of production and the level of market
economic development (+)
R7 Fiscal expenditure/revenue (%) local government financial expenditure (−) Reflecting the self satisfaction ability of
R8 Loan-to-deposit ratio Reflecting the bank’s ability to cope with liquidity shocks and matching ability of loan and deposit (−) R9 Urban sewage discharge rate Reflecting the city sewage treatment situation (+)
R10 Standard rate of industrial
DOI: 10.4236/jssm.2019.122007 119 Journal of Service Science and Management
is, the greater the economy sensitivity is, the weaker the ability of the economic system to withstand destruction is; if sensitivity index is (−), it means that the smaller index value is, the smaller the economy sensitivity is, the stronger the ability of the economic system to withstand destruction is. As for resilience, if resilience index is (+), it means that the greater index value is, the stronger the economy resilience is, the stronger coping ability of the economy is, and so on.
All the original data in Table 1 come from the Tianjin Statistical Yearbook and Tianjin statistical yearbook on science and technology. In order to ensure the integrity of data, this paper chooses data from 2000 to 2014.
2.2. The Determination of Index Weight
Due to the different influence on economic vulnerability, it is necessary to assign weight to each evaluation index, in order to reflect the true extent of the eco-nomic vulnerability. This paper uses entropy method to determine the weight of each evaluation index in order to make the weight calculation objective. The main calculation steps are as follows [10]:
Step 1: standardization of data
Because the quantities and dimensions of each index are different, it is neces-sary to standardize the data. When the index is greater and more favorable to evaluate the high level target, the positive index calculation method is adopted. The formula is (1).
{ }
{ }
{ }
min max min ip p ip p P X X X X X − ′ =− (1)
When the index is smaller and more favorable to evaluate the high level target, the negative index calculation method is adopted.
{ }
{ }
{ }
max max min p ip ip p P X X X X X − ′ =− (2)
Step 2: calculate the proportion of index value of item p in the i year. The ex-pression is (3):
1 ip ip m ip i X Y X = ′ = ′
∑
(3)Step 3: calculate the information entropy of item p. The expression is (4):
(
)
1(
) (
)
1
ln m ln , 0 1
p i ip ip p
e = − m −
∑
= Y × Y ≤e ≤ (4)Step 4: calculate the weight of item p. The expression is (4):
(
)
(
)
1 1 1 p p n p p e w e = − = −∑
(5)In the formula, Xip denotes the evaluation index value of item p in the i year;
max {Xp} and min {Xp} are the maximum and minimum values of the evaluation
DOI: 10.4236/jssm.2019.122007 120 Journal of Service Science and Management
index.
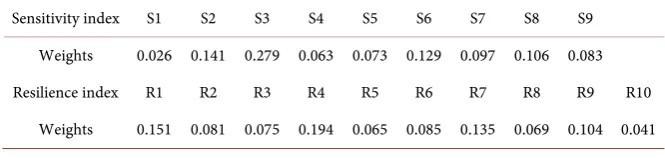
According to the above entropy method, the economy sensitivity and resi-lience index are brought into the formula to calculate. The weight value of Tian-jin economic vulnerability evaluation index is obtained in Table 2.
3. Construction of Theoretical Model
Economic system is a complex system with multi variable interaction, and the economic development has typical uncertainty characteristics, so this paper in-troduce set pair analysis method (SPA) to analyze economic vulnerability evalu-ation, in order to estimate the development trend of Tianjin economic vulnera-bility in 2000-2014. The core idea of SPA is to analyze the certain and uncertain factors in set pairs, connecting set E and set U as a set H, Under specific cir-cumstance Q, according to a set of characteristics, separating the certainty into the “same” and “opposites”, calling the uncertainty as “difference”, in order to establish a connection formula to analyze the object and system from same, op-posite and different aspects. Therefore, the set pair analysis is mainly to analyze the characteristics of the set H, so as to get the property N, among which has S is set E and set U in common, P is opposite, F N S PS= − − is uncertain. The connection degree of two sets μ is [11]:
S Fi P j a bi cj
N N N
µ= + + = + + (6)
In the formula (6), a, b, c respectively refer to same degree, difference degree and opposite degree of set E and set U under circumstance Q. i and j are the marks and coefficients of difference degree and opposite degree. The value of J is −1, and the value range of i is [−1,1]. a, b, c characterize the connection of two sets from different aspects. By comparing them, the connection degree of the set can be preliminarily analyzed.
According to the specific analysis, the corresponding evaluation index in Tianjin economic system are determined as set E, the evaluation criteria are de-termined as set U, U and E are combined as set H {E, U}, set U and set E exist a certain and uncertain relationship among “same”, “different” or “opposite”. Therefore, the vulnerability evaluation of Tianjin urban economic system can be seen as the process of comparative analysis between set U and set E.
Specifically, the vulnerability of Tianjin urban economic system is
{
, , ,}
Q= E G W D , and the evaluation scheme E=
{
e e1, , ,2 Em}
, each [image:5.595.205.538.651.730.2]evalua-tion scheme has n index G=
{
g g1, , ,2 gn}
, the index weight ={
ω ω1, , ,2ωn}
,Table 2. Weight value of each evaluation index.
Sensitivity index S1 S2 S3 S4 S5 S6 S7 S8 S9 Weights 0.026 0.141 0.279 0.063 0.073 0.129 0.097 0.106 0.083 Resilience index R1 R2 R3 R4 R5 R6 R7 R8 R9 R10
DOI: 10.4236/jssm.2019.122007 121 Journal of Service Science and Management
the evaluation index value is marked as dkp (k=1,2, , m; p=1,2, , n), the
evaluation matrix of Q is:
11 12 1
21 22 2
1 2
n n
m m mn
d d d
d d d
D
d d d
= (7)
We compare the worst evaluation index and the best evaluation index in each scheme in the same space, in order to form the optimal scheme set
{
1, , ,2 n}
U = u u u and worst scheme set V =
{
v v1, , ,2 vn}
, according to set{vp, up}, the same degree and opposite degree ckpof dkpin evaluation matrix D are
as follows:
When dkphas a positive effect on the evaluation results:
(
)
kp kp p p p p kpkp p p
d a
u v
u v c
d u v
= + = + (8)
When dkp has a negative effect on the evaluation results:
(
p p)
kpkp p p
kp kp
p p
u v a
d u v
d c u v = + = + (9)
The connection degree μ of set pair {Ek, U} in [U, V] is:
(E U, ) k k k
k p kp
k p kp
a b i c j
a w a
c w c
µ = + +
= =
∑
∑
(10)The closeness degree rk of scheme Ek and the optimal scheme is:
k k k k a r a c =
+ (11)
rk index reflects the association between the scheme Ek and the optimal
scheme set, and the larger rk is, the closer the evaluated object is to the
evalua-tion criteria. The vulnerability degree of Tianjin urban economic system can be analyzed according to rk. The greater the index is, the more fragile Tianjin urban
economic system is, contrarily, the more robust Tianjin urban economic system is.
4. Evaluation of Tianjin Economic Vulnerability
DOI: 10.4236/jssm.2019.122007 122 Journal of Service Science and Management
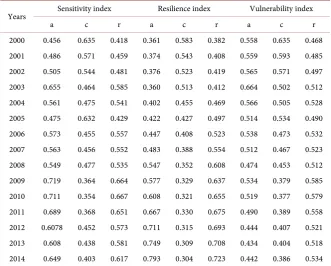
Table 3. The vulnerability, sensitivity and resilience of Tianjin urban economic system.
Years Sensitivity index Resilience index Vulnerability index
a c r a c r a c r
2000 0.456 0.635 0.418 0.361 0.583 0.382 0.558 0.635 0.468 2001 0.486 0.571 0.459 0.374 0.543 0.408 0.559 0.593 0.485 2002 0.505 0.544 0.481 0.376 0.523 0.419 0.565 0.571 0.497 2003 0.655 0.464 0.585 0.360 0.513 0.412 0.664 0.502 0.512 2004 0.561 0.475 0.541 0.402 0.455 0.469 0.566 0.505 0.528 2005 0.475 0.632 0.429 0.422 0.427 0.497 0.514 0.534 0.490 2006 0.573 0.455 0.557 0.447 0.408 0.523 0.538 0.473 0.532 2007 0.563 0.456 0.552 0.483 0.388 0.554 0.512 0.467 0.523 2008 0.549 0.477 0.535 0.547 0.352 0.608 0.474 0.453 0.512 2009 0.719 0.364 0.664 0.577 0.329 0.637 0.534 0.379 0.585 2010 0.711 0.354 0.667 0.608 0.321 0.655 0.519 0.377 0.579 2011 0.689 0.368 0.651 0.667 0.330 0.675 0.490 0.389 0.558 2012 0.6078 0.452 0.573 0.711 0.315 0.693 0.444 0.407 0.521 2013 0.608 0.438 0.581 0.749 0.309 0.708 0.434 0.404 0.518 2014 0.649 0.403 0.617 0.793 0.304 0.723 0.442 0.386 0.534
According to Table 3, we further draw the trend lines of vulnerability, sensi-tivity and resilience of Tianjin urban economic system from 2000 to 2014 in
Figure 1.
Seen from the above Table 3 and Figure 1, the value of vulnerability of Tian-jin economic system is fluctuant and slightly rising, which indicates that the ro-bustness of vulnerability of Tianjin economic system is fluctuant, but in general, it is still in the right direction. As for sensitivity, the value increased from 0.418 in 2000 to 0.585 in 2003, and then fluctuated, by 2010 the vulnerability index reached a maximum value of 0.667, indicating that there are many unstable fac-tors disturbing Tianjin economic development. Fortunately, the resilience index showed a rising trend, dealing with the value increased from 0.382 in 2000 to 0.723 in 2014, which means that with the Tianjin economic development, the ability of the economic system to adjust its internal structure and respond to ex-ternal shocks continues to improve. As for the trend of vulnerability of econom-ic system, Tianjin urban economeconom-ic system shows a sustained fluctuant rising trend, and there is a continuous small peak to 2009-2010, which reflects the vul-nerability of Tianjin economic system during this period. The following is in-depth analysis from three aspects of sensitivity, resilience and vulnerability of Tianjin economic system.
DOI: 10.4236/jssm.2019.122007 123 Journal of Service Science and Management
Figure 1. The trend lines of vulnerability, sensitivity and resilience of Tianjin ur-ban economic system.
manufacturing industry, the service of tourism, transportation, catering and other industries was affected, which causes that the consumption in Tianjin greatly reduced; in addition, SARS also caused some impact on Tianjin import and export trade. 2008 is a more special period that the international financial crisis broke out, leading to rapid decline of export trade in Tianjin, the import and export of foreign trade turned into deficit, and the main export market de-mand also decreased significantly, the exports of state-owned and private enter-prises are deeply affected; after the outbreak of the financial crisis, Tianjin for-eign direct investment profits decreased rapidly, profit transfer increased, which has a wide influence on real economy, industrial development and technological progress in Tianjin. The outbreak and spread of the financial crisis had heavy in-fluence of industry in Tianjin, especially ferrous metal smelting and rolling processing industry, electricity, heat production and supply industry, petroleum processing, coking and nuclear fuel processing, plastic products industry, phar-maceutical manufacturing industry, the port service industry, etc. All these caused the economic sensitivity index to show a growth trend, financial crisis ef-fect makes the economic sensitivity index high for a period of time, the econom-ic sensitivity index increased from 0.535 in 2008 to 0.637 in 2010, then decreased slightly from 2011 (0.651).
funda-DOI: 10.4236/jssm.2019.122007 124 Journal of Service Science and Management
mental reason for the constant growth of Tianjin economic resilience. In addi-tion, from the perspective of the internal structure of the economy, the industrial structure of Tianjin economic development continues to be optimized, the pro-portion of the third industry to GDP is rising, and for the first time in 2015, it surpassed the second industry, accounting for 50%; The investment structure has been continuously optimized, the financial industry has been developing steadily, the ability of independent innovation has been enhanced, the environ-mental protection has been strengthened, and the ecological environment has been further improved. All these factors make Tianjin urban economic resilience ability to increase; the economic resilience index value continues to rise.
As far as the vulnerability of Tianjin economic system, the vulnerability index showed a modest rise before 2008, and a significant increase from 2008 to 2011. The vulnerability index before 2008 was rising. It is related to the internal struc-ture of the economic system, although the overall level of Tianjin economic de-velopment is constantly improving, there are many problems in Tianjin eco-nomic development, for example, the unreasonable industrial structure, Al-though the proportion of the third industry development in GDP is increasing, it is still lagging behind; As for the internal industrial structure, manufacturing industry structure is not balanced, the proportion of heavy industry is too large; The level of industrial chain is not reasonable, and it is in the low level of vertical division of labor system. These factors have become constraining factors for the steady of the economy development, leading to a slight rise of vulnerability in-dex before 2008. The economic vulnerability increased significantly from 2008 to 2011, the author thinks that the fundamental reason for the large fluctuation of economic vulnerability in Tianjin during this period is not the direct result of the uncoordinated and unstable internal system structure, but the external dis-turbance. That’s the global financial crisis as the economic sensitivity analysis above.
Through the comparison among sensitivity, resilience and vulnerability of Tianjin economic system during 2000-2014, we can find that Tianjin economic system reflected relatively strong sensitivity in the presence of external distur-bance, sensitivity index curve fluctuates greatly, however, due to the internal structure of Tianjin economic system is relatively coordinated, which cause the economy relatively stable, the economic resilience is not enhanced to rising trend, because of this, Although the sensitivity fluctuation range is obvious, the response plays a key role in solving the economic contradictions and reducing the economic vulnerability. It should be said that in the construction of market economy, Tianjin economic resilience is constantly increasing, which makes the economic system has a strong ability to restore itself.
Acknowledgements
DOI: 10.4236/jssm.2019.122007 125 Journal of Service Science and Management
Conflicts of Interest
The author declares no conflicts of interest regarding the publication of this pa-per.
References
[1] Timmerman, P. (1981) Vulnerability, Resilience and the Collapse of Society: A Re-view of Models and Possible Climatic Applications. Institute for Environmental Studies, University of Toronto, Toronto, Canada.
[2] Briguglio, L. (1992) Preliminary Study on the Construction of an Index for Ranking Countries According to Their Economic Vulnerability. UNCTAD/LDC/Misc. 4. [3] Guillaumont, P. (1999) On the Economic Vulnerability of Low-Income Countries.
Report Prepared for the United Nations.
[4] Yang, Y. and Pan, H. (2015) Economic Vulnerability of Tourism Economy Depen-dent Economy and Its Evaluation Research. Inquiry into Economic Issues, 8, 161-169.
[5] Su, F., Zhang, P.Y. and Li, H. (2008) Evaluation on the Vulnerability of China’s Coal Mining Cities. Geographical Research, 27, 907-916.
[6] Yang, Y.R., Wang, S.J. and Chen, X.H. (2015) Dynamic Evolution and Control Ap-proaches of Petroleum City’s Economic System Vulnerability: A Case Study of Daqing City. Geographical Research, 34, 456-463.
[7] Feng, Z.H., Liu, Y.X. and Yang, Y.L. (2010) The Cumulative Vulnerability Assess-ment of the DevelopAssess-ment of Beijing-Tianjin-Hebei Economic Circle. Modern Finance and Economics-Journal, 10, 63-68.
[8] Wu, Z.J. (2003) Financial Vulnerability: Theory and Empirical Analysis Based on China (1991-2000). Economic Review, No. 2, 96-128.
[9] Yang, A.T. and Wu, J. (2012) China’s Economic System Vulnerability and Sustaina-ble Development Involve: 15 Years of Sample. Reform, 216, 25-33.
[10] Chen, M.X., Lu, D.D. and Zhang, H. (2009) The Comprehensive Measure of China’s Urbanization Level and Its Dynamic Factor Analysis. Acta Geographica Sinica, 4, 387-398.