ORIGINAL RESEARCH
ADULT BRAIN
Spatial Correlation of Pathology and Perfusion Changes within
the Cortex and White Matter in Multiple Sclerosis
XA.D. Mulholland,XR. Vitorino,XS.-P. Hojjat,XA.Y. Ma,XL. Zhang,XL. Lee,X T.J. Carroll,XC.G. Cantrell,XC.R. Figley, and XR.I. Aviv
ABSTRACT
BACKGROUND AND PURPOSE: The spatial correlation between WM and cortical GM disease in multiple sclerosis is controversial and has not been previously assessed with perfusion MR imaging. We sought to determine the nature of association between lobar WM, cortical GM, volume and perfusion.
MATERIALS AND METHODS: Nineteen individuals with secondary-progressive multiple sclerosis, 19 with relapsing-remitting multiple sclerosis, and 19 age-matched healthy controls were recruited. Quantitative MR perfusion imaging was used to derive CBF, CBV, and MTT within cortical GM, WM, and T2-hyperintense lesions. A 2-step multivariate linear regression (corrected for age, disease duration, and Expanded Disability Status Scale) was used to assess correlations between perfusion and volume measures in global and lobar normal-appearing WM, cortical GM, and T2-hyperintense lesions. The Bonferroni adjustment was applied as appropriate.
RESULTS:Global cortical GM and WM volume was significantly reduced for each group comparison, except cortical GM volume of those with relapsing-remitting multiple sclerosis versus controls. Global and lobar cortical GM CBF and CBV were reduced in secondary-progressive multiple sclerosis compared with other groups but not for relapsing-remitting multiple sclerosis versus controls. Global and lobar WM CBF and CBV were not significantly different across groups. The distribution of lobar cortical GM and WM volume reduction was disparate, except for the occipital lobes in patients with secondary-progressive multiple sclerosis versus those with relapsing-remitting multiple sclerosis. Moderate associations were identified between lobar cortical GM and lobar normal-appearing WM volume in controls and in the left temporal lobe in relapsing-remitting multiple sclerosis. No significant associations occurred between cortical GM and WM perfusion or volume. Strong correlations were observed between cortical-GM perfusion, normal appearing WM and lesional perfusion, with respect to each global and lobar region within HC, and RRMS and SPMS patients (R2ⱕ0.96,P⬍.006 andR2ⱕ0.738,P⬍.006). CONCLUSIONS: The weak correlation between lobar WM and cortical GM volume loss and perfusion reduction suggests the indepen-dent pathophysiology of WM and cortical GM disease.
ABBREVIATIONS:cGM⫽cortical GM; EDSS⫽Expanded Disability Status Scale; HC⫽healthy control; NAWM⫽normal-appearing white matter; RRMS⫽ relapsing-remitting multiple sclerosis; SPMS⫽secondary-progressive multiple sclerosis; T2h-1⫽T2-hyperintense lesions
M
S is a notable cause of neurologic and cognitive disability in young people. Pathologically, it is characterized byinflam-matory demyelination and, in chronic lesions, axonal loss.1The cause of reduced cortical metabolism described in MS remains uncertain.2,3While MS is typically regarded as a disease primarily affecting WM, cortical GM (cGM) is increasingly complicit in physical and cognitive disease progression. However, the relation-ships between WM and cGM disease progression remain contro-versial. Although some studies have suggested a relationship be-tween normal-appearing WM (NAWM) atrophy and cGM damage,4,5others suggested that cGM disease progression is ei-ther independent from or only partly related to WM abnormali-Received November 15, 2016; accepted after revision August 4, 2017.
From the Department of Physical Sciences (A.D.M., R.V., S.-P.H., A.Y.M., L.Z.), Sun-nybrook Research Institute, Toronto, Ontario, Canada; Departments of Medical Imaging (L.Z., R.I.A.) and Neurology (L.L.), Sunnybrook Health Sciences Centre, To-ronto, Ontario, Canada; Department of Biomedical Engineering and Radiology (T.J.C.), University of Chicago, Chicago, Illinois; Department of Biomedical Engineer-ing (C.G.C.), Northwestern University, Chicago, Illinois; Department of Radiology and Biomedical Engineering (C.R.F.), University of Manitoba, Winnipeg, Manitoba, Canada; and Department of Medical Imaging (R.I.A.), University of Toronto, To-ronto, Ontario, Canada.
This work was supported by the Canadian Institutes of Health Research operating grant No. 130366; National Institutes of Health, EB017928; American Heart Associa-tion grants 20380798 and 14PRE20380810; and a Biogen fellowship funding award.
Please address correspondence to Richard I. Aviv, MD, Sunnybrook Health Sci-ences Centre, 2075 Bayview Ave, Room AG-31, Toronto, ON, M4N 3M5 Canada; e-mail: [email protected]
Indicates open access to non-subscribers at www.ajnr.org
Indicates article with supplemental on-line table.
Indicates article with supplemental on-line photos.
ties.6,7Louapre et al,8using DTI at 7T, found a lack of spatial specificity between NAWM tracts and the overlying cGM. Steen-wijk et al9reported a stronger relationship between cGM atrophy and WM tract pathology in patients with relapsing-remitting multiple sclerosis (RRMS) compared with those with secondary-progressive multiple sclerosis (SPMS), concluding that the asso-ciation between NAWM and cGM becomes increasingly indepen-dent with disease progression. The assertion that cGM and WM progression is either dependent or partly independent is sup-ported by histopathologic and radiologic series demonstrating the role of meningeal mediated processes in both cortical and leuco-cortical lesions but not WM T2-hyperintense lesion (T2h-l) development.10,11
Although few studies4,5,9have examined the regional relation-ship between cortical structure and WM disease, the association between regional WM volume and perfusion and cortical volume and perfusion has not been previously studied. CBF and CBV reduction have been previously shown either in the absence of, or adjusting for, intergroup structural differences, suggesting that cortical perfusion could serve as a surrogate of disease severity and tissue integrity under specific conditions.12-14Aviv et al12 demon-strated focal cGM CBV reduction in cognitively impaired com-pared with preserved patients with SPMS after adjusting for global WM T2h-l volumes. Hojjat et al15demonstrated significant CBF reduction in the absence of structural differences in impaired compared with cognitively preserved patients with RRMS. Last, Debernard et al14found CBF reduction in the absence of cGM volume differences in unimpaired patients with RRMS compared with healthy controls (HCs) using pseudocontinuous arterial spin-labeled/labeling perfusion. While prior studies reported re-gional variation in CBF and CBV, none examined the rere-gional associations between lobar WM (normal-appearing and lesional) and cGM volume and perfusion reduction. Consistent with grow-ing evidence for partly independent mechanisms of disease pro-gression in WM and cGM, we hypothesized that an independent association would be found between lobar WM disease and cGM volume and perfusion.
MATERIALS AND METHODS
Study Participants
Thirty-eight patients with MS (19 with SPMS and 19 with RRMS) from 2 tertiary referral MS clinics and 19 healthy, age-matched controls were prospectively recruited during a 1-year period. Ex-clusion criteria were a history of drug/alcohol abuse, relapse or steroid use in⬍6 months, pre-MS psychiatric history, head inju-ries involving loss of consciousness, cardiac disease, and MR im-aging contraindications. Demographic data were obtained for each subject. This study was approved by both local ethics com-mittees (Sunnybrook Health Sciences Centre and St. Michael’s Hospital, Toronto), and written consent was obtained from each participant before study enrollment.
Cognitive Testing
All patients and HCs underwent MR imaging, neurologic exami-nation, and Expanded Disability Status Scale (EDSS) assessment within 1 week. Patients were tested with the Minimal Assessment of Cognitive Function in Multiple Sclerosis battery comprising 7
tests covering 5 cognitive domains, including processing speed, memory, executive function, visuospatial perception, and verbal fluency. Only cognitively preserved patients were enrolled in the study, given the greater potential for confounding pathophys-iologic factors, with greater disease progression characterized by cognitive impairment and the previously published associ-ation between cognitive impairment, disease progression, and hypoperfusion.9,15,16
Image Acquisition
All MR imaging data were acquired on a 3T MR imaging system (Achieva; Philips Healthcare, Best, the Netherlands) with an 8-chan-nel phased array coil. The MR imaging sequences included: axial proton density/T2 (TR/TE/flip angle⫽2500/10.7ms/90°; FOV⫽ 230⫻230 mm2; acquisition matrix⫽256⫻263; section
thick-ness⫽3 mm); axial T1-weighted TSE (TR/TE/flip angle⫽9.5/ 2.3ms/12°; FOV⫽240⫻240 mm2; acquisition matrix⫽256⫻
219; section thickness⫽1.2 mm); axial phase-sensitive inversion recovery (TR/TE⫽3374/15 ms; FOV⫽230⫻230 mm2;
acqui-sition matrix⫽400⫻ 255; section thickness⫽3 mm); axial field-echo, echo-planar dynamic susceptibility contrast perfusion (TR/TE/flip angle⫽1633/30ms/60°; FOV⫽220⫻220 mm2;
acquisition matrix⫽96⫻93; section thickness⫽4 mm; no gap; signal bandwidth⫽1260 Hz/pixel; sections⫽24). During the perfusion scan, 10 mL of 1-mmol/mL concentrated gadobutrol (Gadovist; Bayer Schering Pharma, Berlin, Germany) was admin-istered by a power injector at a rate of 5 mL/s, followed by a 25-mL bolus of saline at 5 mL/s. Sixty images were acquired with the injection occurring at the fifth volume. A segmented inversion recovery Look-Locker EPI sequence was performed immediately before and after the axial DSC sequence (TR/TE/flip angle⫽29/ 14ms/20°; TI⫽15.8 ms; FOV⫽220⫻220 mm2; acquisition
matrix⫽128 ⫻126; 15k-space lines per acquisition; section thickness⫽4 mm; time points⫽60). A 3-second delay occurred following the last imaging time point to facilitate longitudinal magnetization recovery.
Quantitative MR Perfusion
Quantitative CBF (milliliter/100 gram/minute), quantitative CBV (milliliter/100 gram), and MTT (second) were obtained using bookend MR imaging perfusion as previously published.17The technique uses pre- and postgadolinium bookend scans to calcu-late WM quantitative CBV without the need for an arterial input function while accounting for the effects of intravascular-to-extravascular water exchange. The tissue concentration–time curve is calculated through arterial input function sampling, al-lowing relative CBV and relative CBF determination. The central volume principle was used to calculate MTT.
Image Processing
segmen-tation model in SPM8 and checked for accuracy before creating sub-ject-specific NAWM masks by subtracting T2h-1 from the auto-mated WM segmentation. For cortical volumetric analysis, the International Consortium for Brain Mapping lobar templates (Lab-oratory of Neuroimaging, Keck School of Medicine, Los Angeles, California) and MRIcro Brodmann templates (Neuropsychology Laboratory, Columbia, South Carolina) were registered to Montreal Neurological Institute 152 space using the normalize function in SPM. Structural T1-weighted images and associated lesional ROIs and lobar templates were coregistered to the EPI DSC pregadolinium images with linear registration (FMRIB Linear Image Registration Tool, FLIRT; https://fsl.fmrib.ox.ac.uk/fsl/fslwiki/FLIRT) and non-linear intensity modulation and multiresolution, nonnon-linear registra-tion with 4 subsampling levels (FMRIB Nonlinear Registraregistra-tion Tool, FNIRT; http://fsl.fmrib.ox.ac.uk/fsl/fslwiki/FNIRT). Global and lobar cGM and WM volumetric and perfusion metrics were then quantified separately for bilateral frontal, parietal, temporal, and occipital lobes, as previously described.18
Statistical Analysis
Demographic, clinical, volumetric, and perfusion data were sum-marized for HCs and patients with RRMS, and SPMS using the mean and SD for continuous variables and proportions for cate-goric variables. To compare RRMS versus HC, SPMS versus HC, and SPMS versus RRMS for demographic variables (ie, age, sex, educational years, disease duration, and EDSS), we used the uni-variate logistic regression model. Significant confounding factors were determined and used for perfusion data analysis. A Bonfer-roni-correctedPvalue⬍.017 (.05/3) was considered statistically significant for controlling for multiple comparisons among the 3 groups. To compare HC, RRMS, and SPMS cohort differences for the imaging parameter covariates (ie, CBF, CBV, MTT, lobar GM, and WM volume), we used a generalized linear model with a logit link function after adjusting for confounding factors. The GENMOD procedure in Statistical Analysis Software (SAS, Ver-sion 9.4 for Windows; SAS Institute, Cary, North Carolina) was performed to fit the model, with a Bonferroni-adjustedPvalue⬍ .017 considered statistically significant. Confounding factors of age, disease duration, and EDSS were assessed for multicollinear-ity by examining tolerance and variance inflation factors (1/toler-ance) in a regression model using SPSS (IBM, Armonk, New York). A tolerance value of⬍0.1 and a variance inflation factor of ⬎10 were regarded as indicating multicollinearity. Normality was determined with the Shapiro-Wilk test, and anomalous depen-dent variables were log-transformed to fit the data to a normal distribution. Natural log-transformation was applied as appro-priate for normalizing the distributions. A general linear
regres-sion was implemented to assess the association between GM and WM regional perfusion data, between GM and T2h-l regional perfusion data, between WM and T2h-l regional perfusion data, and between lobar GM and lobar WM volume data while consid-ering confounding factors and expressed asR2.
RESULTS
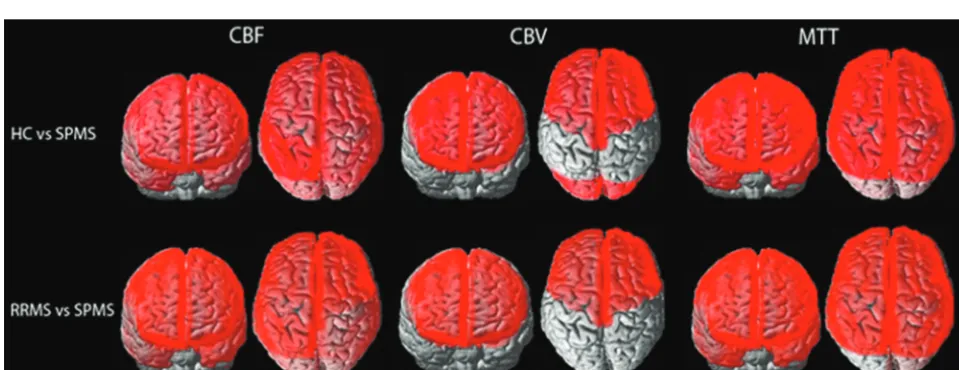
Clinical Characteristics, Global Volumes, and Perfusion The MS subgroups did not significantly differ in sex, disease du-ration, and years of education, though the SPMS cohort was older (P⫽.0041) and had higher EDSS (P⫽.0006) scores than the RRMS cohort (Table 1). Patients with SPMS demonstrated a lon-ger disease duration, but this did not reach statistical significance (P⫽.02). The SPMS cohort had greater global atrophy in cGM and WM compared with the RRMS group and HC subjects (P⫽
.002,P⫽.0026 andP⫽.0049, andP⫽.0011, respectively;Table 2). Those with RRMS exhibited lower global WM (P⫽.0115) but not GM volume compared with HCs. GM and WM CBF and CBV were reduced and MTT was prolonged in subjects with SPMS compared with those with RRMS. GM CBF reduction and MTT prolongation were present in RRMS and SPMS compared with HCs. No significant WM CBF or CBV difference was observed for any RRMS/SPMS comparison with HCs. WM MTT was signifi-cantly prolonged for those with SPMS versus HCs. No significant T2h-l volume, CBF, or MTT differences were seen between pa-tients with RRMS and those with SPMS, though papa-tients with SPMS had higher T2h-l CBV than those with RRMS.
Lobar Volumetric Group Comparisons
Patients with SPMS had reduced cGM volumes in the temporal and occipital lobes and reduced WM volumes in the occipital lobe compared with those with RRMS (Table 3). Patients with SPMS also demonstrated reduced occipital lobe WM and temporal and occipital cGM compared with HCs. Frontal and parietal lobe WM volume reduction was observed for all comparisons, and patients with RRMS also demonstrated a reduced temporal WM volume compared with HCs. Overall, a weak association was present be-tween lobar cGM and lobar NAWM volume (On-line Table and On-line Fig 1) in patients with both RRMS (R20.14 – 0.65) and
SPMS (R2⫽0.16 – 0.62), with no statistical significance achieved
for any lobar region. Association was stronger in HCs (R2 ⫽
0.53– 0.79).
Lobar Perfusion Group Comparisons
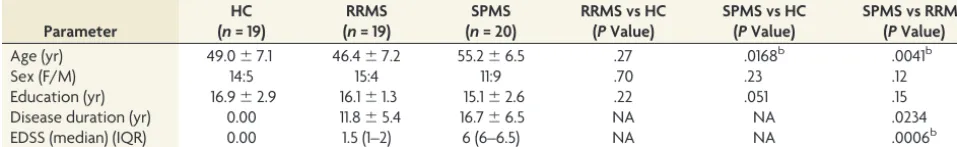
[image:3.594.53.532.58.131.2]The distribution of significant lobar cortical perfusion differences between group comparisons is demonstrated in theFigure. Lobar cGM CBF reduction and MTT increase were present in all lobes in
Table 1: Comparison of demographic and clinical data for HCs and subjects with RRMS and SPMSa
Parameter
HC (n= 19)
RRMS (n= 19)
SPMS (n= 20)
RRMS vs HC (PValue)
SPMS vs HC (PValue)
SPMS vs RRMS (PValue)
Age (yr) 49.0⫾7.1 46.4⫾7.2 55.2⫾6.5 .27 .0168b .0041b
Sex (F/M) 14:5 15:4 11:9 .70 .23 .12
Education (yr) 16.9⫾2.9 16.1⫾1.3 15.1⫾2.6 .22 .051 .15
Disease duration (yr) 0.00 11.8⫾5.4 16.7⫾6.5 NA NA .0234
EDSS (median) (IQR) 0.00 1.5 (1–2) 6 (6–6.5) NA NA .0006b
Note:—IQR indicates interquartile range; NA, not applicable.
a
All values are mean (SD) except where indicated. Bonferroni correctedP⬍.017 is considered statistically significant.
b
FIGURE. Whole-brain depiction of perfusion differences in cortical gray matter among HCs and patients with RRMS and SPMS. Units for CBF are milliliter/100 gram/minute; CBV, milliliter/100 gram; MTT, second.
Table 2: Comparison of perfusion and volumetric data for cGM, NAWM, and T2h-l between HCs and subjects with RRMS and SPMS after adjusting for confounding factorsa
Parameter
Median (Interquartiles) PValue
HC (n= 19) RRMS (n= 19) SPMS (n= 20) RRMS vs HC SPMS vs HC SPMS vs RRMS cGM
Global volume 890 (869–914) 864 (827–895) 673 (646–697) .10 .0026b .0020b
CBF 43.20 (33.91–54.49) 41.07 (29.85–55.68) 34.05 (27.19–43.68) ⬍.0001b ⬍.0001b .0011b
CBV 2.64 (2.02–3.29) 2.53 (1.94–3.37) 2.40 (1.92–3.07) .078 .046 .0062b
MTT 3.77 (3.20–4.31) 3.90 (3.32–4.41) 4.30 (3.66–4.99) .0001b ⬍.0001b ⬍.0001b NAWM
Global volume 878 (812–894) 818 (738–850) 697 (669–729) .0115b .0011b .0049b
CBF 23.49 (18.69–27.78) 21.55 (16.05–29.50) 19.54 (16.74–24.92) .68 .58 .0080b
CBV 1.59 (1.28–2.00) 1.57 (1.17–2.15) 1.51 (1.30–1.98) .89 .16 .0103b
MTT 4.51 (4.09–5.10) 4.62 (4.08–5.20) 4.86 (4.28–5.41) .25 .0005b .0094b
T2h-l
Global volume 0.00 5.4 (1.2–9.3) 6.4 (1.0–10.9) NA NA .82
CBF 0.00 12.77 (8.23–17.24) 11.15 (8.95–15.71) NA NA .049
CBV 0.00 0.99 (0–1.32) 1.08 (0.83–1.47) NA NA .0026b
MTT 0.00 4.91 (4.00–5.63) 5.64 (4.82–6.30) NA NA .43
Note:—NA, not applicable.
a
Bonferroni-correctedP⬍.017 is considered statistically significant. Age was considered a confounding factor for comparing RRMS vs HC and SPMS vs HC; age, EDSS, and disease duration were considered confounding factors for comparing SPMS vs RRMS. All volumes are in cubic centimeters; CBF, milliliter/100 gram/meter; CBV, milliliter/100 gram; MTT, second.
bSignificant.
Table 3: Lobar GM and WM volume differences among HCs and subjects with RRMS and SPMS after adjusting for confounding factorsa
Parameter
Median (Interquartiles) PValue
HC (n= 19) RRMS (n= 19) SPMS (n= 19)
RRMS vs HC (n= 19)
SPMS vs HC (n= 19)
SPMS vs RRMS (n= 19) Gray matter
Frontal lobe 200.040 (190.352–167.944) 199.248 (192.480–207.896) 200.352 (193.500–207.540) .69 .60 .22 Parietal lobe 90.296 (83.992–94.512) 89.824 (85.048–95.176) 93.368 (88.956–96.352) .72 .03 .095 Temporal lobe 122.740 (110.640–130.560) 121.336 (114.672–128.544) 106.892 (99.432–112.928) .86 .0044b .0073b Occipital lobe 101.088 (98.536–106.272) 97.160 (95.728–102.960) 72.792 (69.868–75.196) .10 .0030b .0033b White matter
Frontal lobe 190.568 (170.368–201.528) 170.316 (159.520–189.112) 146.260 (134.908–157.136) ⬍.0001b .0006b ⬍.0001b Parietal lobe 101.200 (94.536–109.152) 93.272 (84.944–97.208) 81.952 (77.736–87.532) .0001b .0018b ⬍.0001b Temporal lobe 70.132 (56.648–79.352) 68.512 (64.116–74.016) 61.208 (51.576–71.720) .026 .98 .0026b Occipital lobe 32.024 (30.248–35.092) 29.092 (24.136–33.768) 26.864 (23.552–31.832) .65 .0098b .0003b a
Bonferroni-correctedP⬍.017 is considered statistically significant. Age was considered a confounding factor for comparing RRMS vs HC and SPMS vs HC; age, EDSS, and disease duration were considered confounding factors for comparing SPMS vs RRMS. All volumes are in cubic centimeters.
b
[image:4.594.53.533.519.704.2]patients with SPMS compared with the other groups, except for MTT increase within the left occipital lobe for the SPMS versus RRMS comparison, which did not reach statistical significance. Lobar cGM CBV reduction was present in the bilateral frontal lobes of patients with SPMS compared with the other groups and in the bilateral occipital lobes of SPMS versus HCs. No significant lobar cGM CBF, CBV reduction, or MTT prolongation was found between subjects with RRMS and HCs. No significant lobar per-fusion differences were observed between any group comparison for NAWM. A strong association was shown between cGM and NAWM global and lobar perfusion for all group comparisons and lobes (R2⫽0.77– 0.98,P⬍.0001; On-line Table and On-line Fig
2). Overall, patients with SPMS demonstrated stronger associa-tions between lobar T2h-l and cGM and NAWM perfusion com-pared with those with RRMS (On-line Table and On-line Figs 3 and 4; cGM CBF,R2⫽0.31– 0.77; NAWM CBF,R2⫽0.35– 0.85
versus cGM CBF,R2⫽0.07– 0.61; and NAWM CBF,R2⫽0.06 –
0.69, respectively).
Associations between Perfusion and Volumetric Data No significant associations were found between perfusion and volumetric data in any regression analysis (ie, for cGM, T2h-l, or NAWM).
DISCUSSION
We demonstrated a weak association between lobar volumes of cGM and NAWM in patients with MS despite cGM and NAWM volume reduction with increasing disease severity. Similarly, al-though lobar NAWM and cGM perfusion were highly correlated, the distribution of lobar cGM perfusion reduction was distinct from that of underlying lobar NAWM perfusion, which showed no significant between-group differences. These results do not conflict with the notion that the pathophysiology of WM and cGM disease may occur independently and that the strength of association varies relative to the disease severity. The strong ciation between cGM and NAWM perfusion and the lack of asso-ciation with volumetric measures suggest a potential role for per-fusion as an independent surrogate of disease activity.
Weak associations between NAWM volume and GM volume and perfusion in the present study argue against a mechanism of secondary cGM anterograde or retrograde axonal degeneration and suggest independent pathophysiologic processes acting on WM and GM. This assertion is supported by various pathologic and imaging studies,8,19-21which have shown that cGM lesions may develop before the appearance of WM plaques19and arise in-dependent of and are poorly correlated with T2h-l forma-tion.20,21A number of pathologic and imaging articles have increasingly implicated an independent etiology for cGM le-sion formation attributed to either the direct presence of men-ingeal-derived neurotoxic substances or secondary microglial activation mediated through meningeal/subpial inflammation and manifest as a gradient of demyelination centered on the subpial cortex.21,22
Numerous articles have examined the spatial relationship be-tween lobar T2h-l and cGM integrity using quantitative and func-tional parameters other than perfusion. A recent correlative study of quantitative cortical T2* at 7T- and 3T-derived surface- and
tract-based analyses found a correlation between WM tract DTI and cGM integrity, though this was not spatially specific, reflect-ing a common sensitivity to MS pathologic changes.8Steenwijk et al9used DTI at 3T to investigate the association between re-gional GM atrophy and pathology in anatomically connected WM tracts in patients with RRMS, SPMS, and primary-progres-sive MS, demonstrating a relationship between NAWM tract frac-tional anisotropy and deep GM and cGM. The model of variance associated with cGM thickness was greatest in patients with RRMS but declined in those with SPMS and primary-progressive MS. A strong association between NAWM integrity and cGM thickness was found only in the mildly impaired group when pa-tients were dichotomized by EDSS category 4. The authors con-cluded that NAWM integrity contributes to cGM atrophy only in early MS. Bodini et al4used Tract-Based Spatial Statistics (TBSS; https://fsl.fmrib.ox.ac.uk/fsl/fslwiki/TBSS) to explore the rela-tionship between cGM atrophy and fractional anisotropy in con-nected NAWM tracts in patients with primary-progressive MS and found that only 4/11 regions studied showed a quantitative association between reduced NAWM fractional anisotropy and GM atrophy.
Jehna et al5found spatial interdependence among focal corti-cal volumes, lesion location, and probabilistic fiber pathways, suggesting that WM tracts and cGM volume are regionally depen-dent and injured due to similar disease processes, suggesting that lesional axonal transaction23leads to Wallerian degeneration and retrograde GM atrophy. Their study was performed in “low dis-abled” individuals with significantly lower ages (29.5 years) and disease duration (7.3 years) compared with the present cohort. In contradistinction, we did not demonstrate a stronger association between NAWM/T2h-l and cGM volume or perfusion with ear-lier disease, likely explained by longer disease duration and older age in our RRMS group compared with the cohort of Jehna et al and the different functional techniques used. The near-univer-sally stronger cGM and NAWM perfusion association and dete-riorating perfusion metrics with disease progression also con-firmed in prior studies12,14,16,22,24 suggest that perfusion is sensitive to a common pathophysiologic mechanism reflecting concomitant but not necessarily codependent cGM and WM pa-thology in MS. Findings are supported by a recently reported DTI study,8suggesting that perfusion could serve as a useful surrogate of disease activity in addition to routine structural imaging.
MS. Despite these sample size limitations, we could demonstrate important differences in associations between volumetric and perfusion variables.
CONCLUSIONS
The weak spatial association between WM disease and cGM atro-phy does not conflict with the notion of an independent patho-physiology of WM and cGM disease. Perfusion reduction with disease severity, particularly in cGM, suggests that perfusion is sensitive to the pathophysiologic mechanism of MS disease sever-ity and may be a useful surrogate of cortical disease progression.
Disclosures: Seyed-Parsa Hojjat—RELATED:Grant: Biogen fellowship funding award. Timothy J. Carroll—RELATED:Grant: National Institutes of Health (1R21EB017928 – 01A1). Charles G. Cantrell—RELATED:Grant: American Heart Association (14PRE20380310). Richard I. Aviv—RELATED:Grant: Canadian Institutes of Health Research (130366), Biogen fellowship funding award.
REFERENCES
1. Rashid W, Parkes LM, Ingle GT, et al.Abnormalities of cerebral perfusion in multiple sclerosis.J Neurol Neurosurg Psychiatry2004; 75:1288 –93CrossRef Medline
2. De Keyser J, Steen C, Mostert JP, et al.Hypoperfusion of the cerebral white matter in multiple sclerosis: possible mechanisms and pathophysiological significance.J Cereb Blood Flow Metab2008; 28:1645–51CrossRef Medline
3. Sun X, Tanaka M, Kondo S, et al.Clinical significance of reduced cerebral metabolism in multiple sclerosis: a combined PET and MRI study.Ann Nucl Med1998;12:89 –94CrossRef Medline
4. Bodini B, Khaleeli Z, Cercignani M, et al.Exploring the relationship between white matter and gray matter damage in early primary progressive multiple sclerosis: an in vivo study with TBSS and VBM.Hum Brain Map2009;30:2852– 61CrossRef Medline
5. Jehna M, Langkammer C, Khalil M, et al.An exploratory study on the spatial relationship between regional cortical volume changes and white matter integrity in multiple sclerosis.Brain Connect2013; 3:255– 64CrossRef Medline
6. Calabrese M, Gallo P.Magnetic resonance evidence of cortical onset of multiple sclerosis.Mult Scler2009;15:933– 41CrossRef Medline
7. Fisher E, Lee JC, Nakamura K, et al.Gray matter atrophy in multiple sclerosis: a longitudinal study.Ann Neurol2008;64:255– 65CrossRef Medline
8. Louapre C, Govindarajan ST, Gianni C, et al.Is the relationship be-tween cortical and white matter pathologic changes in multiple sclerosis spatially specific? A multimodal 7-T and 3-T MR imaging study with surface and tract-based analysis.Radiology2016;278: 524 –35CrossRef Medline
9. Steenwijk MD, Daams M, Pouwels PJ, et al.Unraveling the relation-ship between regional gray matter atrophy and pathology in con-nected white matter tracts in long-standing multiple sclerosis.Hum Brain Map2015;36:1796 – 807CrossRef Medline
10. Mainero C, Louapre C, Govindarajan ST, et al.A gradient in cortical pathology in multiple sclerosis by in vivo quantitative 7 T imaging. Brain2015;138:932– 45CrossRef Medline
11. Klaver R, De Vries HE, Schenk GJ, et al.Grey matter damage in multiple sclerosis: a pathology perspective. Prion2013;7:66 –75
CrossRef Medline
12. Aviv RI, Francis PL, Tenenbein R, et al.Decreased frontal lobe gray matter perfusion in cognitively impaired patients with secondary-progressive multiple sclerosis detected by the bookend technique. AJNR Am J Neuroradiol2012;33:1779 – 85CrossRef Medline
13. Peruzzo D, Castellaro M, Calabrese M, et al.Heterogeneity of corti-cal lesions in multiple sclerosis: an MRI perfusion study.J Cereb Blood Flow Metab2013;33:457– 63CrossRef Medline
14. Debernard L, Melzer TR, Van Stockum S, et al.Reduced grey matter perfusion without volume loss in early relapsing-remitting multi-ple sclerosis.J Neurol Neurosurg Psychiatry2014;85:544 –51CrossRef Medline
15. Hojjat SP, Cantrell CG, Vitorino R, et al.Regional reduction in cor-tical blood flow among cognitively impaired adults with relapsing-remitting multiple sclerosis patients.Mult Scler2016;11:1421–28
CrossRef Medline
16. Hojjat SP, Cantrell CG, Carroll TJ, et al.Perfusion reduction in the absence of structural differences in cognitively impaired versus un-impaired RRMS patients. Mult Scler 2016;22:1685–94 CrossRef Medline
17. Vakil P, Lee JJ, Mouannes-Srour JJ, et al.Cerebrovascular occlusive disease: quantitative cerebral blood flow using dynamic suscepti-bility contrast MR imaging correlates with quantitative H2[150] PET.Radiology2013;266:879 – 86CrossRef Medline
18. Shah MK, Shin W, Parikh VS, et al.Quantitative MR perfusion imaging: preliminary results in stroke.J Magn Reson Imaging2010; 32:796 – 802CrossRef Medline
19. Popescu BF, Lucchinetti CF.Meningeal and cortical grey matter pa-thology in multiple sclerosis. BMC Neurol2012;12:1l1CrossRef Medline
20. Bo¨ L, Geurts JJ, van der Valk P, et al.Lack of correlation between cortical demyelination and white matter pathologic changes in multiple sclerosis.Arch Neurol2007;64:76 – 80CrossRef Medline
21. Sethi V, Yousry T, Muhlert N, et al.A longitudinal study of cortical grey matter lesion subtypes in relapse-onset multiple sclerosis. J Neurol Neurosurg Psychiatry2016;87:750 –53CrossRef Medline
22. Francis PL, Jakubovic R, O’Connor P, et al.Robust perfusion deficits in cognitively impaired patients with secondary-pro-gressive multiple sclerosis. AJNR Am J Neuroradiol 2013;34: 62– 67CrossRef Medline
23. Trapp BD, Peterson J, Ransohoff RM, et al.Axonal transection in the lesions of multiple sclerosis.N Engl J Med1998;338:278 – 85CrossRef Medline
24. Francis PL, Chia TL, Jakubovic R, et al.Extensive white matter dys-function in cognitively impaired patients with secondary-progres-sive multiple sclerosis.AJNR Am J Neuroradiol2014;35:1910 –15
CrossRef Medline
25. Pareto D, Sastre-Garriga J, Auger C, et al.Juxtacortical lesions and cortical thinning in multiple sclerosis.AJNR Am J Neuroradiol2015; 36:2270 –76CrossRef Medline