ORIGINAL RESEARCH
Diffusion MR Imaging Features of Skull Base
Osteomyelitis Compared with Skull Base
Malignancy
B. Ozgen K.K. Oguz A. Cila
BACKGROUND AND PURPOSE: SBO is a life-threatening infection that may have radiologic features similar to those of the neoplastic processes. The purpose of this study was to evaluate the DWI findings in SBO to facilitate the differential diagnosis.
MATERIALS AND METHODS: The MR imaging findings of 9 patients with SBO were retrospectively evaluated and compared with MR imaging studies from 9 patients with NPC, 9 with lymphoma, and 9 with metastatic disease of the skull base. ADC measurements were performed from the ADCSTand the ADCNSTin all 4 groups.
RESULTS: The mean ADCSTvalues were 1.26⫾0.19⫻10⫺3mm2/s for SBO, 0.74⫾0.18⫻10⫺3 mm2/s for NPC, 0.59 ⫾0.11 ⫻10⫺3mm2/s for lymphoma, and 0.99⫾ 0.34⫻ 10⫺3mm2/s for metastatic disease, respectively. The mean ADC value of SBO was significantly higher than those of NPC and lymphoma (P⬍.0001). There was no significant difference for the comparison of SBO and metastatic lesions. When an ADC value equal to or higher than 1.08⫻10⫺3mm2/s was used to rule out lymphoma and NPC, the accuracy was 96%.
CONCLUSIONS:Although SBO is a relatively rare condition, its differential diagnosis from neoplastic processes of the skull base is essential to start appropriate treatment promptly. ADC values may help to distinguish patients with SBO from those with malignant lesions.
ABBREVIATIONS:ADC ⫽ apparent diffusion coefficient; ADCNST ⫽ ADC value of the normal-appearing soft tissue; ADCPONS ⫽ADC value of the central pons; ADCST⫽ ADC value of the affected soft tissue; DWI⫽diffusion-weighted imaging; Dx⫽diagnosis; EAC⫽external auditory canal; Lym⫽lymphoma; Met⫽metastatic lesions; NPC⫽nasopharyngeal carcinoma; SBO⫽ skull base osteomyelitis; SCC⫽squamous cell carcinoma; SE⫽spin-echo
S
BO is a severe infection of the skull base that is most fre-quently seen in elderly patients with diabetes but also in other immunosuppressed patients from all age groups.1-3It isassociated with high morbidity and mortality rates despite in-tensive antibiotic therapy. This condition, which often has a subtle course and nonspecific symptoms such as otalgia and otorrhea, is difficult to diagnose clinically. Similarly, the radio-logic findings may be subtle early in the disease and may in-clude signal-intensity changes, enhancement, and an infil-trating pattern indistinguishable from neoplastic processes affecting the skull base such as advanced NPC, lymphoma, and metastatic disease.4-8The purpose of this study was to
investi-gate the DWI findings that would allow prompt and accurate diagnosis of SBO in a series of patients.
Materials and Methods
Patients
A data base search was performed to identify all patients with the clinical and imaging diagnosis of SBO, among patients who had im-aging in our institution between March 2003 and February 2010. Nine patients (7 men and 2 women) with an age range of 41– 81
years (mean, 62 years) were identified. The medical records were also evaluated for pertinent findings. The indications for scanning were as follows: skull base mass (in 3 patients), external otitis (in 4 patients), cerebrovascular accident (in 1 patient), and skull base osteomyelitis in a single patient. In 3 patients, a nasopharynx bi-opsy was made to rule out malignancy (either before imaging or after an outside scan suggesting malignancy). In 6 patients, biopsy was performed from the external ear canal, middle ear, or mastoid cavity during surgical debridement/mastoidectomy performed ei-ther for the identification of the underlying pathogen or for treat-ment purposes. The diagnosis of SBO was confirmed with his-topathologic results in all patients. Laboratory findings also supported the diagnosis of SBO in each case.
A second search, including the same time period, was performed to retrieve cases with the histopathologic diagnosis of stage 4 NPC, skull base lymphoma, and metastatic disease of the skull base. Patients who had their pretreatment MR imaging with diffusion sequences in our institution and the ones who had large tumors centered on the skull base were identified. Among those, the 9 most recent studies were selected, excluding patients younger than 10 years of age and the ones with prior chemotherapy or radiation therapy history. The clin-ical characteristics of the selected patients were as follows: 7 males and 2 females with an age range of 12– 62 years (mean, 44 years) for NPC, 6 males and 3 females with an age range of 14 – 83 years (mean, 33 years) for lymphoma, and 8 men and 1 woman with an age range of 46 –71 years (mean, 44 years) for metastatic disease. The demographic information of the patients in the 4 groups is summarized in Table 1. Approval of the institutional review board was obtained for this ret-rospective study.
Received March 9, 2010; accepted after revision June 6.
From the Department of Radiology, Hacettepe University, Ankara, Turkey.
Please address correspondence to Burce Ozgen, MD, Department of Radiology, Hacettepe University, Faculty of Medicine, Sihhiye, Ankara, 06100 Turkey; e-mail: burce@ hacettepe.edu.tr
DOI 10.3174/ajnr.A2237
HEAD
&
NECK
ORIGINAL
Imaging
The MR imaging was performed on a 1.5T system (Symphony, Sie-mens, Erlangen, Germany; or Achieva, Philips Healthcare, Best, the Netherlands). Imaging protocol included axial and sagittal T1-weighted SE, axial and coronal T2-T1-weighted turbo SE, and axial and coronal postcontrast T1-weighted SE imaging. All studies were per-formed as a nasopharynx MR imaging with 3-mm section thickness and fat suppression on T2-weighted and postgadolinium images. Two patients with SBO had no postcontrast T1-weighted imaging (gadolinium could not be administered due to the end-stage renal failure in one and acute renal failure in the other). All studies also included single-shot echo-planar DWI (applied 3 b-values with a maximum of 1000 s/mm2, TR/TE of 5100/137 ms, matrix of 96 –128,
and 3-mm section thickness).
Image Evaluation
A neuroradiologist (B.O.), who was blinded to the cases and was unaware of the histopathologic diagnosis, randomly reviewed the MR
images, including the anatomic imaging and the DWI (trace and ADC images).
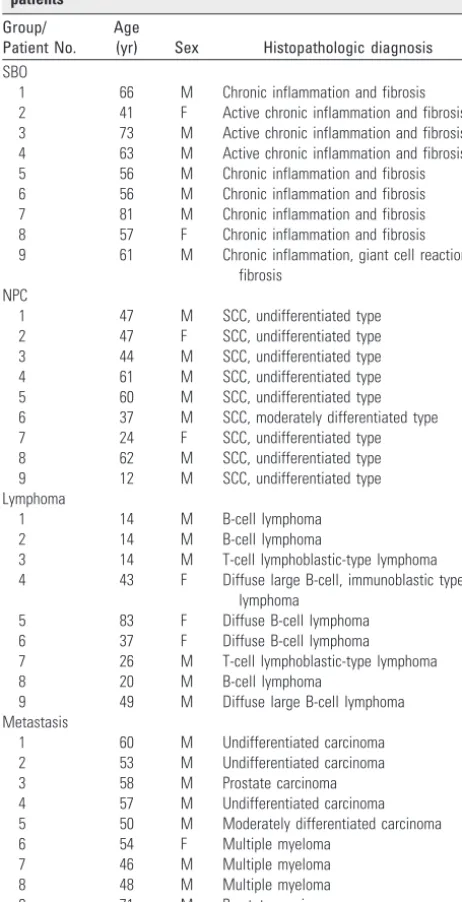
Although this disease is called “osteomyelitis,” the imaging find-ings in this inflammation are usually much more pronounced in the soft tissues than in the skull base bone marrow.8,9Additionally
sus-ceptibility artifacts are much more pronounced within the bone, which can compromise correct ADC measurements. The authors thus decided to obtain ADC measurements from the affected soft tissues beneath the skull base. The ADCSTwas recorded by manual
outlining of a central region of interest of 2 cm2within the soft-tissue
thickening below the skull base (within the posterior parapharyngeal space, anterior to the jugular foramen). The locations of regions of interest were determined with the use of anatomic images. The re-gions of interest mostly included muscle (the exact content was diffi-cult to evaluate). Same-size (2 cm2) uniform regions of interest were
also drawn in the matching normal-appearing soft tissues on the con-tralateral side to obtain an ADCNSTfor the purposes of normalization
and to compare ADC values of normal soft tissues in different sub-groups (Fig 1). In patients with bilateral involvement, ADCNST
mea-surement was performed from the parapharyngeal space more cau-dally. The ADCST/ADCNST ratios were then calculated for each
patient. Because the normal range of ADC values from the brain stem is known from prior studies, an ADC measurement was also obtained from the pons as an internal quality check to assess the validity of our measurements. Calculation of the ADC values was performed by us-ing the software available on workstations provided by the corre-sponding manufacturer (Leonardo workstations, Siemens; and View-Forum workstations, Philips Healthcare).
The observer making the evaluations noted the presence/absence of image distortion from susceptibility artifacts on the DWI trace images and especially on the ADC maps. None of the cases had arti-facts involving the areas where the regions of interest were placed; therefore, the artifacts did not preclude the measurements of the ADC values.
The Wilcoxon signed rank test was used to assess the differences between ADC values of normal and affected soft tissues in patients with SBO. The Kruskal-Wallis test was used for calculating the overall statistical differences among the 4 groups, and the Mann-WhitneyU test was performed for calculating the differences in the mean ADC values and the mean ADC ratios between each pair in the 4 categories.
Results
[image:2.594.53.284.62.513.2]The 9 patients with SBO had several comorbidities, including diabetes mellitus in all patients, ischemic heart disease in 3, hypertension in 5, chronic renal failure in 1, and acute renal failure in 1. All patients had otalgia and otorrhea; 4 patients had accompanying hearing loss. Four patients (44.44%) also had facial palsy at the time of presentation. The median time from symptom onset to the MR imaging was 6.22 months (with a range of 1–12 months). During this period, at least 6 of the patients had documented oral/topical antibiotic use with-out clinical improvement. Technetium Tc99m methylene diphosphonate bone scanning was performed in only 1 patient in whom it revealed uptake in the skull base region. The his-tologic analysis of the biopsy revealed chronic inflammation with granulation tissue and fibrosis (superimposed on an ac-tive inflammatory component in 3 patients) (Table 1). The causative agent could not be identified in any patient (most likely due to treatment with antibiotics before diagnostic work-up for SBO), but the SBO was presumed to be bacterial Table 1: Clinical characteristics and pathologic diagnosis of the
patients
Group/ Patient No.
Age
(yr) Sex Histopathologic diagnosis
SBO
1 66 M Chronic inflammation and fibrosis 2 41 F Active chronic inflammation and fibrosis 3 73 M Active chronic inflammation and fibrosis 4 63 M Active chronic inflammation and fibrosis 5 56 M Chronic inflammation and fibrosis 6 56 M Chronic inflammation and fibrosis 7 81 M Chronic inflammation and fibrosis 8 57 F Chronic inflammation and fibrosis 9 61 M Chronic inflammation, giant cell reaction,
fibrosis NPC
1 47 M SCC, undifferentiated type 2 47 F SCC, undifferentiated type 3 44 M SCC, undifferentiated type 4 61 M SCC, undifferentiated type 5 60 M SCC, undifferentiated type 6 37 M SCC, moderately differentiated type 7 24 F SCC, undifferentiated type 8 62 M SCC, undifferentiated type 9 12 M SCC, undifferentiated type Lymphoma
1 14 M B-cell lymphoma
2 14 M B-cell lymphoma
3 14 M T-cell lymphoblastic-type lymphoma 4 43 F Diffuse large B-cell, immunoblastic type
lymphoma
5 83 F Diffuse B-cell lymphoma
6 37 F Diffuse B-cell lymphoma
7 26 M T-cell lymphoblastic-type lymphoma
8 20 M B-cell lymphoma
9 49 M Diffuse large B-cell lymphoma Metastasis
1 60 M Undifferentiated carcinoma 2 53 M Undifferentiated carcinoma
3 58 M Prostate carcinoma
4 57 M Undifferentiated carcinoma 5 50 M Moderately differentiated carcinoma
6 54 F Multiple myeloma
7 46 M Multiple myeloma
8 48 M Multiple myeloma
in 8 patients and fungal in 1 (according to the patients’ re-sponses to antimicrobial treatment). In 5 patients who had completed their antibiotic course with resolution or improve-ment of their symptoms and clinical findings, normalization
of their laboratory results was accepted as successful treat-ment. Three patients among these had residual cranial neu-ropathies. One patient was lost to follow-up. Three patients died despite extensive treatment due to multiple organ failure and cardiopulmonary arrest.
The histopathologic diagnosis of patients with NPC was SCC with moderate differentiation in 1 and poor differentia-tion in 8. Seven patients with lymphoma had B-cell-type lym-phoma, and 2 had T-cell lymphoblastic-type lymphoma. Among patients within the metastatic group, 3 had undiffer-entiated carcinoma, 1 had moderately differundiffer-entiated carci-noma, 2 had prostate carcicarci-noma, and 3 had multiple my-eloma. Although multiple myeloma is a disease characterized by malignant proliferation of the plasma cells and can be clas-sified as a primary bone marrow malignancy, these patients were included in the metastatic group because the imaging is very similar to that in patients with metastatic disease. The histopathologic results of the patients for the 4 groups are also summarized in Table 1.
The mean ADC values for the 4 types of skull base lesions and their statistical analysis is shown in Table 2. In SBO, the mean ADCSTvalue was 1.26⫾0.19⫻10⫺3mm2/s with the
Fig 1.MR images in a case of SBO (patient 8).A, Axial T1-weighted image demonstrates infiltration with decreased T1 signal intensity of the left jugular foramen (black arrow) extending to the poststyloid parapharyngeal space with loss of the cortical margin of the clivus on the left (white arrow).B, Axial postcontrast and fat-suppressed T1-weighted image reveals extensive enhancement of the affected region (arrows).C, Diffusion TRACE image of the same region shows increased signal intensity (arrows).D, Corresponding ADC map with the regions of interest placed to measure the ADC values from the abnormal soft tissues (on the left) and normal-appearing soft tissues (on the right).
Fig 2.Box-and-whisker plot comparing the mean ADC values of the affected soft tissues in SBO, NPC, lymphoma, and metastatic lesions. The horizontal line is the median (50th percentile) of the measured values; the top and bottom of the box represent the 25th and 75th percentiles, respectively; and whiskers indicate the range from the largest to the smallest observed data points. The plus sign within the whiskers indicates the mean value for each group. Note that despite the overlap between the ADC values of different groups, the ADCs of SBO are significantly higher than those of lymphoma and NPC. The dotted line represents the cutoff value (1.08⫻10⫺3mm2/s) distinguishing SBO from NPC and
[image:3.594.133.454.40.422.2] [image:3.594.103.237.478.581.2]mean ADCST/ADCNST ratio of 0.86 ⫾ 0.10. For the other
groups, the mean ADCST values and the mean ADCST/
ADCNSTratios calculated were 0.74⫾0.18⫻10⫺3mm2/s
and 0.50⫾0.13 for NPC, 0.59⫾0.11⫻10⫺3mm2/s and
0.39⫾0.09 for lymphoma, and 0.99⫾0.34⫻10⫺3mm2/s and 0.68⫾0.32 for metastatic disease, respectively.
The statistical analysis with the Wilcoxon signed rank test demonstrated a significant difference in the ADC values of normal and affected soft tissues (P⫽.0078) in patients with SBO. There was also a statistically significant difference in the ADC values (P⫽.0002) and ADC ratios (P⫽.0001) of the soft-tissue lesions among the 4 categories by the Kruskal-Wal-lis test. When the groups were compared with each other with the Mann-Whitney test for independent samples, significant difference was detected among patients with SBO and NPC as well as among those with SBO and lymphoma (P⬍.0001 for the ADC values and for the ADC ratios). The box-and-whisker plot of the ADCSTvalues of the 4 categories is shown in Fig 2.
All patients with lymphoma and all except 1 patient with NPC had ADC values and ADC ratios lower than the lowest values (0.91⫻10⫺3mm2/s and 0.70, respectively) observed in pa-tients with SBO. When an ADC value equal or higher than 1.08 ⫻10⫺3mm2/s and an ADC ratioⱖ0.74 were used to rule out
lymphoma and NPC, the accuracy was 96%, with a sensitivity of 89%, specificity of 100%, positive predictive value of 100%, and negative predictive value of 95%.
The ADC value of a single patient with SBO (patient 5, presumed to have fungal SBO) was lower than this ADC threshold of 1.08⫻10⫺3mm2/s.
There was no statistically significant difference between the ADCSTvalues and ADC ratios of patients with SBO and
pa-tients with skull base metastases (P⫽.0770). When the cutoff ADC value of 1.08⫻10⫺3mm2/s was used to differentiate patients with SBO from all 3 groups of patients with neoplastic lesions of the skull base, the accuracy was 86%, with a sensi-tivity of 89%, specificity of 85%, positive predictive value of 67%, and negative predictive value of 96%.
The mean ADCNSTand ADCPONSvalues were calculated
and are demonstrated in Table 2. When these mean ADCNST
and ADCPONSvalues were compared, no significant difference
was found among the 4 categories (P⫽.9694 for ADCNST
andP⫽.4579 for ADCPONS), confirming the validity of the
measurements.
Discussion
SBO is an uncommon aggressive infection, which can be chal-lenging to diagnose and treat.2In most patients, it arises from
the spread of an ear infection called “malignant or necrotizing otitis externa.” The process originates as a soft-tissue infec-tion of the EAC, then spreads to the skull base through the fissures of Santorini (along the floor of cartilaginous EAC) and then to the tympanomastoid suture and along the
fas-cial planes.2,3,10,11 It causes bone destruction of the skull base and involves the skull base foramina, causing cranial neuropathies. This condition is typically seen in an elderly patient with diabetes as illustrated by our patients who all had diabetes.2,3 The affected individuals usually present with otalgia, otorrhea, and hearing loss, as seen in our pa-tients. Although the previously reported mortality rate of 50% has decreased to 0%–15%, this disorder is still difficult to cure.12,13In our group of patients, the mortality and morbidity rates were 33.3% and 60%, respectively. It is, therefore, crucial to make the correct diagnosis to prevent progression of the inflammation to the skull base foramina and to prevent fatal complications.
Although in the setting of appropriate clinical and labora-tory findings, the combination of technetium and gallium scintigraphies can suggest the diagnosis, patients presenting with cranial neuropathies often undergo radiologic evaluation with CT or MR imaging, which could be nonspecific.14-16The
typical radiologic changes in SBO include hypointensity of the clival bone marrow signal intensity on T1-weighted images, infiltration and obliteration of the parapharyngeal fat planes, decreased T1 signal intensity, and enhancement within the soft tissues beneath the skull base and infiltration of the retro-condylar fat (as illustrated in Fig 3).5,8,9,17However, for the
inexperienced reader, the appearance of the soft tissues (es-pecially on T1-weighted images) and accompanying bone marrow changes may suggest a skull base malignancy such as advanced NPC, metastatic disease, or lymphoma.5-8We,
therefore, sought to evaluate the value of DWI as a possible technique to assist in the differential diagnosis.
DWI has been investigated for its capability to characterize tissue in various diseases and was found to increase the accu-racy of imaging in distinguishing malignant and benign masses as well as discriminating metastatic nodes from benign lymphadenopathies.18-23The diffusion characteristics of the
tissue depend on its microstructure (its cellularity, nucleus/ cytoplasm ratio, nature of the extracellular matrix, and so forth) and its perfusion (micromotion of molecules in its cap-illaries).24In general, malignant neoplasms with enlarged
nu-clei, hypercellularity, and a reduced extracellular matrix have reduced ADC values, whereas benign neoplasms have higher ADC values.25Our results also reflect these changes—that is,
the mean ADCSTvalues for SBO were higher than those of
neoplastic tissue groups. The difference was significant for NPC and for lymphoma, the major differential diagnoses in the patients with SBO.5ADC values of all except 1 patient with
SBO were higher than the ADC values of patients with NPC and lymphoma. The exception was the patient with SBO who improved after the antifungal treatment. This finding is in-deed consistent with previously published reports showing de-creased ADC values in some fungal abscesses.26,27
Normally inflammation causes an increase in the extracel-Table 2: ADC values and ratios for each group
Dx ADCST ADCNST ADCST/ADCNST ADCPONS
SBO 1.26⫾0.19 (0.91–1.45) 1.47⫾0.18 (1.23–1.80) 0.86⫾0.10 (0.70–1.02) 0.77⫾0.09 (0.64–0.89) NPC 0.74⫾0.18 (0.51–1.03) 1.53⫾0.28 (1.23–1.9) 0.46⫾0.09 (0.27–0.57) 0.75⫾0.13 (0.61–1.05) Lymphoma 0.59⫾0.11 (0.41–0.80) 1.53⫾0.23 (1.20–1.87) 0.37⫾0.06 (0.24–57) 0.79⫾0.21 (0.67–0.86) Metastasis 0.99⫾0.34 (0.5–1.39) 1.53⫾0.35 (1.01–2.12) 0.64⫾0.32 (0.41–1.38) 0.79⫾0.04 (0.71–0.85)
The ADC values are expressed as mean⫾SD (minimum ADC value⫺maximum ADC value)⫻10⫺3
mm2
[image:4.594.52.532.60.114.2]lular water, resulting in an increase of the ADC values.28In our
study, although the ADCSTvalues of the affected soft tissues in
SBO were higher than those in the neoplastic lesions, the val-ues were lower than those in ADCNST. The mean ADCSTvalue
in SBO was also lower than previously reported values (2.76⫾ 0.32⫻10⫺3mm2/s) of ADC in the inflammatory tissues in the
head and neck.28This result may, of course, be related to the characteristics of the magnet and may also be affected by the small size of our study group. However, the mean ADCNST
(1.47⫾0.18⫻10⫺3mm2/s) obtained for comparison was
within the average values reported for normal ADC of the soft tissues (1.488 –1.608⫻10⫺3mm2/s).29
In a study evaluating the CT and MR imaging appearances of necrotizing otitis externa, the authors reported relatively low T2 signal intensity of the abnormal soft tissues beneath the skull base and concluded that the histopathologic characteris-tics of the disease with a denser matrix and associated fibrosis would explain the relative decrease of T2 signal intensity.17
Indeed the histopathologic evaluation of the presented pa-tients with SBO revealed fibrosis accompanying chronic in-flammation in all patients, which may also explain our obser-vation of a relative decrease of ADC values in SBO relative to the normal soft tissue of the skull base.
Apart from benign/malignant discrimination of the le-sions, DWI may further demonstrate specific diffusion pa-rameters related to the histopathologic characteristics of the lesions. It has been shown that the ADC values are significantly lower in the neck masses and lymphadenopathies of lym-phoma than in SCC.18-20Correspondingly in our study, the
mean ADC value of patients with lymphoma was lower than
that of patients with NPC. The mean ADC value for lym-phoma was similar to the values reported in the literature (0.65⫾0.09 to 0.66⫾0.17⫻10⫺3mm2/s).18-20However, in our study, the mean ADC value of SCC of the nasopharynx was lower than that previously reported (0.96⫾0.11 to 1.13⫾ 0.43⫻10⫺3mm2/s).19,20This might have resulted from the
fact that 8/9 of our patients with NPC had NPC of an unferentiated type (Table 1), and the ADC values of poorly dif-ferentiated carcinomas are known to be lower than those in differentiated tumors.18
The ADC values of metastatic lesions showed a great vari-ability (0.5–1.39⫻10⫺3mm2/s), resulting in a large overlap
with lesions of patients with SBO and NPC. The mean ADC value of metastatic lesions was significantly different only from the mean ADC of lymphoma. This variability (as seen in Fig 2) may be partly due to the histologically heterogeneous aspect of the metastatic group (because our case numbers were very limited, it was not possible to subgroup those lesions into homogeneous groups) but is probably mostly related to the primary histologic characteristics of the metastatic lesions, some having high ADC values. However, it would be interest-ing to evaluate the DWI findinterest-ings of multiple myeloma in com-parison with SBO, lymphoma, and NPC in further studies.
[image:5.594.56.538.43.317.2]several reasons: First, it is difficult to outline a region of inter-est, and there are usually susceptibility artifacts in the skull base marrow. Also the skull base bony involvement was subtle in a few patients with SBO and lymphoma. Additionally, the measured diffusion sequences were performed on 2 different MR imaging scanners, which might possibly affect the mea-sured ADC values, but the results from different scanners are being routinely used as comparisons in the literature. Besides, comparable results of normal soft tissue of the skull base and the pons obtained from each scanner support our belief that the use of various magnets is not a major limitation, but more investigation is needed in this field to make a definite assessment.
Conclusions
SBO, a potentially life-threatening disorder, is frequently eval-uated by MR imaging, but the lack of specific findings may hinder the differential diagnosis from neoplastic processes af-fecting the skull base, causing delay in the diagnosis and treat-ment. Our study demonstrated that DWI might help in this setting, especially to distinguish SBO from lymphoma and NPC, which may appear similar on conventional sequences. However, further experience and studies with larger groups are needed to make a definite statement on this subject.
References
1. Rubin J, Yu VL.Malignant external otitis: insights into pathogenesis, clinical manifestations, diagnosis, and therapy.Am J Med1988;85:391–98 2. Sreepada GS, Kwartler JA.Skull base osteomyelitis secondary to malignant
otitis externa.Curr Opin Otolaryngol Head Neck Surg2003;11:316 –23 3. Carfrae MJ, Kesser BW. Malignant otitis externa.Otolaryngol Clin North Am
2008;41:537– 49, viii-ix
4. Slattery WH 3rd, Brackmann DE.Skull base osteomyelitis: malignant external otitis.Otolaryngol Clin North Am1996;29:795– 806
5. Chang PC, Fischbein NJ, Holliday RA.Central skull base osteomyelitis in pa-tients without otitis externa: imaging findings.AJNR Am J Neuroradiol 2003;24:1310 –16
6. Clark MP, Pretorius PM, Byren I, et al.Central or atypical skull base osteomyelitis: diagnosis and treatment.Skull Base2009;19:247–54 7. Subburaman N, Chaurasia MK.Skull base osteomyelitis interpreted as
malig-nancy.J Laryngol Otol1999;113:775–78
8. Karantanas AH, Karantzas G, Katsiva V, et al.CT and MRI in malignant exter-nal otitis: a report of four cases.Comput Med Imaging Graph2003;27:27–34 9. Kwon BJ, Han MH, Oh SH, et al.MRI findings and spreading patterns of
necrotizing external otitis: is a poor outcome predictable? Clin Radiol 2006;61:495–504
10. Nadol JB Jr.Histopathology of pseudomonas osteomyelitis of the temporal bone starting as malignant external otitis.Am J Otolaryngol1980;1:359 –71 11. Bernheim J, Sade J.Histopathology of the soft parts in 50 patients with
malig-nant external otitis.J Laryngol Otol1989;103:366 – 68
12. Chandler JR.Malignant external otitis.Laryngoscope1968;78:1257–94 13. Narozny W, Kuczkowski J, Mikaszewski B.Infectious skull base osteomyelitis:
still a life-threatening disease.Otol Neurotol2006;27:1047– 48, author reply 1048
14. Parisier SC, Lucente FE, Som PM, et al.Nuclear scanning in necrotizing pro-gressive “malignant” external otitis.Laryngoscope1982;92:1016 –19 15. Uri N, Gips S, Front A, et al.Quantitative bone and 67Ga scintigraphy in the
differentiation of necrotizing external otitis from severe external otitis.Arch Otolaryngol Head Neck Surg1991;117:623–26
16. Seabold JE, Simonson TM, Weber PC, et al.Cranial osteomyelitis: diagnosis and follow-up with In-111 white blood cell and Tc-99m methylene diphos-phonate bone SPECT, CT, and MR imaging.Radiology1995;196:779 – 88 17. Grandis JR, Curtin HD, Yu VL.Necrotizing (malignant) external otitis:
pro-spective comparison of CT and MR imaging in diagnosis and follow-up. Ra-diology1995;196:499 –504
18. King AD, Ahuja AT, Yeung DK, et al.Malignant cervical lymphadenopathy: diagnostic accuracy of diffusion-weighted MR imaging.Radiology 2007; 245:806 –13
19. Maeda M, Kato H, Sakuma H, et al.Usefulness of the apparent diffusion coef-ficient in line scan diffusion-weighted imaging for distinguishing between squamous cell carcinomas and malignant lymphomas of the head and neck.
AJNR Am J Neuroradiol2005;26:1186 –92
20. Wang J, Takashima S, Takayama F, et al.Head and neck lesions: characterization with diffusion-weighted echo-planar MR imaging.Radiology2001;220:621–30 21. Abdel Razek A, Soliman N, Elkhamary S, et al.Role of diffusion-weighted MR
imaging in cervical lymphadenopathy.Eur Radiol2006;16:1468 –77. Epub 2006 Mar 24
22. Razek AA, Sadek AG, Kombar OR, et al.Role of apparent diffusion coefficient values in differentiation between malignant and benign solitary thyroid nod-ules.AJNR Am J Neuroradiol2008;29:563– 68. Epub 2007 Nov 26
23. Srinivasan A, Dvorak R, Perni K, et al.Differentiation of benign and malignant pathology in the head and neck using 3T apparent diffusion coefficient values: early experience.AJNR Am J Neuroradiol2008;29:40 – 44
24. Le Bihan D, Breton E, Lallemand D, et al.Separation of diffusion and perfusion in intravoxel incoherent motion MR imaging.Radiology1988;168:497–505 25. Guo AC, Cummings TJ, Dash RC, et al.Lymphomas and high-grade
astro-cytomas: comparison of water diffusibility and histologic characteristics. Radiol-ogy2002;224:177– 83
26. Gaviani P, Schwartz RB, Hedley-Whyte ET, et al.Diffusion-weighted imaging of fungal cerebral infection.AJNR Am J Neuroradiol2005;26:1115–21 27. Charlot M, Pialat J-B, Obadia N, et al.Diffusion-weighted imaging in brain
aspergillosis.Eur J Neurol2007;14:912–16
28. Kito S, Morimoto Y, Tanaka T, et al.Utility of diffusion-weighted images using fast asymmetric spin-echo sequences for detection of abscess formation in the head and neck region.Oral Surg Oral Med Oral Pathol Oral Radiol Endod2006; 101:231–38. Epub 2005 Dec 27


![3 {3,3 Dimethylspiro[2,3 dihydro 1H indole 2,3′ (3′H naphtho[2,1 b][1,4]oxazin)] 1 yl}propionic acid](data:image/gif;base64,R0lGODlhAQABAIAAAP///wAAACH5BAEAAAAALAAAAAABAAEAAAICRAEAOw==)