http://www.scirp.org/journal/nr ISSN Online: 2158-7086
ISSN Print: 2158-706X
DOI: 10.4236/nr.2017.812047 Dec. 26, 2017 767 Natural Resources
Analysis of Digital Elevation Model and LNDSAT
Data Using Geographic Information System for
Soil Mapping in Urban Areas
Mohamed Ali Mohamed
Laboratory of Geomorphology, Soil Geography and Quaternary Research, Department of Geography, Humboldt University of Berlin, Berlin, Germany
Abstract
This study applies digital analysis methods of topographic data derived from digital elevation models (DEMs) and Landsat remotely sensed spectral data us-ing GIS tools to evaluate the quality and limitations of the morphometric pa-rameters (terrain attributes: TAs). This aims to check its suitability for digital soil mapping (DSM) and survey in urban areas at the target scale 1:50,000. This scale represents the standard scale level for compiling soil inventories within
all German states. The study is conducted on an urban area of 112.68 km2 in the
southwest part of the state of Berlin in Germany. These relief units are the basis for determining the soil mapping units at the scale of 1:50,000. The generated preliminary soil map was compared to soil maps made using traditional soil survey methods. For the mainly natural soils, the equivalence area is 94.91%, and for the anthropogenic soils, the equivalence area is 95.34%. The proposed me-thodology is adequate for preliminary mapping of soil units based on the digital derivation of TAs. Landsat scenes are spatially explicit, physical representations of environmental covariates on the land surface. The free DEM-ASTER in com-bination with Landsat OLI images is found to be the appropriate model to represent the terrain surface and derive the TAs for environmental modeling and fitting of derivation the relief units and their topography features. However, the 30 m spatial resolution and the fairly coarse spectral resolution of DEMs and Land-sat images limit their utility for digital soil mapping at this scale in urban areas with little topographic variation.
Keywords
Soil Mapping, Soil Survey, Terrain Modeling, Terrain Attributes, Spatial Analysis, DEM
How to cite this paper: Mohamed, M.A. (2017) Analysis of Digital Elevation Model and LNDSAT Data Using Geographic Infor-mation System for Soil Mapping in Urban Areas. Natural Resources, 8, 767-787. https://doi.org/10.4236/nr.2017.812047
Received: November 8, 2017 Accepted: December 23, 2017 Published: December 26, 2017
Copyright © 2017 by author and Scientific Research Publishing Inc. This work is licensed under the Creative Commons Attribution International License (CC BY 4.0).
http://creativecommons.org/licenses/by/4.0/
DOI: 10.4236/nr.2017.812047 768 Natural Resources
1. Introduction and Problematic
The soil is an essential lifeblood of human, animal and plant life. It is a valuable non-renewable resource that exists throughout the World in a broad diversity. Dif-ferent types of soil exhibit diverse behaviour and physical properties.
In urban agglomerations like Berlin, the soil fulfills particularly different func-tions, however it is a scarce property, which is not increasable. Therefore, it is imperative to minimize the use of urban areas to maintain soil functions and
qual-ities to sustain the ecosystem and human beings[1][2][3]. In order to meet the
legal requirements of soil functions protection according to the German Federal Soil Protection law (BBodSchG), detailed knowledge of the soil mapping to the urban soils is absolutely necessary. It has been recognized that the quality of the land suitability assessment and the reliability of land use decisions depend
large-ly on the quality of soil information used to derive them[4][5][6][7]. For this
purpose, soil surveys, such as digital soil mapping (DSM), are the main source of information for sustainable soil protection and land-use management.
Previous studies have investigated the topic DSM und survey [3][7]-[31]. Over
the last two decades, a number of methods have been developed based on the GIS-supported analysis of relief data and satellite imagery, with the help of which it is also possible to contribute pedological expertise and to use a real available information on the various target scales. In recent years, DEMs and relief para-meters (digital terrain data), which are derived from them, have also been used for soil mapping and for soil feature prediction [3][8][12][13][14][15][27][32] [33][34][35]. The derivation and use of relief attributes, as well as the relation-ship between soil and relief, are also of particular importance in this work.
In the case of classical soil mapping, the understanding of the mapper is used through the land-landscape relations to produce soil forms maps or soil types maps [36]. The great advantage of this investigation strategy is that it requires a relative-ly small sample effort. However, it is in a position not able to display continuous transitions and does not provide any information on the spatial variability of indi-vidual soil properties. Furthermore, the traditional methods of soil survey on the terrain and the laboratory analyses are expensive and time consuming due to the large number of observations. At the same time, advances in computer and infor-mation technology have introduced new group of tools, methods, instruments and systems, which offer new possibilities for obtaining relevant digital surface data to the soil, for incorporating these data into the structure of a soil information sys-tem, to carry soil mapping comprehensive, cost-effectively and in a shorter time. For example, rapid developments in new technologies such as Remote Sensing (RS) and Geographic Information System (GIS) provide new approaches to meet
the demand of resource related modeling [4][6]. With the increasing availability
DOI: 10.4236/nr.2017.812047 769 Natural Resources In recent years, thematic mapping has undergone a revolution as the result of advances in geographic information science and remote sensing. For soil map-ping archived data is often sufficient and is available at low cost. [37] stated that integration of Remote Sensing within a GIS database can decrease the cost, re-duce the time and increase the detailed information gathered for soil survey. Both data sources, the satellite images and the digital elevation model (DEM) have world-wide coverage, and definitely help to characterize the soil forming environment. Particularly, the use of digital elevation model (DEM) is important to derive ter-rain attributes of landscape that are utilized in land forms characterization
[12] [38], DEM quantitatively represents the continuous variation in the
land-scape relief characterization [8][39]. Therefore, terrain attributes (TAs) derived
from digital elevation models (DEM) are being increasingly used as auxiliary covariates in the spatial prediction of soil classes (units) and properties [40][41], due to the high ratio of TA with soil genesis and the wide availability of DEMs
[42][43].
DEM can be manipulated to provide many kinds of data that can assist the soil surveyor in mapping and giving a quantitative description of landforms and of soil variabilities. It provides greater functionalities than the qualitative and no-minal characterization of topography. The local landform or relief, represented through DEM, has a major impact on soils by controlling water and sediment movements
[27][44], together with other factors, such as parent rock. By itself, the DEM can
yield maps of slopes, aspects, rate of change of slope, drainage network on cat-chments areas [3][38][45].
The derivative products from DEM, such as elevation, slope, exposition, aspect and curvature which through histograms or reference areas allow to compare with
traditional soil map[46], as well as to make rules that will be applied to a DEM
[42]. Both reference areas and histograms need a wide knowledge of the study
area to delineate samples[47] or to classify soils. These derivative products can al-so be used with the Landsat TM images to improve their capabilities for al-soil map-ping [48].
Reflectance and emission data can be analyzed to extract information about the Earth and its resources, as the physical and chemical properties of different surfaces vary across the electromagnetic spectrum. Satellite-derived remote-sensing imagery from a particular sensor has a wide range of spectral and spatial proper-ties. Spectral resolution refers to the number of spectral bands and the width of the electromagnetic spectrum sensed in each band. Spatial resolution refers to the area on the ground represented by an individual pixel. Spectral bands with con-trasting spectral characteristics for the minimum area (pixel size) on a given
sur-face can be compared to differentiate features on the Earth’s sursur-face [26]. Visible
and shortwave infrared (SWIR) bands of Landsat Multispectral Scanner (MSS) and Thematic Mapper (TM) data have been extensively used for terrestrial Land cover
analysis since the Landsat program began in 1972 [49][50].
environ-DOI: 10.4236/nr.2017.812047 770 Natural Resources mental covariates on the land surface can be derived for vegetation (e.g., norma-lized difference vegetation index, fractional vegetation cover), soil, and parent material and/or soil (e.g., band ratios diagnostic for natural and anthropogenic materials), and their quantitative relationships used to predict soil distribution. Therefore, Landsat remotely sensed spectral data can serve for digitally mapping soil distribution on the landscape. In this context, in this context, the advan-tage of remote sensing data: the fast collecting, wide availability and low expense are efficient in digital soil mapping in contrast with terrestrial survey and field works.
In areas with sufficient relief, topographic data derived from digital elevation models (DEMs) can also be combined with Landsat-derived environmental co-variates in the GIS-environment to quantitatively model soil distribution on the
landscape[26]. These digital data can be analyzed using commercially
availa-ble image processing software. Various classification and analysis methods (e.g., optimum index factor, principle component analysis, and unsupervised and su-pervised classification) can be used to recognize meaningful soil-landscape pat-terns.
Training sites for DSM can be selected from existing soil surveys or from areas that have actual field data collection points. Accuracy assessment of the delinea-tion of the relief units and the corresponding soil units can be performed by com-paring with traditional data derived from field survey, and various classification methods can be used to generate estimates of prediction error.
This study applied a digital pedological mapping methodology using mor-phometric parameters (terrain attributes TAs) and GIS tools to represent the terrain surface and drive TAs, as an alternative and improved method for map-ping soil patterns in urban areas. The purpose of this study to apply methods of digital relief and satellite image analysis in a test area in the city area of Berlin to evaluate the quality and limitations of free DEM data in DSM in the target scale 1:50,000, with regard to the scale of freely available DEMs compared to a soil maps obtained by a traditional survey. The study area covers the entire area of the topographical chart Berlin-Zehlendorf, scale 1:25,000. The study contributes to improve the understanding of the influence on soil formation and distribu-tion, guide the pedologists in their fieldwork and augment their understanding of the soil-landscape relationship. In addition, the applied procedures can be understood as a step before, an approach to improve traditional surveys in order to generate soil maps in reasonable time and to produce better and more useable results.
2. Study Area
2.1. Location, Demarcation and Climate
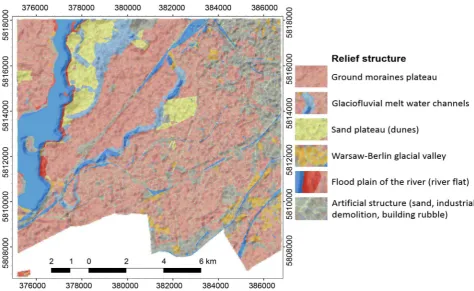
DOI: 10.4236/nr.2017.812047 771 Natural Resources Figure 1. Location map of the study area, analytical DEM (left) and false colors composite of Landsat TM image (band 6-5-4 as RGB) (right).
North European Plain, Berlin is influenced by a temperate seasonal climate. The city is located in the temperate climate zone with humid continental climate. The average annual temperature in Berlin-Dahlem is 8.9˚C and the average an-nual precipitation is 580 mm. The warmest months are July and August, with average temperatures of 18.2˚C - 19.1˚C while the coldest month is January, with average temperature of 0.6˚C. Berlin’s built-up area creates a microclimate, where heat is stored by the buildings. The temperatures can be up to 4˚C higher in the city than in the surrounding areas. Elevation in the study area varies from 116 to 30 m above sea level and generally decreases from Northwest to Southeast. The major Land use and land cover in the area are built-up (residential and
DOI: 10.4236/nr.2017.812047 772 Natural Resources 31.14 km2, agricultural land 2.24 km2 and water bodies 7.78 km2.
2.2. Natural Differentiation, Geology and the Starting Material
Berlin is located in the middle of the young moraine zones of North Germany between the Baruther and the Eberswalder glacial valley. Its surface forms are the result of the coverage of the Weichselian inland ice of the Pleistocene period. There-fore, the resulting glacial basic framework of the relief was subsequently mod-ified by periglacial and Holocene geomorphologic processes.
Characteristic of the study area are the melt water channels and plateaus of ground moraines. During these cold periods, different materials were deposited (fine sand, middle sand, coarse sand to gravel, gravel with boulders and washed-out re-mains of ground moraine). The study area is situated on the plateau Teltow in city area of Berlin. This plateau represents the glacial accumulations (boulder clay or moraine clay) of the ground moraines (ground moraine areas). The ground ele-vations average is from 40 to 60 m above sea level and generally decreases from Northwest to Southeast. Individual heights rise above the sea level in the area up to over 100 meters. For instance, the highest mountain of Berlin-the Teufelsberg (“Devil’s Mountain”) with 114.7 m, is piled up debris from the Second World War. The starting rock for soil formation, which reflects the natural-spatial differen-tiation of the city area of Berlin, is determining for the soil types. The boulder loam (glacial loam) and boulder clay of the ground moraine, which are composed of mostly loamy to very loamy sand and contain about 20% of lime content, are
pre-dominantly found on the plateau of study area [51]. Boulder sands dominate
part-ly in the study area. In the case of boulder sands (glacial sands), these are predo-minantly medium sand to slightly silty fine sand below 10%. Sea chalks are found in the melt water channels and fine flying sand (wind-borne sand) in the dunes. The debris or accumulations of technogenic substrates are often used as coarse
rubble material [51]. As a result, semi-natural and anthropogenic soil types are
alternating in the study area. Therefore, the area is characterized by a high hete-rogeneity of the relief and the initial substrate and thus also of the soils (Table 1,
Figure 2).
3. Material and Methods
DOI: 10.4236/nr.2017.812047 773 Natural Resources Table 1. Relation of relief, substrate and soil type in the investigation area (simplified ac-cording to [51]).
Relief unit Predominant soil type Soil classification
according to WRB (2014) Typical starting substrate
Flood plain of the river (river flat)
Cambisols Eutric Histosol (lower bog) Fluvisols
Flying sand (wind-borne sand), peat
Regosol Calcaric Regosol Cambisols (brown soil) Hortisol (horticultural soil) Gleysol Gleysol-Calcaric Regosol
Glaciofluvial melt water channels
Cambisols (brown soil) Gleysols
Eutric Histosol (lower bog) Loamy sand (glacial sand)
Ground moraines plateau
Cambisols (brown soil) Gleysols-Cambisols Dystric Cambisols-Cambisols
Boulder loam (glacial loam), boulder clay (glacial clay)
Regosol Calcaric Regosol Hortisol (horticultural soil)
Boulder clay (glacial clay), partly rubble or accumulations of sand
Hortisol (horticultural soil) Necrosol Cambisols (brown soil)
Loamy sand (glacial sands), boulder clay (glacial clay)
Calcaric Regosol Loose Lithosol (raw soil of loose material) Regosol
Loamy sand (glacial sands), boulder clay (glacial clay),
building rubble Regosol
Gleysols-Regosols Loose Lithosols (raw soils of loose material)
Cambisols (brown soil) Dystric Cambisols (rusty brown soils)
Loamy sand (glacial sands)
Necrosol Loamy sand (glacial sands)
Sand plateau (dunes)
Dystric Cambisols (rusty brown soils)
Regosol
Colluvial Cambisols (brown soil) Gleysols
Loamy sand (glacial sands), boulder loam (glacial loam)
Warsaw-Berlin glacial valley
Calcaric Regosol Regosol Loose Lithosols (raw soils of loose material)
Valley sand, partly rubble or accumulations of sand
Artificial structure (sand, industrial
demolition, building rubble)
Loose Lithosols (raw soils of loose material)
Regosol Calcaric Regosol
Lithosols
Rubble or accumulations of sand, industrial demolition,
DOI: 10.4236/nr.2017.812047 774 Natural Resources Figure 2. Relief structure of the study area: overlapping of relief derivatives elevation, slope, vertically curvature (RGB).
sensing data [39]. Furthermore, a number of reference information from digital
Environmental Atlas of Berlin could be used for the study area: Digital soil map 1: 50,000 (2010), geological maps 1:10,000 (1990) and 1: 50,000 (2016), soil eval-uation map 1: 50,000 (2013), Topographic map 1:25,000 (2007) and 1:50,000 (2008) and Land use plan 1:50,000. In addition, large-scale soil maps (1:5000 - 101,000, 2008) for parts of study area were also used.
The delineation of the land features from the satellite data needs a high spatial resolution images; therefore, the spatial resolution of the used Landsat 8 (Opera-tional Land Imager-OLI) was enhanced through the data merge process. This process is commonly used to enhance the spatial resolution of multi-spectral datasets using higher spatial resolution panchromatic data or single band (band
8 of Landsat 7 and 8) [30]. In this study merged data were performed using
mul-ti-spectral bands (30 m) as a low spatial resolution with panchromatic band 8 of OLI image as a high spatial resolution (15 m) resulting in multi-spectral data with high spatial resolution (15 m). The use of Landsat images allow to estimate meteorological conditions during and before the recording, to recognize the re-lief elements (for example, of V-shaped and flat-trough valleys) and to determine substrate-related and phenological differentiation of the stock of the agricultural and forest areas. Therefore, the procedures of data pre-processing and the su-pervised and unsusu-pervised classification as well as the relevant Indices were ap-plied on individual scenes using Software ERDAS imagine 10.1 and ArcGIS 10.4
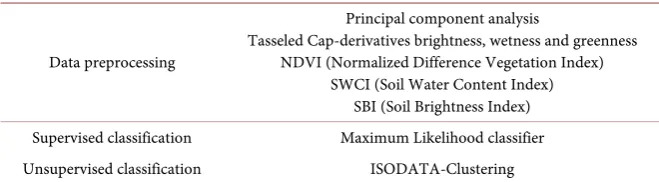
DOI: 10.4236/nr.2017.812047 775 Natural Resources Table 2. Applied methods of satellite image processing.
Data preprocessing
Principal component analysis
Tasseled Cap-derivatives brightness, wetness and greenness NDVI (Normalized Difference Vegetation Index)
SWCI (Soil Water Content Index) SBI (Soil Brightness Index)
Supervised classification Maximum Likelihood classifier
Unsupervised classification ISODATA-Clustering
The data extracted from the OLI images depend upon the image texture, parce-ling, pattern, shape, size, color, site and situation. The soil map’s legend of study
area was converted to World Reference Base for Soil Resources (WRB) of [52]. The
origin of soil deposits (starting rock for soil formation) and initial substrate were extracted from geological map of the study area. The remotely sensed data and soil map were geometrically rectified to a common Universal Transverse Mercator (UTM) coordinate system optimally enhanced and histogram matched to be com-parable during the visual interpretation through ERDAS imagine and ArcGIS soft-ware.
DEM-ASTER (Advanced Spaceborne Thermal Emission and Reflection Ra-diometer) (resolution 30 m), obtained from the active sensor database ASTER GDEM v2 (version 2 of Global Digital Elevation Model), available for the entire globe, of the United States Geological Survey (USGS). The DEM-ASTER data has been used in conjunction with controlled OLI Data to provide a better visua-lization of the terrain in the study area. In addition, this 3D presentation of the landscape of study area is required to visualize the soil and relief elements
rela-tionships, where the maps of the topographic features (i.e. surface elevation,
slope, aspect, shaded relief, convexity and soil moisture content) were generated using ArcGIS software. Accuracy of elevation data, number of analyses and
ex-tent of spurious depressions of the DEM were compared, as suggested by [53], as
well as the quality of the derived TAs. These TAs were chosen for being directly related to water movement in the soil, with an influence on the soil formation process [8][16][39].
The resulted maps were spatially smoothed for the eliminating the speckle ef-fects with the “majority-filter” (3 × 3 pixels) and were represented using the “Focal Flow” function in ArcGIS. The DEM data and the maps of classes surface
elevation, slope and shaded relief of the study area were shown on the Figure 2.
The topographical map 1:25,000 was used for the interactive digitalization on the screen to increase the resolution of the limitation of relief units on the DEM, in particular in the sink areas and in horizontal and vertical slope.
The joint interpretation of all the maps and the overlay function were used to determine the physiographic units and the digital soil map. The colour hill shade relief map with slope classes was produced by overlying the final classes maps of the topographic features of study area in order to define physiographic units
com-DOI: 10.4236/nr.2017.812047 776 Natural Resources posite and classified Landsat images of the studied area to delineate soil bounda-ries and other land features. The maps were reclassified and converted to shape files. In the shape file format, the intersect function was applied to the maps to generate the preliminary digital soil map. The final preliminary soil map, derived from DEM and OLI Images, was compared with the original soil map of digital Environmental Atlas of Berlin, which was generated by traditional soil mapping
and has many physical and chemical properties stored in its database (Figure 3
and Figure 4).
4. Result and Discussion
The results of applied digital relief and satellite image analysis were checked in terms of their suitability for soil mapping in the target scale 1:50,000, which represents the official scale level for compiling soil inventories within the German state of Ber-lin, as well as in other German states.
A statistical check of the evaluations of digital mapping of soil boundaries was also made, since the acquired surface data in the traditional soil map represent
soil associations (Table 3). The delimited homogeneous relief units on the DEM,
which were limited by the ArcGIS program, are reflected in the soils units of the
original soil map 1:50,000 (compare Figure 2 and Figure 3). The final
[image:10.595.59.536.390.708.2]prelimi-nary digital soil map was the compared with original soil map using the “intersect”
DOI: 10.4236/nr.2017.812047 777 Natural Resources Figure 4. Original soil map of digital environmental atlas of Berlin elaborated by traditional soil mapping.
function (Figure 3 and Figure 4). With the DSM, six soil associations formed on
six different relief units were identified and mapped in 26 mapping units. The soils of mainly natural litho- and pedogenesis were formed mainly on deposits of glacial loam, glacial clay and glacial sands. The soils of anthropogenic were formed mainly on deposits of glacial sands, glacial clay and accumulations of industrial
demolition and building rubble (Table 1).
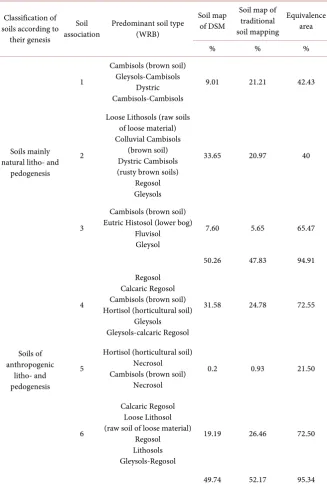
Table 3 shows the equivalence areas of six soil associations on the digital soil
map and the traditional soil map. For the soils of mainly natural litho- and pe-dogenesis, the equivalence area was 94.91%, and for the soils of mainly of anth-ropogenic litho- and pedogenesis, the equivalence area was 95.34%. However, at the level of soil associations the soils of mainly natural litho- and pedogenesis have small equivalence areas compared to the soils of mainly of anthropogenic litho- and pedogenesis. Figure 4 represents the results for this soil type. Table 3 shows that 50.26% of the study area was classified in the digital soil map as mainly natural soils: 9.01% as soils of the association (1), 33.65% as soils of the associa-tion (2) and 7.60% as soils of the associaassocia-tion (3).
The soil of the association (1) was confused with the soil of the association (2) in the higher altitude, because both occur at the same altitude and have similar morphometric characteristics, which proved to be a limitation in the proposed
DOI: 10.4236/nr.2017.812047 778 Natural Resources Table 3. Comparing the soil associations of DSM with soil associations of the traditional soil mapping.
Classification of soils according to
their genesis
Soil
association Predominant soil type (WRB)
Soil map of DSM
Soil map of traditional soil mapping Equivalence area % % % Soils mainly natural litho- and
pedogenesis
1
Cambisols (brown soil) Gleysols-Cambisols
Dystric Cambisols-Cambisols
9.01 21.21 42.43
2
Loose Lithosols (raw soils of loose material) Colluvial Cambisols
(brown soil) Dystric Cambisols (rusty brown soils)
Regosol Gleysols
33.65 20.97 40
3
Cambisols (brown soil) Eutric Histosol (lower bog)
Fluvisol Gleysol
7.60 5.65 65.47
50.26 47.83 94.91
Soils of anthropogenic litho- and pedogenesis 4 Regosol Calcaric Regosol Cambisols (brown soil) Hortisol (horticultural soil)
Gleysols Gleysols-calcaric Regosol
31.58 24.78 72.55
5
Hortisol (horticultural soil) Necrosol Cambisols (brown soil)
Necrosol
0.2 0.93 21.50
6
Calcaric Regosol Loose Lithosol (raw soil of loose material)
Regosol Lithosols Gleysols-Regosol
19.19 26.46 72.50
49.74 52.17 95.34
of the association (4) were overestimated in the southeastern part, where it was
confused with the soil of the association (1). Table 3 shows that 49.74% of the
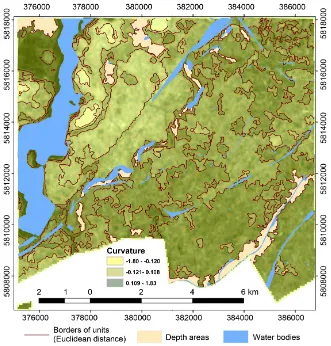
DOI: 10.4236/nr.2017.812047 779 Natural Resources reveres and the water channels, the wetlands with hydromorphic soils predomi-nate, and it confused with the soil of the association (2) (Figure 3 and Figure 4). Each relief unit represents in the study area an average vertical and transverse curvature. The Euclidean distance is used as a measure of the separability of the relief units. The definition of the respective parameter settings is based on the expert’s experience and expertise. These results are in line with results of [39] and
[41], who showed that DEM with a low variation in elevation values generated more
accurate prediction models of soil classes (units) with a higher number of homo-geneous relief units.
In contrast to the creation of analog maps, all steps of the selection and mod-eling process on the DEM are identifiable and verifiable. The ArcGIS program offers the possibility to select and vary parameter settings and input data depen-dent on the target scale. The degree of generalization of the results can be
deter-mined, especially with the determination of the number of classes (units) (Table
2). There are deficits in the overlapping areas of the high-altitude data of the
[image:13.595.209.540.349.695.2]to-pographic map 1:25,000 as well as due to the low data density in horizontal and vertical slope (flat areas of slope) apart from the vertical unit depth areas (com-pare Figure 1 and Figure 5). In this context, the genesis of the slope areas played
DOI: 10.4236/nr.2017.812047 780 Natural Resources
an important role. According to study of [39], this can be also attributed to the
presence of vegetation at some points in the terrain, especially in the valleys, as-sociated with the flat to gently undulating relief, was responsible for the poor performance of DEM-ASTER. Due to their fluvial genesis, deep areas, in con-trast to vertical and slope areas, which were influenced by periglacial and Aeo-lian processes, usually have a recognizable vertical limitation. In order to deter-mine the other relief units, such as plateaus and plateau edges, the relief analyses method using ArcGIS led to a satisfactory relief classification of the study area. The spatial differentiation corresponds to the topographical map 1:25,000 of the study area.
In an evaluation of the accuracy of a DEM to determine the relive units for the
DSM, [54] observed the same behavior for the DEM elevation values obtained by
ASTER in an area in India. According to these authors, this is associated with also the presence of vegetation, artifacts on the surface and the flat terrain; DEM-ASTER data are particularly influenced by these factors, because the
eleva-tion data of this DEM are acquired by stereoscopy [55]. In another study using
GPS landmarks, the accuracy of DEM-Data was greater than that of the DEM obtained from topographic maps (scale 1:50,000). These authors also observed that DEM-Data (resolution 30 m) was more detailed in the representation of the soil surface [56].
An increase in the plausibility of the boundaries of relief units on the DEM at limited traceability could be achieved on the basis of the ArcGIS depth areas (sink areas) by an interactive digitization on the screen with the addition of the OLI scenes as well as the vertical curvature (Figure 5).
The analysis of the Landsat OLI images showed that only a visual interpreta-tion brought meaningful results within a reasonable period of time (with less vegetation coverage). The supervised and unsupervised classification methods applied on Landsat OLI channels and their preprocessing products led to good results in individual training areas. However, a transformation of these results to larger areas or to the entire field of investigation does not have the same accura-cy. This is different between the natural soils and anthropogenic soils. The post processing effort was too high in terms of practicability. The reasons are likely to be mainly due to the fact that the classified training areas did not meet the re-quirements with regard to representativeness and homogeneity for the entire in-vestigation area. These conditions ultimately apply only to a few farmlands, which have not undergone uniform agricultural processing. In addition to substrate and vegetation coverage, influence other difficult-to-handle factors, such as the type of agricultural processing and the spectral signal [14][57].
DOI: 10.4236/nr.2017.812047 781 Natural Resources Figure 6. Principle of the visual interpretation of soil-relevant contours and their relationship to relief, soil and substrate con-ditions.
satellite image scenes makes it possible to use the advantages of the respective season with regard to the imaging properties. Moreover, stable soil patterns can
be approached according to many studies [13][27][28].
The TAs are directly related to erosion and deposition processes, the speed of surface flows, reflected in the soil erosion rate, residual water content in the soil
profile and soil formation processes [16]. In DSM studies, these TA are used to
build predictive models of soil classes (units) and properties, and in this case, values that do not adequately represent the soil based on applied digital relief
and satellite image analysis can compromise the performance of the DSM [42].
Thus, DEM-based DSM studies should take the DEM quality into account and its range to minimize the error distribution in the resulting TAs. Moreover, this information can be an orientation in future studies of DSM in areas with these characteristics. The adjustment of a DEM to a scale enables the development of future studies like digital mapping of properties with higher quality and reliabil-ity of the resulting information.
The results this study showed that the free DEMs obtained by remote sensing, with resolution 30 m, could be used at scale of 1:50,000. However, the use of DEMs is more limited in areas with little topographic variation. According to [58], these
DEMs were constructed to provide terrain data on a global scale, i.e., for
DOI: 10.4236/nr.2017.812047 782 Natural Resources
5. Conclusions
Results of the investigation carried out demonstrate that digital relief analysis, DEM and satellite image evaluation using GIS have great relevance for the DSM of a target scale 1:50,000. The proposed methodology was adequate to identify types of soils. The Homogeneous relief units and interactively indicated depth areas along with their limitations are of special importance for comprehensible contour finding respectively demarcation of the borders of corresponding of soil units.
The satelliteimages used are only conditionally suitable for the spatial
deline-ation of soil relevant contours, but the DEM-data used are more suitable for this purpose. The prerequisite is a multi-temporal evaluation, which can lead to sta-ble patterns. At the same time, their strength lies in the content-related potential of the assessment of the inner heterogeneity of spatial units.
A simple method of the spatial and contextual integration of different infor-mation sets is the “intersect” function in GIS. For example, intersection of the ho-mogeneous relief units with the large and medium-scale soil and land uses maps, which lead to the formation of smallest common geometries. At the same time, it should be noted, that the product of the intersection in GIS is characterized by a large number of small-sized areas, which fall below a reasonable minimum area size for the target scale 1:50,000. Thus, they no longer are in relation to the dis-tribution of the soil forms. In addition, the intersection of information layers of different traceability led to an overall loss of traceability. One possibility to
ob-tain spatial units of a true-to-scale size, for example [59]presented, that the
in-tersection product of Landsat Images derivatives and digital relief was subjected to subsequent filtering with regard to redundant information.
A further possibility of the spatial and contextual integration of spatial data is the formation of common, spatially defined basic geometries. The area units are understood as spatial objects, which can be occupied with a surface data set or attributes in a subsequent step. In this way, it is possible to carry out an inte-grated relief and satellite image evaluation and to reach an expansion the
map-ping units in the sense of [60] and [61]. According to this, a land map is only a
“view” or evaluation method on the database of an areas data bank. The integra-tion of further locaintegra-tion parameters, such as land use and land cover, finally leads to use differentiated soil forms associations.
Thus, DEM-based DSM studies should take the DEM quality into account and its range to minimize the error distribution in the resulting TAs. Moreover, this information can be an orientation in future studies of DSM in areas with these characteristics. The adjustment of a DEM to a scale enables the development of future studies like digital mapping of properties with higher quality and reliabil-ity of the resulting information. In order to produce a detailed soil map using this methodology, additional fieldwork is necessary. Because the soils are a func-tion of five formafunc-tion factors: parent rock, relief, vegetafunc-tion, climate and time.
DOI: 10.4236/nr.2017.812047 783 Natural Resources DEM-ASTER with a spatial resolution of 30 m fitted to a scale of 1:50,000 for DSM in both initial soil survey and soil survey updates in urban areas with high topographic variation. In Addition, ASTER imagery and Landsat data can be as useful in digital soil mapping predictive models. This scale has high terrain detail-ing in the urban areas and is not recommended for use in semi-detailed DSMs in small areas with relief variation. This 30-m spatial resolution may limit some spa-tially detailed soil mapping applications.
The results proved that in order to get the best results for the use of the DEM in DSM, it is necessary to assess the DEM quality by additional indicators, aside from elevation. It is also necessary to use additional data such as satellites spec-tral data and ancillary data under the results of this study. The GIS based soft-ware is user friendly and can easily support necessary procedures for digital soil mapping and survey works.
Acknowledgements
This research was supported and funded by the Alexander von Humboldt Foun-dation. The work was carried out at the Department of Geomorphology and Soil Geography at the Geographical Institute at the Humboldt-Universität zu Berlin.
References
[1] Blum, W.E.H. (1993) Soil Protection Concept of the Council of Europe and Inte-grated Soil Research. In: Eijsackers, H.J.P. and Hamers, T., Eds., Integrated Soil and Sediment Research: A Basis for Proper Protection, Kluwer Academic Publishers, 37-47.https://doi.org/10.1007/978-94-011-2008-1_5
[2] De Groot, R.S., Wilson, M.A. and Boumans, R.M.J. (2002) A Typology for the Clas-sification, Description and Valuation of Ecosystem Functions, Goods and Services. Ecological Economics, 41, 393-408.https://doi.org/10.1016/S0921-8009(02)00089-7
[3] Aksoy, E., Özsoy, G. and Dirim, S.M. (2009) Soil Mapping Approach in GIS using Landsat Satellite Imagery and DEM Data. African Journal of Agricultural Research, 4, 1295-1302.
http://www.academicjournals.org/journal/AJAR/article-abstract/D00C9C238184
[4] Mermut, A.R. and Eswaran, H. (2001) Some Major Developments in Soil Science since the Mid-1960s. Geoderma, 100, 403-426.
https://doi.org/10.1016/S0016-7061(01)00030-1
[5] Bogaert, P. and D’Or, D. (2002) Estimating Soil Properties from Thematic Soil Maps. The Bayesian Maximum Entropy Approach. Soil Science Society of America Journal, 66, 1492-1500.
[6] Salehi, M.H., Eghbal, M.K. and Khademi, H. (2003) Comparison of Soil Variability in a Detailed and a Reconnaissance Soil Map in Central Iran. Geoderma, 111, 45-56.
https://doi.org/10.1016/S0016-7061(02)00252-5
[7] Ziadat, F.M., Taylor, J.C. and Brewer, T.R. (2003) Merging Landsat TM Imagery with Topographic Data to Aid Soil Mapping in the Badia Region of Jordan. Journal of Arid Environments, 54, 527-541.https://doi.org/10.1006/jare.2002.1076
[8] Moore, I.D., Gessler, P.E. and Nielson, G.A. (1993) Soil Attribute Prediction using Terrain Analysis. Soil Science Society of America Journal, 57, 443-452.
DOI: 10.4236/nr.2017.812047 784 Natural Resources
[9] Ming, Z., Goosens, R. and Daels, L. (1993) Application of Satellite Remote Sensing to Soil and Land Use Mapping in the Rolling Hilly Areas. EARSeL Advances in Remote Sensing, 2, 34-44.
[10] Odeh, I.O.A., McBratney, A.B. and Chittleborough, D.J. (1994) Spatial Prediction of Soil Properties from Landform Attributes Derived from a Digital Elevation Model. Geoderma, 63, 197-214.https://doi.org/10.1016/0016-7061(94)90063-9
[11] Boer, M., Barrio, G.D. and Puigdefabres, J. (1996) Mapping Soil Depth Classes in Dry Mediterranean Areas using Terrain Attributes Derived from a Digital Elevation Model. Geoderma, 72, 99-118.https://doi.org/10.1016/0016-7061(96)00024-9
[12] Dobos, E., Micheli, E., Baumgardner, M.F., Biehl, L. and Helt, T. (2000) Use of Combined Digital Elevation Model and Satellite Radiometric Data for Regional Soil Mapping. Geoderma, 97, 367-391.https://doi.org/10.1016/S0016-7061(00)00046-X
[13] Dobos, E., Montanarella, L., Negre, T. and Erika Micheli, E. (2001) A Regional Scale Soil Mapping Approach using Integrated AVHRR and DEM Data. International Journal of Applied Earth Observation and Geoinformation, 3, 30-42.
https://doi.org/10.1016/S0303-2434(01)85019-4
[14] Möller, M. (2001) Verfahren der digitalen Reliefanalyse und Satellitenbildauswer-tung für die Bodenkartierung des Zielrnaßstabes 1:50000 am Beispiel des Blattes Könnern. Photogrammetrie, Fernerkundung, Geoinformation, 2, 91-105.
[15] Gessler, P.E., Chadwick, O.A., Chamran, F., Althouse, L. and Holmes, K. (2000) Modelling Soil Landscape and Ecosystem Properties using Terrain Attributes. Soil Science Society of America Journal, 64, 2046-2056.
https://doi.org/10.2136/sssaj2000.6462046x
[16] Wilson, D.J. and Gallant, J.C. (2000) Digital Terrain Analysis. In: Wilson, D.J. and Gallant, J.C., Eds., Terrain Analysis: Principles and Applications, John Wiley and Sons, New York, 1-27.
[17] Bishop, T.F.A. and McBratney, A.B. (2001) A Comparison of Prediction Methods for the Creation of Field-Extent Soil Property Maps. Geoderma, 103, 149-160.
https://doi.org/10.1016/S0016-7061(01)00074-X
[18] Park, S.J., McSweeney, K. and Lowery, B. (2001) Identification of the Spatial Distri-bution of Soils using a Process-Based Terrain Characterization. Geoderma, 103, 249-272.
https://doi.org/10.1016/S0016-7061(01)00042-8
[19] Zhu, A.X., Hudson, B., Burt, J., Lubich, K. and Simonson, D. (2001) Soil Mapping using GIS, Expert Knowledge, and Fuzzy Logic. Soil Science Society of America Journal, 65, 1463-1472.https://doi.org/10.2136/sssaj2001.6551463x
[20] Florinsky, I.V., Eilers, R.G., Manning, G.R. and Fuller, L.G. (2002) Prediction of Soil Properties by Digital Terrain Modelling. Environmental Modelling & Software, 17, 295-311.https://doi.org/10.1016/S1364-8152(01)00067-6
[21] Park, S.J. and Burt, T.P. (2002) Identification and Characterization of Pedogeo-morphological Processes on a Hillslope. Soil Science Society of America Journal, 66, 1897-1910.https://doi.org/10.2136/sssaj2002.1897
[22] Manchanda, M.L., Kudrat, M. and Tiwari, A.K. (2002) Soil Survey and Mapping using Remote Sensing. Tropical Ecology, 43, 61-74.
http://www.tropecol.com/pdf/open/PDF_43_1/43106.pdf
[23] Ziadat, F.M. (2005) Analyzing Digital Terrain Attributes to Predict Soil Attributes for a Relatively Large Area. Soil Science Society of America Journal, 69, 1590-1599.
https://doi.org/10.2136/sssaj2003.0264
DOI: 10.4236/nr.2017.812047 785 Natural Resources
Soil Terrain Models. International Journal of Geographical Information Science, 20, 117-134.https://doi.org/10.1080/13658810500287073
[25] Liu, T.L., Juang, K.W. and Lee, D.Y. (2006) Interpolating Soil Properties using Kriging Combined with Categorical Information of Soil Maps. Soil Science Society of America Journal, 70, 1200-1209.https://doi.org/10.2136/sssaj2005.0126
[26] Boettinger, J.L., Ramsey, R.D., Bodily, J.M., Cole, N.J., Kienast-Brown, S., Nield, S.J., Saunders, A.M. and Stum, A.K. (2008) Landsat Spectral Data for Digital Soil Map-ping. In: Hartemink, A.E., McBratney, A. and Mendonça-Santos, M.L., Eds., Digital Soil Mapping with Limited Data, Springer, Berlin, 193-202.
https://doi.org/10.1007/978-1-4020-8592-5_16
[27] Valladares, G.S. and Hott, M.C. (2008) The Use of GIS and Digital Elevation Model in Digital Soil Mapping—A Case Study from São Paulo, Brazil. In: Hartemink, A.E., McBratney, A. and Mendonça-Santos, M.L., Eds., Digital Soil Mapping with Li-mited Data, Springer, Berlin, 349-356.
https://doi.org/10.1007/978-1-4020-8592-5_31
[28] Weber, E., Hasenack, H., Flores, C.A., Pötter, R.O. and Fasolo, P.J. (2008) GIS as a Support to Soil Mapping in Southern Brazil. In: Hartemink, A.E., McBratney, A. and Mendonça-Santos, M.L., Eds., Digital Soil Mapping with Limited Data, Sprin-ger, Berlin, 103-112.https://doi.org/10.1007/978-1-4020-8592-5_9
[29] Castrignano, A., Costantini, E.A.C., Barbetti, R. and Sollitto, D. (2009) Accounting for Extensive Topographic and Pedologic Secondary Information to Improve Soil Mapping. Catena, 77, 28-38.https://doi.org/10.1016/j.catena.2008.12.004
[30] Ali, R.R. and Kotb, M.M. (2010) Use of Satellite Data and GIS for Soil Mapping and Capability Assessment. Nature and Science, 8, 104-115.
[31] Kefi, M., Yoshino, K. and Setiawan, Y. (2012) Assessment and Mapping of Soil Ero-sion Risk by Water in Tunisia using Time Series MODIS Data. Paddy and Water Environment, 10, 59-73. https://doi.org/10.1007/s10333-011-0265-3
https://link.springer.com/article/10.1007/s10333-011-0265-3
[32] Bell, J.C., Cunningham, R.L. and Havens, M.W. (1994) Soil Drainage Class Proba-bility Mapping using a Soil-Landscape Model. Soil Science Society of America Journal, 58, 464-470.https://doi.org/10.2136/sssaj1994.03615995005800020031x
[33] Hammer, R.D., Young, N.C., Wolenhaupt, T.L., Barney, T.L. and Haithcoate, T.W. (1995) Slope Class Maps form Soil Survey and Digital Elevation Models. Soil Science Society of America Journal, 59, 509-519.
https://doi.org/10.2136/sssaj1995.03615995005900020034x
[34] Mora-Vallejo, A., Claessens, L., Stoorvogel, J. and Heuvelink, G.B.M. (2008) Small Scale Digital Soil Mapping in Southeastern Kenya. Catena, 76, 44-53.
https://doi.org/10.1016/j.catena.2008.09.008
[35] Debella-Gilo, M. and Etzelmüller, B. (2009) Spatial Prediction of Soil Classes using Digital Terrain Analysis and Multinomial Logistic Regression Modeling Integrated in GIS: Examples from Vestfold County, Norway. Catena, 77, 8-18.
https://doi.org/10.1016/j.catena.2008.12.001
[36] Hudson, B.D. (1992) The Soil Survey as a Paradigm-Based Science. Soil Science So-ciety of America Journal, 56, 836-841.
https://doi.org/10.2136/sssaj1992.03615995005600030027x
[37] Green, K. (1992) Spatial Imagery and GIS: Integrated Data for Natural Resource Management. Journal of Forestry, 90, 32-36.
DOI: 10.4236/nr.2017.812047 786 Natural Resources
https://doi.org/10.1080/10106048609354060
[39] Moura-Bueno, J.M., Dalmolin, R.S.D., Ten Caten, A., Ruiz, L.F.C., Ramos, P.V. and Dotto, A.C. (2016) Assessment of Digital Elevation Model for Digital Soil Mapping in a Watershed with Gently Undulating Topography.
http://www.scielo.br/scielo.php?script=sci_arttext&pid=S0100-06832016000100304
https://doi.org/10.1590/18069657rbcs20150022
[40] Kempen, B., Brus, D.J. and Stoorvogel, J.J. (2011) Three-Dimensional Mapping of Soil Organic Matter Content using Soil Type-Specific Depth Functions. Geoderma, 162, 107-123.https://doi.org/10.1016/j.geoderma.2011.01.010
[41] Ten Caten, A., Dalmolin, R.S.D., Pedron, F.A. and Mendonça-Santos, M.L. (2012) Spatial Resolution of a Digital Elevation Model Defined by the Wavelet Function. Pesquisa Agropecuária Brasileira, 47, 449-457.
https://doi.org/10.1590/S0100-204X2012000300018
[42] McBratney, A.B., Santos, M.L.M. and Minasny, B. (2003) On Digital Soil Mapping. Geoderma, 117, 3-52.https://doi.org/10.1016/S0016-7061(03)00223-4
[43] Behrens, T., Zhu, A.X., Schmidt, K. and Scholten, T. (2010) Multi-Scale Digital Terrain Analysis and Feature Selection for Digital Soil Mapping. Geoderma, 155, 175-185.https://doi.org/10.1016/j.geoderma.2009.07.010
[44] Gessler, P.E., Moore, I.D., McKenzie, N.J. and Ryan, P.J. (1995) Soil-Landscape Modelling and Spatial Prediction of Soil Attributes. International Journal of Geo-graphical Information Systems, 9, 421-432.
https://doi.org/10.1080/02693799508902047
[45] Brabyn, L. (1997) Classification of Macro Landforms using GIS. ITC Journal, 97, 26-40.
[46] Lagacherie, P., Legros, J.P. and Burrough, P.A. (1995) A Soil Survey Procedure us-ing the Knowledge of Soil Pattern Established on a Previously Mapped Reference Area. Geoderma, 65, 283-301.https://doi.org/10.1016/0016-7061(94)00040-H
[47] Lagacherie, P., Robbez-Masson, J.M., Nguyen-The, N. and Barthes, J.P. (2001) Mapping of Reference Area Representativity using a Mathematical Soilscape Dis-tance. Geoderma, 101, 105-118. https://doi.org/10.1016/S0016-7061(00)00101-4
[48] Lee, K.S., Lee, G.B. and Tyler, E.J. (1988) Thematic Mapper and Digital Elevation Modelling of Soil Characteristics in Hilly Terrain. Soil Science Society of America Journal, 52, 1104-1107.https://doi.org/10.2136/sssaj1988.03615995005200040039x
[49] Stefanov, W.L., Ramsey, M.S. and Christensen, P.R. (2001) Monitoring Urban LC Change: An Expert System Approach to LC Classification of Semiarid to Arid Ur-ban Centers. Remote Sensing of Environment, 77, 173-185.
https://doi.org/10.1016/S0034-4257(01)00204-8
[50] Mohamed, A.M. (2017) Monitoring of Temporal and Spatial Changes of Land Use and Land Cover in Metropolitan Regions through Remote Sensing and GIS. Natural Resources, 8, 353-369.https://doi.org/10.4236/nr.2017.85022
[51] Gerstenberg, J. and Smettan, U. (2015) Erstellung von Karten zur Bewertung der Bodenfunktionen—Umsetzung der im Gutachten von Lahmeyer aufgeführten Ver-fahren in Flächendaten. Senate Department for Urban Development in Berlin, Ber-lin.
http://www.stadtentwicklung.berlin.de/umwelt/umweltatlas/download/gerstenberg2
015.pdf
DOI: 10.4236/nr.2017.812047 787 Natural Resources
[53] Wise, S. (2000) Assessing the Quality for Hydrological Applications of Digital Ele-vation Models Derived from Contours. Hydrological Processes, 14, 1909-1929.
https://doi.org/10.1002/1099-1085(20000815/30)14:11/12<1909::AID-HYP45>3.0.C O;2-6
[54] Mukherjee, S., Joshi, P.K., Mukherjee, S., Ghosh, A., Garg, R.D. and Mukhopad-hyay, A. (2013) Evaluation of Vertical Accuracy of Open Source Digital Elevation Model (DEM). International Journal of Applied Earth Observation and Geoinfor-mation, 21, 205-217.https://doi.org/10.1016/j.jag.2012.09.004
[55] Guth, P.L. (2010) Geomorphometric Comparison of ASTER GDEM and SRTM. A Special Joint Symposium of ISPRS Technical Commission 4 & AutoCarto in Con-junction with ASPRS/CaGIS, Fall Specialty Conference, Department of Oceanogra-phy, US Naval Academy, Orlando.
http://www.asprs.org/a/publications/proceedings/orlando2010/files/Guth.pdf
[56] Jarvis, A., Rubiano, J., Nelson, A., Farrow, A. and Mulligan, M. (2004) Practical Use of SRTM Data in the Tropics—Comparisons with Digital Elevation Models Gener-ated from Cartographic Data. Centro Internacional de Agricultura Tropical (CIAT), Working Document No. 198, Cali.
http://ciat-library.ciat.cgiar.org/articulos_ciat/Jarvis4.pdf
[57] Brixy, I. (1997) Erfassung erosionsgeschädigter Böden in der Lößlandschaft des Querfurter Raumes anhand von Daten des LANDSAT TM. Mitteilungen der Deut-schen Bodenkundlichen Gesellschaft, 83, 395-389.
https://www.dbges.de/de/publikationen/mitteilungen-der-dbg-und-exkursionsfuehr
er
[58] Valeriano, M.M. and Rossetti, D.F. (2012) TOPODATA: Brazilian Full Coverage Refinement of SRTM Data. Applied Geography, 32, 300-309.
https://doi.org/10.1016/j.apgeog.2011.05.004
[59] Calzolari, C., Ongaro, L., Safratti, P. and Maggazzini, P. (1996) Use of Landsat TM and DEM Data in Producing Reconnaissance Scale Soil Maps. In: Richard, E., Mulders, M.A. and Thiombiano, L., Eds., Monitoring Soils in the Environment with
Remote Sensing and GIS, ORSTOM, Paris, 325-340.
http://horizon.documentation.ird.fr/exl-doc/pleins_textes/pleins_textes_6/colloques
2/010008415.pdf
[60] Spiess, E.D., Broschiskl, W.S., Friedrich, K. and Vorderbrügge, T.H. (1998) A Soil Information Database for Spatial Soil Data Integrating Land Use Relief Classifica-tion. In: Heineke, H.J., Eckelmann, W., Thomasson, A.J., Jones, R.J.A., Montanarel-la, L. and Buckley, B., Eds., Land Information Systems: Developments for Planning
the Sustainable Use of Land Resources, Report No. 4, EUR 17729EN, Office for
Official Publications of the European Communities, Luxembourg, 481-499.
http://eusoils.jrc.ec.europa.eu/esbn/Backup_old/docs/1998-rep4/research_report_4.
[61] Friedrich, K. (1999) Die Bodenflächendaten 1:50 000 Hessen Ziele, Aufbau und Er-fahrungen. Mitteilungen der Deutschen Bodenkundlichen Gesellschaft, 91, 977-980.

![Table 1. Relation of relief, substrate and soil type in the investigation area (simplified ac-cording to [51])](https://thumb-us.123doks.com/thumbv2/123dok_us/32668.503214/7.595.203.530.101.738/table-relation-relief-substrate-soil-investigation-simplified-cording.webp)