Satellite images can serve as an information source in the concept of digital soil mapping (DSM). MCBRATNEY et al. (2003) quote that it provides indirect information on a number of scorpan
factors. STEWART and MCBRATNEY (2001) used Landsat 7 for identifying management zones using supervised (maximum likelihood) and unsuper-vised (k-means clustering) classification. Remote sensing is often mentioned as a technology that has a high potential in DSM. Application of the technology is also possibly limited due to the lack of feasible techniques for extracting identified spatial patterns. Object-oriented fuzzy analysis can be applied in this task. ARGIALAS and TZOTSOS (2004) presented, for example, automatic
extrac-tion of alluvial fans from ASTER image and DEM using object-oriented fuzzy analysis.
BENZ et al. (2004) describe some of the principal strategies of the object analysis within the com-mercial software eCognition (Definiens, Germany) and discuss implementation of expert knowledge by means of fuzzy methods applied to segment ob-jects. Segments represent groups of neighbouring pixels that meet certain criteria of homogeneity. NEUBERT and MEINEL (2003) describe and com-pare several segmentation techniques. The expert knowledge is implemented by means of if-then
rules, fuzzy logical operators and membership functions. One of the important problems to be solved is the determination of fuzzy membership
Supported by the Czech Science Foundation, Project No. 526/06/1182.
Object-oriented Fuzzy Analysis of Remote Sensing Data
for Bare Soil Brightness Mapping
LUKÁŠ BRODSKÝ and LUBOŠ BORŮVKA
Department of Soil Science and Geology, Faculty of Agrobiology, Food and Natural
Resources, Czech University of Agriculture in Prague, Prague, Czech Republic
Abstract: Remote sensing data have an important advantage; the data provide spatially exhaustive sampling of the area of interest instead of having samples of tiny fractions. Vegetation cover is, however, one of the appli-cation constraints in soil science. Areas of bare soil can be mapped. These spatially dense data require proper techniques to map identified patterns. The objective of this study was mapping of spatial patterns of bare soil colour brightness in a Landsat 7 satellite image in the study area of Central Bohemia using object-oriented fuzzy analysis. A soil map (1:200 000) was used to associate soil types with the soil brightness in the image. Several approaches to determine membership functions (MF) of the fuzzy rule base were tested. These included a simple manual approach, k-means clustering, a method based on the sample histogram, and one using the probability density function. The method that generally provided the best results for mapping the soil brightness was based on the probability density function with KIA = 0.813. The resulting classification map was finally compared with an existing soil map showing 72.0% agreement of the mapped area. The disagreement of 28.0% was mainly in the areas of Chernozems (69.3%).
functions(MF), especially their internal param-eters. The determination of MF can be categorized as being either manual or automatic.
The objective of the study was the extraction of spatial patterns of bare soil colour brightness using object-oriented fuzzy analysis. MFs were designed to allocate segments of different identified soil brightness classes. Several approaches to deter-mine the internal parameters of MF were tested.
MATERIAL AND METHODS
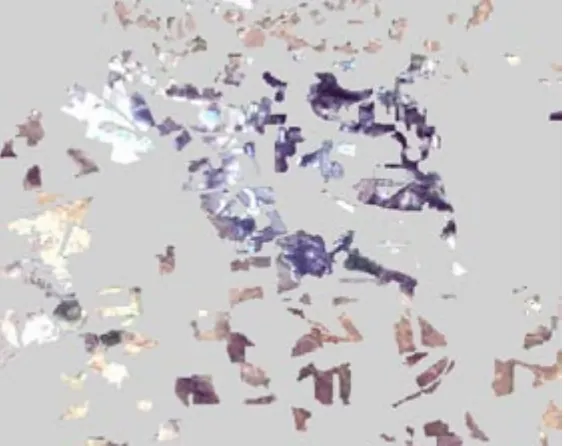
The study area was located in Central Bohemia. A sample of Landsat 7 covering 15.7 × 12.5 km was used (Figure 1). A total area of bare soil cover of 4180 ha was visually interpreted to deliver the vector layer as ancillary data for the classification. Figure 2 shows masked areas of bare soil in the Landsat 7 image. A soil map (1:200 000) was used to associate soil types with soil colours in the image. Object samples (around 30 for each class) were selected as reference data for the determination of the fuzzy rules classification.
Areas of bare soil were segmented by defined homogeneity criteria (scale parameter = 5, shape factor = 0.2, compactness and smoothness = 0.5) using the Region Growing Algorithmin eCogni-tion. The scale parameter is an abstract term which determines the maximum allowed heterogene-ity for the resulting image objects (BAATZ et al. 2004). This parameter indirectly influences the average object size. Simply speaking, the resulting objects for a given scale parameter are larger in homogeneous data than in more heterogeneous data. The shape criterion is a value that describes the improvement of the shape with regard to two different models (smoothness and compactness) describing ideal shapes (BAATZ et al. 2004). The compactness parameter describes heterogeneity as a deviation from the compact shape (the ratio of border length and the square root of the number of pixels forming the object). Similarly, the smooth-ness parameter describes shape heterogeneity as a ratio of border lengthand the shortest possible border length given by the bounding box of an object parallel to the raster (BAATZ et al. 2004). BAATZ and SCHÄPE (2000) note that the human eye is a strong and experienced source for evalu-ation of segmentevalu-ation techniques. Further on, they comment: “No segmentation result – even if quantitatively proofed – will convince, if it does not satisfy the human eye.“
A lower value of the shape factor (0.2) was set as the goal to create segments of naturally varying soil colour related to spectral signatures. Similarly, there were no preferences to adjusting compact-ness or smoothcompact-ness of the segments. The scale parameter was tested on a range of values from 3 to 30 and evaluated by qualitative criteria, a visual check, in the area of higher soil colour spatial heterogeneity. The value of 5 provided satisfac-tory segmentation of the image. An alternative approach to setting the scale parameter could be the geostatistic-based segmentation proposed by CHEN et al. (2003). However, this approach needs further elaboration.
Three levels of soil brightness were mapped on the segments. Brightness is calculated as a sum of the mean values of the layers containing spectral information divided by their quantity computed for an image object (BAATZ et al. 2004).
Definition of brightness classes
B1: bright light (Cambisols, rendzic Leptosols, Regosols)
B2: intermediate dark (greyic Phaeozems, haplic Luvisols, Fluvisols)
B3: dark (Chernozems, Phaeozems)
A classification hierarchy for mapping of the three defined brightness classes of bare soil areas was designed. The important task is to determine membership functions of the corresponding fuzzy rules in the hierarchy. Initially, manual determina-tion of MFs by testing brightness signature values was applied (method A). Then other approaches were analysed. A statistical unsupervised approach using the k-means clustering technique (MINASNY & MCBRATNEY 2000) was applied. Calculated membership values of the classes were used to construct MFs (method B). Another approach, based on the sample histogram, was tested. MF is determined automatically as an “envelope” over the sample histogram (method C). Parameters of side and height extrapolation rates can be set. Determination of MF can also be based on the probability density function (method D). Before this approach was analysed the Gaussian normal distribution was tested by a χ2 test.
OA is the proportion of all reference pixels/seg-ments classified correctly. KIA is Cohen’s kappa coefficient, which takes into account chance agree-ment (BAATZ et al. 2004).
RESULTS
(A) The manual determination of MFs was ap-plied as the very common approach. Good results can be obtained in easy cases but that requires
considerable iterative efforts. However, it brings good insight into the problem to be solved.
[image:3.595.67.428.85.372.2](B) K-means clustering technique was applied as an example of the statistical unsupervised ap-proach. The resulting MFs of the classes are shown in Figure 3. DN in the figure stands for digital number. Larger than, approximate Gaussian and smaller than MFs were applied. Determined over-laps are small and the slope of MFs between the classes is high. One could consider this a nearly
Figure 2. True colour Landsat 7 image – mas-ked bare soil areas
[image:3.595.64.346.532.755.2]crisp classifier. Considerable shift in the MFs was found in comparison to other methods (compar-ing methods B and C/D) as the knowledge about the soils was not included in the determination of MFs. Consequently, there were more B3 segments classified and considerably fewer B1 classes.
(C) Another approach, based on the sample his-togram, was tested with the resulting MFs shown in Figure 4. Classification resulted in an omission of a few B1 and B3 segments, those with extreme values. Increases in the side extrapolation param-eter resulted in large overlaps of B1 and B3 classes over the medium B2 class. This caused unstable classification. Such an automatic approach is easy, but strongly relies on selected sample objects.
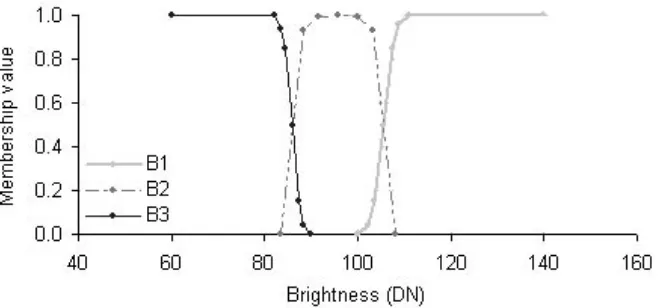
(D) Determination of MF based on the probability density function (pdf) was finally analysed. Gaus-sian normal distribution was tested by a χ2 test
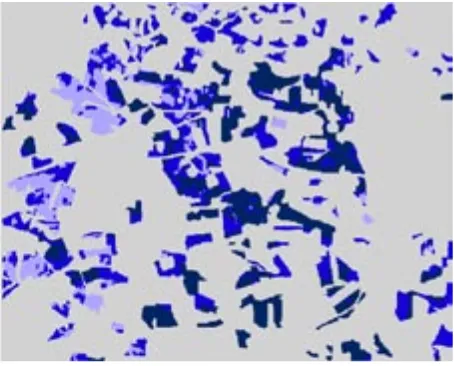
with results of P values: B1 0.0071, B2 0.0001 and B3 0.051. Figure 5 shows the results of MFs ap-proximation by pdf. The S-shape for B1 class was used to assure classification of all objects. Figure 6 shows the resulting map of the soil brightness. Similarly, a map of membership values of all the three classes B1, B2 and B3 could be shown. This
approach provided stable classification. Possible higher asymmetry in the sample sets may play a negative role.
Classification accuracy assessment
[image:4.595.67.403.85.239.2]Table 1 shows the results of the accuracy measures (OA and KIA) for the four methods. According to the statistical parameters, the approach based on the sample histogram (OA = 96.9% and KIA = 95.3% agreement) seems to be the best, however, this method failed to classify all objects. The method based on the pdf (OA = 87.8% and KIA = 81.3% agreement) resulted in a classification of all segments
Table 1. Classification evaluation for different MF deter-mination approaches
MF determination/accuracy OA KIA (A) Manual 0.653 0.473 (B) K-means clustering 0.633 0.437 (C) Histogram based 0.969 0.953 (D) Probability density function 0.878 0.813
Figure 4. Automatically de-termined MFs of brightness classes based on sample his-togram
[image:4.595.305.531.492.579.2] [image:4.595.62.529.594.761.2]from the test area. This approach was considered to provide generally the best results in this study.
The classification result (approach D) of the brightness classes was further compared with the soil map in a GIS. The classification agree-ment was 72.0% of the bare soil mapped area. The disagreement of 28.0% was mainly in the areas of Chernozems (69.3%).
DISCUSSION
Several approaches to MF determination were tested. The manual method is the common ap-proach widely used within eCognition software but is not effective and often does not bring sat-isfactory results. Setting internal parameters of MF is subjective work that strongly relies on ex-perience. Alternatively, clustering method can be easily automated but this approach omits expert knowledge of the phenomena and leads to a po-tentially different result that has only a statistical or mathematical explanation. Other methods that are based on either the sample histogram or prob-ability density function of a representative sample set can be automated and also respect the expert knowledge. The approach using the histogram
Figure 5. Resulting pdf of the brightness classes and corre-sponding determined MFs
respects the possible asymmetry in the sample distribution, which determines the shape of MF. The risk of omitting part of the potential feature space of existing objects can be partly reduced by defining the rate of side and height extrapolation. Although, when the classes are very close to each other in the feature space, it leads to overlaps that cause instability in the model. The last approach based on the probability density function presumes normal distribution of the sample set and leads to a symmetric definition of approximated bell-shaped MF. The determination of MF is controlled by two parameters, mean and variance. Good results can be obtained, if the classes inherit normal distribu-tion without significant asymmetry. This condi-tion possibly prevents the approach from wider application, especially in more complex situations. Further research in the determination of MF and optimisation of its internal parameters will be focused on testing Artificial Neural Networks or other soft computing techniques.
CONCLUSIONS
[image:5.595.68.399.79.408.2]of bare soil cover from satellite images. The high classification agreement proved the potential of satellite images in digital soil mapping. Result-ing soil brightness maps can be used as ancillary data either in preparation of soil surveys or as an input to prediction models (e.g. scorpan). The object-oriented fuzzy approach can be general-ized and further applied in DSM in other ways. Soil property data layers can be used to map soils instead of spectral layers. Raster and vector data can also be combined.
Acknowledgment. The authors are grateful to FILIP HAJEK who helped with technical solutions in eCognition.
References
ARGIALAS D., TZOTSOS A. (2004): Automatic extraction of alluvial fans from ASTER satellite data and a digital elevation model using object-oriented image analysis. In: Proc. ISRPS 2004 Annual Conf., July 19–23, Istanbul. BAATZ M., SCHÄPE A. (2000): Multiresolution segmenta-tion – an optimizasegmenta-tion approach for high quality multi- scale image segmentation. In: STROBL J., BLASCHKE T., GREISEBENER G. (eds): Angewandte Geographische Informationsverarbeitung XI. Beiträge zum AGIT-Symposium Salzburg 1999. Herbert Wichmann Verlag, Karlsruhe, 12–23.
BAATZ M., BENTZ U., DEHGHANI S., HEYNEN M. et al.
(2004): eCognition User Guide 4. Definiens Imaging, Muenchen.
BENZ U., HOFMANN P., WILLHAUCK G., LINGENFELDER I., HEYNEN M. (2004): Multi-resolution, object-oriented fuzzy analysis of remote sensing data for GIS-ready information. ISPRS Journal of Photogrammetry & Remote Sensing, 58: 239–258.
CHEN Q., LUO J., ZHOU C. (2003): A geostatistic based segmentation approach for remotely sensed images. In: Proc. 24th Asian Conf. Remote Sensing. Busan.
MCBRATNEY A.B., MENDONCA SANTOS M.L., MINASNY B. (2003): On digital soil mapping. Geoderma, 117: 3–5. MINASNY B., MCBRATNEY A.B. (2000): FuzME Version
2.0. Australian Centre for Precision Agriculture. NSW 2006, The University of Sydney, Sydney.
NEUBERT M., MEINEL G. (2003): Evaluation of segmen-tation programs for high resolution remote sensing applications. In: Proc. ISPRS Joint Workshop High Resolution Mapping from Space 2003, October 6–8, Hannover.
STEWART C.M., MCBRATNEY A.B. (2001): Using bare soil imagery to determine management zones for the variable-rate application of inputs for cotton. In: 3rd
European Conf. Precision Agriculture, Montpellier, 319–324.
Received for publication May 22, 2006 Accepted after corrections June 14, 2006
Corresponding author:
[image:6.595.64.291.84.267.2]Ing. LUKÁŠ BRODSKÝ, Ph.D., Česká zemědělská univerzita v Praze, Fakulta agrobiologie, potravinových a přírodních zdrojů, katedra pedologie a geologie, Kamýcká 129, 165 21 Praha 6-Suchdol, Česká republika tel.: + 420 224 382 631, fax: + 420 234 381 836, e-mail: [email protected]