ORIGINAL RESEARCH
FUNCTIONAL
Functional Homotopic Changes in Multiple Sclerosis with
Resting-State Functional MR Imaging
Y. Zhou, M. Milham, X.-N. Zuo, C. Kelly, H. Jaggi, J. Herbert, R.I. Grossman, and Y. Ge
ABSTRACT
BACKGROUND AND PURPOSE: CC is extensively involved in MS with interhemispheric dysfunction. The purpose of this study was to determine whether interhemispheric correlation is altered in MS by use of a recently developed RS-fMRI homotopy technique and whether these homotopic changes correlate with CC pathology.
MATERIALS AND METHODS: Twenty-four patients with relapsing-remitting MS and 24 age-matched healthy volunteers were studied with RS-fMRI and DTI acquired at 3T. The Pearson correlation of each pair of symmetric interhemispheric voxels of RS-fMRI time-series data was performed to compute VMHC, and z-transformed for subsequent group-level analysis. In addition, 5 CC segments in the midsagittal area and DTI-derived FA were measured to quantify interhemispheric microstructural changes and correlate with global and regional VMHC in MS.
RESULTS:Relative to control participants, patients with MS exhibited an abnormal homotopic pattern with decreased VMHC in the primary visual, somatosensory, and motor cortices and increased VMHC in several regions associated with sensory processing and motor control including the insula, thalamus, pallidum, and cerebellum. The global VMHC correlates moderately with the average FA of the entire CC for all participants in both groups (r⫽0.3;P⫽.03).
CONCLUSIONS: Our data provide preliminary evidence of the potential usefulness of VMHC analyses for the detection of abnormalities of interhemispheric coordination in MS. We demonstrated that the whole-brain homotopic RS-fMRI pattern was altered in patients with MS, which was partially associated with the underlying structural degenerative changes of CC measured with FA.
ABBREVIATIONS:CC⫽corpus callosum; CST⫽cortical spinal tract; FA⫽fractional anisotropy; RSFC⫽resting-state functional connectivity; RS-fMRI⫽ resting-state functional MRI; VMHC⫽voxel-mirrored homotopic correlation
B
rain homotopy describes a fundamental characteristic of the in-trinsic functional architecture of the brain. Namely, it demon-strates that homologous regions in 2 hemispheres are geometrically and functionally corresponding to each other. Recently, such a high degree of interhemispheric synchrony can be estimated based onspontaneous neuronal activity by use of RS-fMRI.1,2By measuring
bilateral regional RSFC, Stark et al1showed a gradual distribution of
interhemispheric functional correlation, with the highest found in primary sensorimotor cortices among ubiquitous brain homotopic regions and lower correlations found in the heteromodal association areas that are related to high-order functional lateralization. More recently, Zuo et al2further extended the regional computation to a
whole-brain voxel-based correlation map and showed marked and regionally specific age-related (ie, developmental and aging) changes in functional homotopy. Specifically, primary sensorimotor regions tended to show increasing homotopic RSFC, whereas higher-order processing regions showed decreasing interhemispheric connectivity with age. These studies provided robust evidence that brain homo-topy can be reliably mapped with RS-fMRI– derived functional con-nectivity analysis. Although interhemispheric functional integration plays an important role in communicating perceptual, cognitive, learned, and volitional information, detailed clinical data on neuro-degenerative and psychiatric disorders regarding brain functional homotopy are still very limited to date.3,4
Received June 6, 2012; accepted after revision August 17.
From the Radiology/Center for Biomedical Imaging (Y.Z., H.J., J.H., R.I.G., Y.G.) and New York University Child Study Center (M.M., X.-N.Z., C.K.), New York University School of Medicine, New York, New York; and Laboratory for Functional Connec-tome and Development (X.-N.Z.), Key Laboratory of Behavioral Science, Magnetic Resonance Imaging Research Center, Institute of Psychology, Chinese Academy of Sciences, Beijing, China.
Paper previously presented at: Annual Meeting of the American Society of Neuro-radiology, June 4 –9, 2011; Seattle, Washington.
This study was supported by the National Institutes of Health (grant R01NS029029) and the Natural Science Foundation of China (grant 81171409).
Please address correspondence to Yulin Ge, MD, Center for Biomedical Imaging, Department of Radiology, New York University School of Medicine, 660 First Ave, 4th
floor, New York, NY 10016; E-mail: [email protected] Indicates open access to non-subscribers at www.ajnr.org
MS is a white matter disease with diffuse neuronal degenera-tion. One of the remarkable histopathologic features of MS is its preferential and extensive involvement in the CC with demyeli-nating lesions often seen within callosal or subcallosal areas.5-7
The CC is the largest white-matter tract widely connecting bilat-eral neocortical areas and is the primary means of communication between the 2 hemispheres,8making it a key structure in bilateral
cortical-cortical functional activities.9According to the known
histologic pattern of the CC, through-CC cortical presentations (homotopic stimulations) yielded faster reaction times than het-erotopic stimulations.10Given extensive axonal degeneration and
atrophy within the CC in MS, structural connectivity–related ho-motopy changes are likely. DTI has been particularly useful in determining the microstructural axonal degeneration in white matter tracts such as the CC by use of quantitative scalar indices such as mean diffusivity and FA.11With use of fiber tractography
obtained from DTI datasets, topographic distribution of fiber connections to the cortex through midsagittal cross-sections of the CC can be obtained by characterizing its directionality and connectivity in relationship to its cortical terminals.12Using
RS-fMRI and DTI, several studies investigating the interhemispheric functional interactions of sensorimotor cortices in MS provided conflicting results: Lowe et al13showed decreased functional
con-nectivity, whereas Rocca et al14found increased interhemispheric
strengths of coefficients of effective connectivity. These studies, however, all focused on a specific sensoriomotor functional path-way; therefore, investigation of the changes of global transcallosal (ie, entire CC) structural and functional connectivity (ie, VMHC) is warranted to better understand the interhemispheric coordina-tion deficits in MS.
We hypothesize that the decrements in the integrity of the CC in MS may affect the interhemispheric functional connecting properties or interactions (homotopy), which can be measured by VMHC, a recently developed voxelwise RSFC whole-brain anal-ysis.2Although the VMHC method is derived from RS-fMRI data,
it provides unique information of functional homotopy between 2 hemispheres on the basis of voxelwise analysis; therefore, it is useful to detect interhemispheric coordination impairment in neurologic diseases (eg, MS).
The purpose of this study was to examine the interhemispheric synchronous changes of the brain by using RS-fMRI VMHC in patients with MS compared with healthy control participants. We also investigated the correlations of functional homotopic changes and microstructural changes of the CC by using DTI. In particular, we examined transcallosal and nontranscallosal corti-cal homotopic differences and changes, as well as their relation-ship with lesion load and Expanded Disability Status Scale score in patients with MS.
MATERIALS AND METHODS
Patients
Twenty-four patients with clinically definite relapsing-remitting MS (mean age, 38.25⫾SD 9.23 years; 18 women and 6 men) and 24 age-matched healthy volunteers (mean age, 38.46⫾SD 10.52 years; 10 women and 14 men) were recruited. None of the patients with MS had any evidence of or prior diagnosis of cardiovascular morbidity, cerebrovascular disease, or other neurologic diseases.
All patients displayed a characteristic phenotype that included but was not limited to visual disturbances (eg, diplopia), paresthesias, ataxia, dysphagia, fatigue, and nonspecific disabling arthralgias. The patients had a varied degree of previous symptoms with an average Expanded Disability Status Scale score of 2.47 (range, 0 – 6). The average disease duration for the patient group was 5.12 years (range, 0.67–14 years). The institutional review board ap-proved this study. All participants gave informed consent after the nature of the procedure had been fully explained.
MR Imaging
RS-fMRI was performed on a 3T whole-body MR scanner (Mag-netom Tim Trio; Siemens, Erlangen, Germany) by use of a 12-channel head coil with a gradient-echo echo-planar imaging se-quence (TR, 2 s; TE, 30 ms; flip angle, 75°; field of view, 220⫻220 mm2; and acquisition matrix size, 128⫻128 [153 volumes total]).
A total of 20 sections were collected parallel to a line passing through the anterior/posterior commissure with 5-mm section thickness and 1-mm gap and positioned to cover the entire cere-brum. In addition, sagittal magnetization-prepared rapid acqui-sition of gradient echo scans were also performed to acquire high-resolution 3D anatomic images (TR, 2300 ms; TE, 2.98 ms; TI, 900 ms; flip angle, 9°; resolution, 1⫻1⫻1 mm3). DTI data with 3
b-values (0, 500, and 1000 s/mm2) and 30 standard directions
(spatial resolution of 1.32⫻1.32⫻4 mm3) with similar coverage
space as the fMRI and parallel acquisition direction were also obtained. Conventional imaging, including T2-weighted fast spin-echo and fluid-attenuated inversion recovery images (TR, 9200 ms; TE, 82 ms; TI, 2500 ms; flip angle, 150°; resolution, 0.86⫻0.86⫻3 mm3), was also obtained for lesion load
quanti-fication. Gadolinium-enhanced T1-weighted imaging (TR, 354 ms; TE, 2.73 ms; flip angle, 56°; resolution, 0.3⫻0.3⫻3 mm3)
was performed to detect any enhancing active plaques in patients with MS.
Image Processing and Data Analysis
Anatomic 3D-magnetization-prepared rapid acquisition of gradi-ent echo and functional imaging data were preprocessed by both FSL (http://www.fmrib.ox.ac.uk/fsl) and AFNI (http://afni. nimh.nih.gov/afni/) (scripts containing the processing proce-dures are available via the 1000 Functional Connectome Project: http://fcon_1000.projects.nitrc.org). Preprocessing steps in-cluded spatial smoothing with a full width at half maximum of 6 mm, band pass temporal filtering of 0.005– 0.1 Hz to remove physiologic noise contamination,15removal of nuisance signals
with regression model (motion parameters, the global signal, and signals derived from CSF and white matter), and transformation to Montreal Neurological Institute 152 standard space (2⫻2⫻2 mm3) with the nonlinear optimization warping algorithm called
FMRIB’s Nonlinear Image Registration Tool (FNIRT; http://fs-l.fmrib.ox.ac.uk/fsl/fslwiki/FNIRT). In our study, we have evalu-ated physiologic noise by using temporal independent compo-nent analysis in each group with a standard FSL-MELODIC algorithm (http://www.fmrib.ox.ac.uk/fsl/melodic/index.html). We found that the physiologic noise pattern was typical16(eg,
in the 2 groups; therefore, the bandpass filtering (0.005– 0.1 Hz) applied in this study can effectively remove these noises. In addi-tion, we used an unbiased physiologic noise template17and dual
regression model to map the noise pattern in each group and found no significant spatial distribution differences between these 2 groups. This finding suggests that the possible altered auto-nomic functions in MS do not contribute to the physiologic noise in this patient group and are unlikely to influence the homotopic analysis in this study.
For correction of motion artifacts, a head movement-con-straint headphone and cushion were used to prevent movement during the scan, and all participants were well-instructed to keep still during the RS-fMRI scan. Using AFNI motion correction algorithms, we performed more realignment steps with 3 an-gular rotation (roll, pitch, and yaw in the units of degrees) and 3 directional displacements (unit: millimeters) to further min-imize the motion artifacts. After these correction steps, no sta-tistical differences (P ⫽.53) of average frame displacement (sum of all motion parameters)18were observed between the
MS group (0.163⫾0.064 mm) and the control group (0.149⫾ 0.083 mm).
VMHC, the Pearson correlation between the preprocessed time-series of each pair of symmetric interhemispheric voxels, was computed according to the procedures outlined in our previ-ous study.2The resultant values were z-transformed (by use of the
Fisher r-to-z transform) and were used for subsequent group-level analysis. We used a 2-sample Student t test to compare VMHC between the patient group and the healthy control group. The participant’s age and sex were used as covariants for compar-ison to derive the results. Multiple comparcompar-ison corrections at the cluster level were performed to the whole brain based on Gaussian random field theory by the FSL easythresh command (minimum Z⬎2.3; cluster significance,P⬍.05, corrected).
The global VMHC score for each participant was obtained by the average of the VMHC z-images of each participant within the 25% gray matter mask from the FSL template for further quanti-fication. Regional VMHC values were obtained based on the 50% and 112 total parcellation masks of the left and right hemispheric regions,1with in-house developed scripts according to FSL and
Matlab software (MathWorks, Natick, Massachusetts). These brain regions are further classified into 3 functional hierarchic subdivisions,19namely primary sensory-motor, unimodal
associ-ation, and heteromodal association areas. Then average values of each hierarchy can be quantified as described by Stark et al1to
compare between 2 groups. The primary motor and sensory cor-tices are engaged directly with the environment including the postcentral gyrus (somatosensory), intracalcarine cortex and oc-cipital pole (visual), Heschl gyrus (auditory), and precentral gyrus (motor). Unimodal association areas are those regions adjacent to the primary sensory-motor cortices involved in integration of in-formation from predominantly 1 sensory or motor technique (eg, supramarginal gyrus, occipital fusiform gyrus). The heteromodal association areas, located primarily in the prefrontal and tem-poroparietal cortices, integrate information from multiple sen-sory and motor modalities.
For CC volumetry, a midsagittal CC skeleton was delineated in the middle sagittal section after reorientation of 3D
magnetiza-tion-prepared rapid acquisition of gradient echo images to the anterior/posterior commissure coordinate system by use of MEDx software (www.medicalnumerics.com), and the CC area was derived. For CC FA quantification, the FSL tract-based spatial statistics toolbox20steps 1–2 was used for registration of
all participants’ FA into the FSL template. The FA data were transformed to the FSL Montreal Neurological Institute (1-mm isotropic resolution) common space by use of the non-linear registration tool FNIRT based on a b-spline representa-tion of the registrarepresenta-tion warp field. Whole CC was obtained from the FSL Ju¨lich atlas (http://fsl.fmrib.ox.ac.uk/fsl/fsl4.0/ fslview/atlas-descriptions.html#jul). Segmentation of the CC into 5 segments was done in MEDx in the template space ac-cording to the calculated proportional distance21in the sagittal
view and was translated to the axial view. Average FA of the CC was performed to quantify structural properties of the CC and to correlate with global or regional mean VMHC values (Pear-son correlation). In addition, Spearman rank correlations were performed between Expanded Disability Status Scale and FA or global VMHC measurements.
Using high-resolution 30-direction DTI data, we performed seed-based fiber tractography by using Diffusion Toolkit (http:// www.nitrc.org/projects/trackvis), with an advanced tensorline propagation algorithm and standard threshold setting (eg, 35-degree angle threshold for tensor propagations). The tensorline algorithm can incorporate both the anisotropic classification of the local tensor and the nearby fiber orientation information into the tracking algorithm; therefore, it is more robust and reproduc-ible in regions that are either noisy or have crossing fibers.22,23To
evaluate the relationship between the interhemispheric and intra-hemispheric structural and functional connectivity of cortical motor regions, a 4.5-mm radius sphere was placed as a seed in the posterior motor triangle area to delineate both transcallosal (in-terhemispheric) and nontranscallosal CST (intrahemispheric) motor fibers. Homotopic values were obtained from the termi-nals of either the CC-connected fibers (mainly in the cortical mo-tor regions) or CST projections (mainly in the premomo-tor regions) to compare the VMHC differences of the homotopic vs hetero-topic regions.
RESULTS
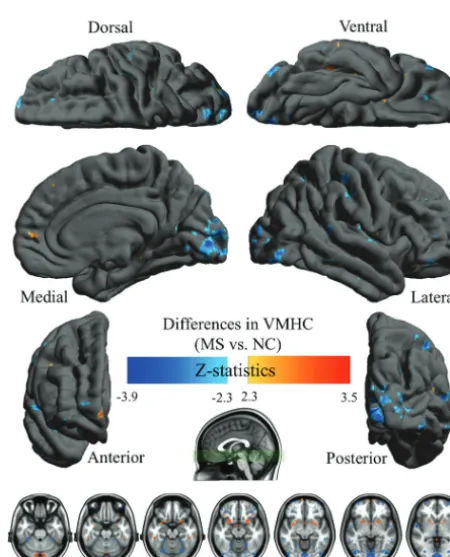
In healthy control participants, several primary cortical regions including the visual, motor, and somatosensory cortices showed the strongest VMHC, whereas the prefrontal and temporopari-etal-associated cortices and the paracingulate areas demonstrated relatively weaker VMHC. The dorsolateral and ventrolateral por-tions in particular, which are known for characteristic lateraliza-tion of funclateraliza-tion related to language, attenlateraliza-tion, and cognitive con-trol (Fig 1A), exhibited this weakness.
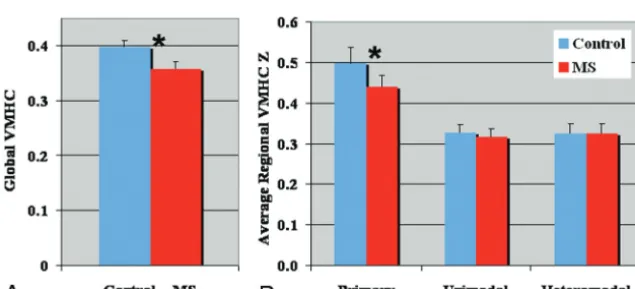
In patients with MS, no enhancing lesion was observed on gadolinium-enhanced T1-weighted imaging. These patients ex-hibited an altered global VMHC pattern compared with control participants. Specifically, there was decreased VMHC within many higher-order cognitive regions, including the frontal, tem-poral, and occipital lobes (Fig 1B), in patients compared with control participants (correctedP⬍.05)(Fig 2). There was also increased VMHC in the anterior insular, thalamus, striatum, cer-ebellum, and inferior temporal regions in patients compared with control participants (Fig 2), and these regions are mainly associ-ated with sensory processing and motor control. A detailed com-parison of VMHC in different regions between the 2 groups is shown in Tables 1 and 2. Overall, there was a decreased global VMHC in the MS group compared with that in the control group (P⫽.04) (Fig 3A), indicating a deficit of whole-brain spheric synchronization in the patients. Regional interhemi-spheric VMHC analysis found the highest values in the visual cortex followed by the somatosensory, auditory, and motor areas in both the MS group and the control group. There was also sig-nificant reduction of VMHC in the visual, somatosensory, and motor (subregions) cortices (P⫽.04) in the patient group. In addition, VMHC showed significantly higher homotopic connec-tivity in the primary cortices compared with unimodal and het-eromodal regions in both the MS group and the control group,
and a significant decrease of VMHC was only found in the primary cortices in the MS group compared with the control group (Fig 3B).
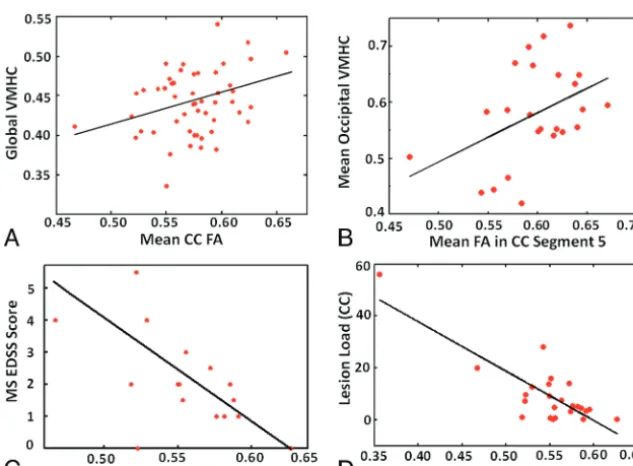
We also observed the reduction of the midsagittal area of the CC (P⫽.026) (Fig 4A) and FA of the entire CC (P⫽.0018) (Fig 4B) in patients compared with con-trol particpants. The global VMHC corre-lates moderately with the average FA of the entire CC for all participants in both groups (r⫽0.3;P⫽.03) (Fig 5A), how-ever, without statistical significance in each separate group. In addition, we found decreased FA in each of the 5 CC segments (Pⱕ.02), indicating a change in whole-brain CC integrity in patients compared with control participants. In the MS group, a significant positive corre-lation was also found between average VMHC in the occipital regions and aver-age FA values of CC segment 5 corre-sponding to occipital projections (r ⫽ 0.43;P⫽.037) (Fig 5B). There was a sig-nificant negative correlation between patients’ Expanded Disabil-ity Status Scale score and the average FA of the CC (r⫽ ⫺0.61; P⫽.013) (Fig 5C). The average FA of the CC also significantly correlated negatively with patients’ lesion load (r⫽ ⫺0.92;P⬍
FIG 1. Whole-brain voxelwise homotopic RSFC pattern by use of multiple linear regression models in control (A) and MS (B) groups. Homotopic RSFC was computed within 1 hemisphere (left side) for each pair of homotopic voxels and corrected by the Gaussian random field theory (minimumZ⬎2.3; cluster level,P⬍.05, corrected). The final statistical maps are visualized as 6 hemispheric surfaces (cortical regions) with 6-mm full width at half maximum and multiple axial images (subcortical regions). Compared with control participants, patients demonstrated de-creased VMHC in several cortical regions (long arrows) including the frontal, temporal, and occipital lobes and increased VMHC mainly in the subcortical regions (short arrows).
[image:4.594.56.369.48.243.2] [image:4.594.303.528.389.668.2].0001) (Fig 5D). No significant correlation was found between global homotopic VMHC changes and Expanded Disability Sta-tus Scale or lesion load.
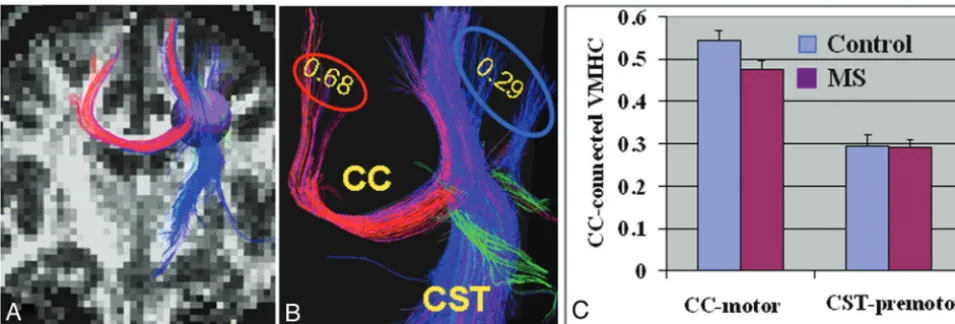
The homotopic degree of VMHC of the motor cortex con-nected with either transcallosal CC fibers (ie, interhemispheric) or nontranscallosal lateral CST (intrahemispheric), according to fiber tractography seeding with a spheric region of interest near the CC body, was evaluated. Higher VMHC was observed in the cortical motor regions with direct transcallosal vs nontranscal-losal fiber connection (0.68 vs 0.29, respectively) (Fig 6A, B). The
statistical comparison of transcallosal VMHC and nontranscal-losal VMHC showed a significant difference between the 2 termi-nal regions connected with transcallosal and nontranscallosal fi-bers in each group (P⬍.001), and a lower value was found in nontranscallosal regions. In addition, there was significantly re-duced VMHC in the transcallosal motor regions (P⫽.03), but not in the nontranscallosal (ie, CST) regions (P⫽.09), in patients compared with control participants (Fig 6C).
DISCUSSION
The results of our study showed significant changes of functional interhemispheric correlation measured with VMHC in patients with MS, which may have important clinical implications such as disturbances of visual, sensory, and motor coordination as well as various cognitive deficits (eg, information processing speed, at-tention, coherent volition, etc), in these patients. The regions hav-ing the largest reductions of VMHC were observed in the middle and lateral parts of the occipital lobe, which consist mainly of the primary visual cortex, but also include the primary somatosen-sory cortex and areas in the temporal and frontal lobes. Dysfunc-tion of these regions is responsible for the sensory, movement, or memory deficits in patients with MS. In addition, our analysis of the relationship between homotopic changes and CC microstruc-tural FA changes suggests that, as callosal degeneration increases, the functional homotopy decreases, which may be indicative of inefficient callosal transmission in patients. Our data also support the concept that increased functional coupling between the hemi-spheres can emerge in the presence of callosal pathologic features with disruption of anatomic connectivity.24
Despite the potential importance of assessing the deficits of interhemispheric coordination in MS, no detailed study of imag-ing global functional homotopy has been performed. The VMHC we used quantifies the global RSFC between each voxel in 1 hemi-sphere and its mirrored counterpart in the other. The pattern of VMHC in the healthy control participants from our study is con-sistent with recently published studies showing highest symmetric synchronization in the occipital and somatosensory cortices and in many midline brain structures including the striatum, cingu-late, and thalamus.2,4In MS, by using a
voxel-based RSFC approach to analyze synchrony in spontaneous activity be-tween the geometrically corresponding interhemispheric regions, we found sig-nificantly reduced VMHC in areas of the occipital, frontal, and temporal lobes in patients compared with control partici-pants. Our functional hierarchic analysis showed that homotopic deficits mainly involved the primary visual and somato-sensory cortices in patients with MS,1
which are consistent with these typical clinical manifestations that are often seen in this disease. However, the unimodal and heteromodal regions, which usually have a relatively lower degree of inter-hemispheric correlations as found in our current and previous study,1showed no FIG 3. Comparison results of global (A) and regional (B) VMHC differences between patients
[image:5.594.54.285.65.189.2]with MS and healthy control participants. There was significantly reduced global VMHC in patients compared with control participants (P⫽.04) (A). Regional analysis showed significantly higher interhemispheric correlation in the primary cortical regions (ie, visual, somatosensory, motor, and auditory cortices) compared with unimodal and heteromodal regions (B) in both groups. Significantly lower VMHC was found only in the primary cortex in patients compared with control participants (P⬍.05). Error bars denote standard error in each group.
Table 1: Brain regions showing decreased VMHC in patients with MS vs control participants
Brain Region BA
X,Y,Z,MNI (mm)
Cluster Size
MaximalZ Score Visual (calcarine) 17 ⫺10,⫺94, ⫺2 905 3.83 Primary somatosensory 1 ⫺50,⫺16, 46 286 3.8 Lateral occipital 19 ⫺34,⫺74, ⫺4 163 3.58
Middle temporal 22 ⫺66,⫺46, 8 129 4.07
Frontal pole 11 ⫺36, 64, ⫺6 126 3.52
Superior temporal 48 ⫺54, ⫺4, ⫺2 93 3.88 Inferior occipital 18 ⫺24,⫺70,⫺16 65 3.41
Middle occipital 37 ⫺38,⫺42,⫺28 64 3.06
Fusiform 37 ⫺22,⫺54,⫺14 59 3.35
Cuneus 19 ⫺12,⫺82, 34 57 3.68
[image:5.594.54.284.257.331.2]Note:—Only the right side is listed because of symmetric computation between the hemispheres,P-values were obtained with cluster-level multiple comparison correc-tion (correctedP⬍.05; cluster size⬎20); BA indicates Brodmann area; MNI, Montreal Neurological Institute.
Table 2: Brain regions showing increased VMHC in patients with MS vs control participants
Brain Region BA
X,Y,Z,MNI (mm)
Cluster Size
MaximalZ Score Orbital frontal/insular 48 ⫺26,⫺12,⫺14 160 3.45
Thalamus ⫺ ⫺2,⫺24, 12 40 3.16
Cerebellum ⫺ ⫺10,⫺82,⫺26 40 3.44
Pallidum ⫺ ⫺10, 4,⫺4 23 3.19
[image:5.594.54.372.516.660.2]significant difference of VMHC between patients and control participants.
Our current study also demonstrated increased VMHC in the subcortical areas, including the thalamus, insula, pallidum, and cerebellum, in patients compared with control participants, de-spite the reduction of overall global VMHC. Many of these in-creased regions are connected via the subcortical connections (eg, thalamus projections) or other interhemispheric connections, (eg, anterior/posterior commissure for inferior temporal connec-tions or CSTs). These noncallosal interhemispheric homotopic increases are assumed to compensate for the decreased interhemi-spheric coordination when transcallosal function is impaired in patients with MS. The disruption of the transcallosal inhibitory
mechanism could also lead to greater ac-tivation in these regions in MS.25
Although our global analysis showed that structural connectivity measured by FA of the entire CC correlates with global interhemispheric homotopy in all partic-ipants, we did not find the significant cor-relation in the patients alone. This is con-sistent with the findings of Lowe et al,13
who reported increased FA with increased functional connectivity in all participants but not in the patient group. This was likely because the decreased functional connectivity can be accompanied by com-pensatory increased connectivity, as found in this study, and our global mea-sure may not be specific enough to exhibit a high correlation with a limited number of patients. To date, a limited number of studies have tried to correlate interhemi-spheric structural and functional connec-tivity, and it is still unclear to what degree they may be related in healthy and dis-eased conditions. Johnston et al26
pre-sented a striking loss of interhemispheric functional connectivity with preserved intrahemispheric correlations in a 6-year-old child after complete CC section for the treatment of intractable epilepsy. However, several studies24,27showed
pre-served interhemispheric functional con-nectivity in cases of agenesis of the CC. The different results reported from the above studies may thus arise from several factors: 1) compensatory functional reor-ganization28 ensues in both subcortical
and cortical synchronization in the ab-sence of a CC, 2) not all regions require direct structural connectivity for normal functional coherence, and 3) structural connectivity only partially shapes func-tional connectivity for funcfunc-tional com-pensation in a slow and evolutionary fashion.
In our study, we chose 2 neighboring interhemispheric pri-mary motor regions to further study homotopic vs heterotopic correlations and to evaluate a specific functional pathway that is connected either with transcallosal (homotopic) or nontranscal-losal (heterotopic or intrahemispheric) fiber tracts on the basis of DTI tractography. We found that VMHC is significantly higher in homotopic regions (with transcallosal connection) vs heterotopic regions (without transcallosal connection), indicating that base-line (resting-state) bilateral cortical coactivation is higher in ho-motopic regions. However, such structural-function relation-ships may have varying levels of interdependence across regions and may also depend on different functional pathways. In a study of language networks, Morgan et al29showed no correlations be-FIG 4. Structural differences measured with midsagittal CC area (A) and the FA of the entire CC
(B) between patients with MS and control participants showed a significantly reduced midsag-ittal CC area (P⫽.026) and FA (P⫽.0018) in patients compared with control participants. The boxes have lines at the lower quartile (horizontal blue lines), median (horizontal red lines), and upper quartile values. The whiskers are lines extending from each end of the boxes to show the extent of the rest of the data. The “notch” marks the 95% confidence interval for the medians, which can be used to differentiate 2 groups. Namely 2 medians will differ significantly withP⬍ .05 if the 2 notch intervals do not overlap.
[image:6.594.57.368.50.174.2] [image:6.594.53.370.271.504.2]tween FA and functional connectivity along the pathways con-necting either Broca area and supplementary area or Broca area and Wernicke area. Our results showed the most prominent de-crease of VMHC in the primary visual cortex of patients with MS, and the reduced VMHC in these regions correlated significantly with the FA of CC segment 5 for occipital projections. This find-ing merges with the clinical symptom of a relatively prominent visual functional deficit previously or recently occurring in these patients, suggesting that decreased VMHC is possibly attributed to a callosal degenerative pathologic state with axonal attenua-tion.30Our results also showed a higher degree of VMHC decrease
in patients with lower callosal FA; such decreased VMHC is more prominent in homotopic vs heterotopic regions, which is consis-tent with our previous findings of preferential involvement of the CC in MS.6Similar to our findings, Lowe et al13reported that
functional connectivity by RS-fMRI is reduced between the bilat-eral primary sensorimotor regions in MS but did not reach a sig-nificant difference between 11 patients with MS and 10 control participants. In line with the results in this study, we also demon-strated a correlation between damage of the transcallosal motor pathway measured with DTI and its terminal bilateral sensorimo-tor functional connectivity in MS. In contrast to these results, Rocca et al14reported increased interhemispheric functional
con-nectivity of the sensorimotor network with CC damage in patients with MS. This discrepancy may be because different techniques were used in these studies, with our study using VMHC with perfect symmetry.
CONCLUSIONS
Our data provide preliminary evidence of the potential usefulness of VMHC analyses for the detection of abnormalities of inter-hemispheric coordination in MS. We demonstrated that the whole-brain homotopic RS-fMRI pattern was altered in patients with MS, which was partially associated with underlying struc-tural degenerative changes of the CC measured with FA. Such
observations can increase our understanding of interhemispheric structural and functional deficits in MS.
ACKNOWLEDGMENTS
We thank Lin Tang for her assistance with this manuscript.
Disclosures: Yongxia Zhou—RELATED: Grant:National Institutes of Health (NIH; Grant #: R01NS029029).* Robert I. Grossman—RELATED: Grant:NIH.* Yulin Ge—
RELATED: Grant: NIH,* Comments: This study was supported by Award no. R01NS029029 from the NIH. (*Money paid to institution.)
REFERENCES
1. Stark DE, Margulies DS, Shehzad ZE, et al.Regional variation in interhemispheric coordination of intrinsic hemodynamic fluctua-tions.J Neurosci2008;28:13754 – 64
2. Zuo XN, Kelly C, Di Martino A, et al.Growing together and growing apart: regional and sex differences in the lifespan developmental trajectories of functional homotopy.J Neurosci2010;30:15034 – 43 3. Fair DA, Dosenbach NU, Church JA, et al.Development of distinct
control networks through segregation and integration.Proc Natl Acad Sci U S A2007;104:13507–12
4. Kelly C, Zuo XN, Gotimer K, et al.Reduced interhemispheric resting state functional connectivity in cocaine addiction.Biol Psychiatry
2011;69:684 –92
5. Brown LN, Zhang Y, Mitchell JR, et al.Corpus callosum volume and interhemispheric transfer in multiple sclerosis.Can J Neurol Sci
2010;37:615–19
6. Ge Y, Law M, Johnson G, et al.Preferential occult injury of corpus callosum in multiple sclerosis measured by diffusion tensor imag-ing.J Magn Reson Imaging2004;20:1–7
7. Sigal T, Shmuel M, Mark D, et al.Diffusion tensor imaging of corpus callosum integrity in multiple sclerosis: correlation with disease variables.J Neuroimaging2012;22:33–37
8. Aboitiz F, Montiel J.One hundred million years of interhemispheric communication: the history of the corpus callosum.Braz J Med Biol Res2003;36:409 –20
9. Kennerley SW, Diedrichsen J, Hazeltine E, et al.Callosotomy pa-tients exhibit temporal uncoupling during continuous bimanual movements.Nat Neurosci2002;5:376 – 81
10. Desjardins S, Braun CM.Homotopy and heterotopy and the
[image:7.594.55.533.48.210.2]eral field advantage in the Dimond paradigm.Acta Psychol (Amst) 2006;121:125–36
11. Ge Y, Law M, Grossman RI.Applications of diffusion tensor MR imaging in multiple sclerosis.Ann N Y Acad Sci2005;1064:202–19 12. Chao YP, Cho KH, Yeh CH, et al.Probabilistic topography of
hu-man corpus callosum using cytoarchitectural parcellation and high angular resolution diffusion imaging tractography.Hum Brain Mapp2009;30:3172– 87
13. Lowe MJ, Beall EB, Sakaie KE, et al.Resting state sensorimotor func-tional connectivity in multiple sclerosis inversely correlates with transcallosal motor pathway transverse diffusivity. Hum Brain Mapp2008;29:818 –27
14. Rocca MA, Absinta M, Moiola L, et al.Functional and structural connectivity of the motor network in pediatric and adult-onset re-lapsing-remitting multiple sclerosis.Radiology2010;254:541–50 15. Beall EB, Lowe MJ.The non-separability of physiologic noise in
functional connectivity MRI with spatial ICA at 3T.J Neurosci Meth-ods2010;191:263–76
16. Beall EB.Adaptive cyclic physiologic noise modeling and correction in functional MRI.J Neurosci Methods2010;187:216 –28
17. Zuo XN, Kelly C, Adelstein JS, et al.Reliable intrinsic connectivity networks: test-retest evaluation using ICA and dual regression ap-proach.Neuroimage2010;49:2163–77
18. Power JD, Barnes KA, Snyder AZ, et al.Spurious but systematic correlations in functional connectivity MRI networks arise from subject motion.Neuroimage2012;59:2142–54
19. Mesulam M.Brain, mind, and the evolution of connectivity.Brain Cogn2000;42:4 – 6
20. Smith SM, Jenkinson M, Johansen-Berg H, et al.Tract-based spatial
statistics: voxelwise analysis of multi-subject diffusion data. Neuro-image2006;31:1487–505
21. Rosas HD, Lee SY, Bender AC, et al.Altered white matter micro-structure in the corpus callosum in Huntington’s disease: implica-tions for cortical “disconnection”.Neuroimage2010;49:2995–3004 22. Lazar M, Weinstein DM, Tsuruda JS, et al.White matter tractography
using diffusion tensor deflection.Hum Brain Mapp2003;18:306 –21 23. Mori S, van Zijl PC.Fiber tracking: principles and strategies—a
technical review.NMR Biomed2002;15:468 – 80
24. Tyszka JM, Kennedy DP, Adolphs R, et al.Intact bilateral resting-state networks in the absence of the corpus callosum.J Neurosci
2011;31:15154 – 62
25. Lenzi D, Conte A, Mainero C, et al.Effect of corpus callosum damage on ipsilateral motor activation in patients with multiple sclerosis: a functional and anatomical study.Hum Brain Mapp2007;28:636 – 44 26. Johnston JM, Vaishnavi SN, Smyth MD, et al.Loss of resting inter-hemispheric functional connectivity after complete section of the corpus callosum.J Neurosci2008;28:6453–58
27. Khanna PC, Poliakov AV, Ishak GE, et al.Preserved interhemi-spheric functional connectivity in a case of corpus callosum agene-sis.Neuroradiology2012;54:177–79
28. Cifelli A, Matthews PM.Cerebral plasticity in multiple sclerosis: insights from fMRI.Mult Scler2002;8:193–99
29. Morgan VL, Mishra A, Newton AT, et al.Integrating functional and diffusion magnetic resonance imaging for analysis of structure-function relationship in the human language network.PLoS One
2009;4:e6660