Designing video instruction for statistics software
47
0
0
Full text
(2) VIDEO INSTRUCTION FOR STATISTICS SOFTWARE. 2. Table of Contents. Acknowledgement .................................................................................................... 4 Abstract ..................................................................................................................... 5 Chapter 1: Analysis and Exploration ........................................................................ 6 Theoretical Foundations ........................................................................................................... 7 Assumptions of Multimedia Learning .................................................................................... 7 Processes of Demonstration-Based Training .......................................................................... 8 Attention. ..........................................................................................................................................8 Retention. ..........................................................................................................................................9 Reviews......................................................................................................................................................10. Production. ......................................................................................................................................11 Motivation. ......................................................................................................................................11. Overall Framework ................................................................................................................ 11 Research Context .................................................................................................................... 12. Chapter 2: Design and Construction ....................................................................... 14 Learning Objectives ................................................................................................................ 14 Exploring Solutions for Video................................................................................................ 15 Andy Field’s Textbook ......................................................................................................... 16 Attention. ........................................................................................................................................16 Retention. ........................................................................................................................................17 Reviews......................................................................................................................................................17. Production. ......................................................................................................................................17 Motivation. ......................................................................................................................................17. Andy Field’s Video ............................................................................................................... 18 Attention. ........................................................................................................................................18 Retention. ........................................................................................................................................18 Production. ......................................................................................................................................19 Motivation. ......................................................................................................................................19. Implementation ....................................................................................................................... 20 Video Sequencing and Content ............................................................................................. 20 Video Design Processes and Principles ................................................................................ 21 Attention. ........................................................................................................................................21 Retention. ........................................................................................................................................24 Reviews......................................................................................................................................................26. Production. ......................................................................................................................................27 Motivation. ......................................................................................................................................27. Chapter 3: Evaluation and Reflection ..................................................................... 29.
(3) VIDEO INSTRUCTION FOR STATISTICS SOFTWARE. 3. Method ..................................................................................................................................... 29 Participants............................................................................................................................ 29 Instruments............................................................................................................................ 29 Videos. ............................................................................................................................................29 Post-test. ..........................................................................................................................................30 Delayed Post-test. ...........................................................................................................................30. Procedure .............................................................................................................................. 31 Analysis................................................................................................................................. 31 Results ...................................................................................................................................... 32 Video-Playing Behaviours .................................................................................................... 32 Learning Assessments........................................................................................................... 35 Scores. .............................................................................................................................................35 Past Year. ........................................................................................................................................35 Scores by Video Engagement Level. ..............................................................................................35. Effect of Video Reviews ....................................................................................................... 36 Discussion and Conclusions ................................................................................................... 38. References ............................................................................................................... 41 Appendices .............................................................................................................. 44 Appendix A - Multiple-Choice Test for the Post-Test ......................................................... 44 Appendix B - Assignment for the Delayed Post-Test ........................................................... 46.
(4) VIDEO INSTRUCTION FOR STATISTICS SOFTWARE. 4. Acknowledgement It’s hard to believe that my time in the Netherlands is already over! I would like to thank the University of Twente in providing me with the opportunity to attend the Educational Science and Technology programme. I especially want to thank my supervisor, Hans van der Meij, in his incredible support and guidance throughout this process. It’s astonishing how much he knows about video instruction. I also want to thank my students from Inferential Statistics for believing in the video instruction and benefiting from it! Finally, I want to thank Andy Field and his quirky way of presenting statistics and SPSS, which inspired the unusual topic of my video instruction..
(5) VIDEO INSTRUCTION FOR STATISTICS SOFTWARE. 5. Abstract This study investigates the design of optimised video instruction for statistics software and how it contributes to learning in a practical context. In addition, the use of video reviews to further optimise video instruction was examined. The video instruction was developed using multimedia assumptions, demonstration-based training processes, and various video principles and guidelines. It was shared to students in the Inferential Statistics course at the University of Twente, and an experimental group received a video instruction containing video reviews. All participants were asked to complete a quiz immediately after watching the video instruction, and complete an assignment within a given deadline. Overall, it was found that video instruction, with or without reviews, was effective at engaging students and contributing to learning as students performed well on the quiz and the assignment. In addition, participants in the experimental condition who watched the majority of the video reviews performed significantly better on the quiz. The current study suggests that optimised video instruction contributes to engaging students and helping them learn, and there are advantages in using video reviews. For further research, a better understanding on what encourages students to watch video reviews is suggested. Keywords: Video, reviews, demonstration-based training, statistics, software.
(6) VIDEO INSTRUCTION FOR STATISTICS SOFTWARE. 6. Designing Video Instruction for Statistics Software. Chapter 1: Analysis and Exploration It was in the 1900s when H.G. Wells inspired many to realise that statistics was not just for training astronomers, but it was also useful for training good citizens (Gould, 2010). The value of statistics became more understood, and today it is widely taught in higher education. However, teaching statistics is no easy task. Students are exposed to theories, concepts, principles, and formulas for computation. They have to learn how to both think and compute, which has proven to be difficult. For example, Mathews and Clark (2003) found that after completing an introductory university-level statistics course, students could not explain fundamental concepts as they only memorised formulas. Adding to this, new technologies have added another layer of learning for statistics. Technology is now inseparable from modern statistical practice (Gould, 2010), and using software to complete statistical analysis is the new norm (Baglin & Da Costa, 2014). Statistics software is a useful tool for automating statistics calculations and creating graphical displays. There is a wide range of statistics software available (e.g. SAS, Minitab, R, STATA, SPSS), and students of modern statistics courses will need to develop some level of technological skill alongside statistical understanding (Baglin & Da Costa, 2014). Statistics is already considered complex learning (Garfield & Ben-Zvi, 2007; Kester, Kirschner, & van Merriënboer, 2004) as it is involved with achieving integrated sets of learning objectives by combining and coordinating separate skills (Merriënboer, Clark, & Croock, 2002). Adding software skills adds additional learning objectives. The complexity of learning statistics, especially when adding software skills, is high due the number of learning objectives in different knowledge and cognitive process dimensions. A revised version of Bloom’s taxonomy of educational objectives identifies categories in the knowledge and cognitive process dimensions (as cited in Airasian & Miranda, 2002). There are three categories in the knowledge dimension that are applicable to statistics. Factual knowledge is the basic elements that learners must know to be familiar with a domain or solve problems in it, such as statistical notations. Conceptual knowledge is the generalisation of ideas and relational rules allowing the basic elements to function together, such as samples and populations and how distributions change with different samples. Procedural knowledge is the order certain steps should be taken in order to do something, such as performing a t-test. Furthermore, six categories make up the cognitive process dimension. Remember retrieves relevant knowledge from long-term memory. Understand determines the meaning of instructional messages through explanation. Apply carries out procedures in a given situation. Analyse organises material to detect relationships and overall purpose. Evaluate makes judgements based on critique. Lastly, create puts the learning together in order to generate, plan, and produce. Learning objectives for an instruction can be organised using a matrix of the knowledge and cognitive process dimensions. For example,.
(7) VIDEO INSTRUCTION FOR STATISTICS SOFTWARE. 7. learning objectives for the use of statistics software is organised in a matrix as shown in Figure 2 (see page 15). Learning objectives can be applied and obtained through carefully designed instruction, and appropriate technological tools can be used to help students improve understanding of statistics (Garfield & Ben-Zvi, 2007). Technological tools such as computer-assisted instruction and multimedia are being harnessed to create new methods of instruction for statistics (Lloyd & Robertson, 2012). A popular form of multimedia learning is video instruction, and its use continues to become more wide-spread, especially in higher education (Kay & Kletskin, 2012). New companies have emerged offering instruction that is primarily video-based, and universities across the world offer video lectures on a diverse range of topics. To add, videos have risen in popularity for software instruction due to the growth of new or updated software (van der Meij & van der Meij, 2013). Various studies have found that video instruction is effective to improve learning outcomes (e.g., Kay & Kletskin, 2012; Lloyd & Robertson, 2012; van der Meij & van der Meij, 2014), and students have described it as being enjoyable to watch, motivating, and helpful (Kay, 2014). To add, there has been an overall increase in video-based learning research in recent years (Giannakos, 2013) and there are various assumptions, processes, principles, and guidelines available for video instruction. For example, the cognitive theory of multimedia by Mayer, Heiser, and Lonn (2001) provides assumptions for how multimedia is intended to work. Additionally, video instruction provides a model of performance and can support a viewer’s processes through observational learning, which aligns with social cognitive theory (Bandura, 1986). Also, Mayer (2008) provides principles grounded in theory and based on evidence for instructional design of multimedia to improve learning. Koumi (2013) offers a framework of design guidelines for educational multimedia, and van der Meij and van der Meij (2013) shares guidelines for the construction of instructional videos for software training. However, it is not always clear how the assumptions, processes, principles, and guidelines are applicable in specific contexts, and how they impact viewer behaviour and understanding. Therefore, the main question shaping this research is, “Can an optimised video instruction contribute to helping students in higher education learn to use statistics software?” To better understand this question, existing research on video instruction was used as theoretical foundations.. Theoretical Foundations Assumptions of Multimedia Learning Multimedia learning involves learning through the presentation of materials using a combination of verbal and visual means, such as a video instruction. Multimedia learning is based on three underlying assumptions (Mayer et al., 2001). The first, dual channel assumption, uses dual-coding theory to suggest that verbal and visual information is processed differently and through separate sensory systems in the human mind. The second, limited capacity assumption, suggests that the verbal and visual channels can only process a small amount of material at one.
(8) VIDEO INSTRUCTION FOR STATISTICS SOFTWARE. 8. time. The third, generative learning assumption, suggests that deep learning depends on the learner’s ability to cognitively process material. The three assumptions build the cognitive theory of multimedia (Mayer et al., 2001). The theory is intended as a model for explaining how multimedia learning works. In the model, words and pictures enter the learner’s sensory memory, where they are selected, organised, and integrated (SOI). The learner selects some sounds and some pictures for further processing. Then, the learner organises the sounds and pictures into a verbal and visual model. The learner then activates prior knowledge that integrates into the verbal and visual models, which can be stored as knowledge in long-term memory. By combining the use of verbal and visual information, cognitive overload is prevented through off-loading essential processes to separate systems, resulting in more effective learning (Mayer & Moreno, 2003). However, an instruction must gain a learner’s attention in order to be effective at having the learner select information for processing. Also, the learner’s retention of the selected information depends on an instruction’s ability to make organising and integrating information more effective for the learner. Attention and retention are processes included in Bandura’s (1986) social cognitive theory, which suggests instruction can provide a model of performance to support a viewer’s learning processes. Bandura’s theory also includes the processes of production and motivation, which are not mentioned in the SOI model. Production and motivation can further support a viewer’s learning processes, specifically for demonstration-based training.. Processes of Demonstration-Based Training Video instruction can be in the form of demonstration-based training, which allows viewers to learn through observing a behaviour model and originates from social cognitive theory (Bandura, 1986). Demonstration-based training is a method of learning through observation, which is the case for video instruction on statistics software. Learners could observe a model-use of statistics software, which ideally would result in them understanding procedural knowledge of the software and allow them to reproduce the behaviour for future tasks. The theory suggests modelling-based observation affects learning outcomes through influencing four integrated processes, and these processes can be optimised for video instruction through the implementation of principles and guidelines. Attention. The first process, attention, states that people can only learn when aware and attentive during observation. If the learner is distracted, they will be unable to select relevant information for learning. For instruction involving a complex interface, such as statistics software, attentional processes are made more difficult for the learner due to the complexity and short-term nature of the video (van der Meij & van der Meij, 2016). There are principles and guidelines that can support learners so they can attend to information that is purposeful to understand and complete a task. For example, learners should be provided with a hook in order to capture attention through surprise, fascination, or suspense (Koumi, 2013). Additionally, music can also be used to capture the attention of viewers, especially in the beginning of an instruction. The pace of a video is also.
(9) VIDEO INSTRUCTION FOR STATISTICS SOFTWARE. 9. important for a learner’s attention process. A slow pace can bore the learner and make them inattentive, and a fast pace can overload the learner and result in them to stop viewing (van der Meij & van der Meij, 2013). Koumi (2003) refers to this as the elucidate guideline, which also states that intellectual depth should be moderated to prevent overloading the learner. It can be difficult to determine an appropriate pace for a video instruction, and van der Meij and van der Meij (2016) recommend that the native pacing of a video should be adapted to what the audience can handle. Furthermore, the use of visuals, such as diagrams, pictures, and animations, can help organise, clarify, and illustrate key aspects of a problem (Kay, 2014). Mayer (2008) explains this as “people learn more deeply when they build connections between a verbal representation and a pictorial representation of the same material” (p.755). Lastly, the use of signalling highlights essential materials in order to draw attention to them (Mayer, 2008). This supports and guides learner’s cognitive processing to key content and information to facilitating understanding without consuming extra mental effort (Grossman, Salas, Pavlas, & Rosen, 2013). This aligns with the easy-mapping guideline by (Renkl, 2011), which refers to emphasising and interrelating different sources of information by guiding attention in worked examples. The benefits of worked-examples are well documented (Atkinson, Derry, Renkl, & Wortham, 2000; Mayer, 2008), and workedexamples have been shown to lead to faster learning and better transfer (Mayer, 2007). To add, worked-example instructions are suitable as videos (Kay & Kletskin, 2012). Unlike the usual method of problem-solving where learners have to direct attention to search processes, workedexamples guide learners to aspects that are directly relevant for learning (Renkl, 2011). Retention. The second process, retention, states that people must be able to store information as symbolic representations in memory. If the learner is unable to process the information into longterm memory, they will be unable to recall relevant information for future tasks. There are principles and guidelines that can aid learners in retention processes. For example, segmentation can support a learner’s retention process by reducing essential processing demands when the material is too complex to retain as a continuous unit (Mayer, 2008). By segmenting an instruction into meaningful chunks, the learner can better structure a mental schema for future use (van der Meij & van der Meij, 2013). This aligns with Renkl’s (2011) meaningful-building-blocks guideline, which refers to presenting examples in a way that subcomponents and sub-goals can be identified so learners can solve similar problems by building the relevant pieces together. Also, adding pauses to a video instruction can support segmentation and allow the learner to take in information that is being presented (van der Meij & van der Meij, 2013), encourage contemplation (Koumi, 2003), and can have an overall significant impact on learning (Kay, 2014). Recalling prior knowledge can also support retention processes. By recalling prior knowledge, learners can devote more cognitive capacity to building knowledge of new incoming information from the instruction (Mayer, 2008). If the learner is able to better manage essential processing of new information, they are more likely to retain new knowledge. Moreover, retention can be supported with an instruction presented with a scenario of actual use, such as using the actual interface. For example, an instruction on a software application should reveal.
(10) VIDEO INSTRUCTION FOR STATISTICS SOFTWARE. 10. what the learner will encounter when he or she executes the task in the future. The instruction then shows what task execution will look like in context, which allows for the learner to develop insights about the structural layout of the interface and remember it for future scenarios (van der Meij and van der Meij, 2013). This is supported by Höffler and Leutner (2007), which found that the most realistic animation resulted in the highest learning outcome. Reviews. The use of reviews can also aid in a learner’s retention process. With video instruction, learners usually have the freedom to replay the video. Replaying the video presents the same materials repeatedly and the learner does not have additional guidance to understand the content. The same words and pictures are being processed by the learner within their working memory, and the learner is spending more time on task. Nonetheless, unlike the capacity for storing knowledge in long-term memory, the capacity for holding and processing multimedia in working memory is limited (Mayer & Moreno, 2003). Therefore, instead of a video replay, there may be advantages for learners to watch a video review. However, research on reviews in video instruction has largely been ignored. The limited research on end summaries, such as video reviews, supports the notion that their value “seems to be so obvious that few people have felt any real need to subject the concept to empirical investigation” (Hartley & Davies, 1976, p. 251, as cited in van der Meij & van der Meij, 2016). Nevertheless, one study by van der Meij and van der Meij (2016) found that videos reviews significantly reduced training time and significantly improved immediate post-test scores. Also, a study by Mayer, Bove, Bryman, Mars, and Tapangco (1996) suggests that the use of summaries based on both text and illustrations for scientific explanations were effective. Textbooks can contain reviews after each chapter in order select, organise, and integrate key knowledge, and reviews have been found to be an effective way to promote student understanding and recall. Summaries that are concise, coherent, and coordinated can reduce the load on the cognitive system (Mayer et al., 1996), which allow learners to carry out retention and transfer tasks more effectively. Reviews featuring similar characteristics for videos may yield similar results and reduce the need for learners to increase training time by replaying the video. Although research on reviews is limited, the inclusion of video reviews following specific principles and guidelines could help to optimise retention processes of a video instruction. For example, the review can paraphrase and repeat key materials from the instruction to provide a concise and coherent overview for learners. Also, the review can sustain-attention of learners, such as by playing music, so they will take in the summarised information. Although research warns that adding interesting elements such as music during an instruction can harm learning outcomes (Moreno & Mayer, 2000), speculative analysis by Koumi (2013) suggests interesting elements could play a role in keeping the attention of viewers. Additionally, reviews can employ the concept of desirable difference. In van der Meij and van der Meij (2016), reviews were used in a video demonstration, however the reviews were not substantially different than the demonstration. As a consequence, learners may have thought that the reviews were redundant, resulting in reduced attention and retention. Therefore, subtle design differences may be beneficial for a review. Lastly,.
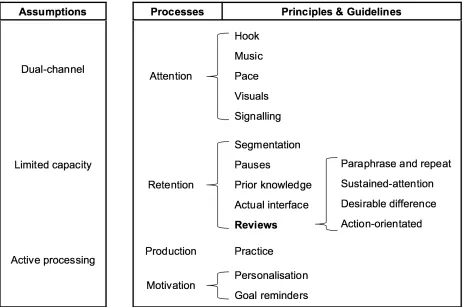
(11) VIDEO INSTRUCTION FOR STATISTICS SOFTWARE. 11. a review can be action-orientated in order to make it easier for the learner to process the information into personal action plans for future execution. Production. The third process, production, refers to converting stored symbolic representations from an instruction into explicit actions in order to execute a given task. For example, the use of practice scenarios after a video instruction can allow learners to check for understanding and recall of the presented content (van der Meij & van der Meij, 2016). Learners will realise if they have grasped the material sufficiently, or if they need to re-visit the instruction. Motivation. The fourth process, motivation, states that people must perceive the acquired behaviour as valuable and without negative consequences. Motivation is the driving force behind the attention, retention, and production processes (van der Meij & van der Meij, 2016). If the learner does not have a desire to perform the observed behaviour due to perceived lack of value or negative consequences, they will not reproduce the behaviour. For example, personalisation by using a conversational style narrative can enhance motivation. According to Mayer (2008), the theoretical rationale is that using conversational style creates “a sense of social partnership with the narrator in which learners try harder to make sense of what their conversational partner is saying” (p. 766). This aligns with Koumi’s (2003) sensitise guideline, which states that an informal and friendly presentation can build confidence. Also, goal reminders can improve motivation by providing learners with repeated mementos of the overall goal. Laurillard, Stratfold, Luckin, Plowman, & Taylor (2000) suggest including a clear statement and repeated reminders of the overall goal to support a task-related plan.. Overall Framework Based on the theoretical foundations, an overall framework for the design of a demonstration-based video instruction was created, as seen in Figure 1. Assumptions of multimedia learning are applicable to the video instruction in the framework, and principles and guidelines can be mapped to processes from demonstration-based training. Further research is needed on the effect of video reviews, however their use looks promising and the framework includes them to further optimise retention processes. Therefore, the current study will also investigate the effect of video reviews..
(12) VIDEO INSTRUCTION FOR STATISTICS SOFTWARE. 12. Figure 1. Framework for the design of a demonstration-based video instruction. Research Context This study may be best characterised as research aimed towards analysing ideas for designing video instruction for statistics software, with the hope of contributing empirical evidence to help other designers (McKenny & Voogt, 2009). Therefore, the current study used the framework created for the design of a demonstration-based video to develop and implement an optimised video instruction on statistics software, specifically IBM SPSS. The design of the video instruction included the use of video reviews since their use may be a beneficial feature that requires further empirical evidence. The video instruction was developed for students at the University of Twente in the Netherlands. Prospective master students at the university in non-engineering programs complete the Inferential Statistics course. The course is made up of lectures focused on traditional statistics facts, concepts, and procedures (e.g., statistical notations, t-tests, and performing a t-test on paper) and practicals focused on facts and procedures of SPSS (e.g., SPSS terminology and performing a t-test in SPSS). The majority of students have little to no previous experience with inferential statistics. To add, students are only familiar with the basic interface and functionality of SPSS.
(13) VIDEO INSTRUCTION FOR STATISTICS SOFTWARE. 13. from a pre-requisite course, where they learn about dataset layouts, performing descriptive statistics, and making charts and graphs. During the first practical, students are introduced to inferential statistics within SPSS. In under 100 minutes, students learn how to perform three types of t-tests: one-sample, paired sample, and independent samples. As this is a large scope for one practical, little to no statistics content is covered, and the focus is on using SPSS. Students need to recall learning from the lecture on ttests, usually held two weeks prior, to fully understand the practical. For that reason, an instruction prior to the practical on connecting statistics content from the lectures with SPSS content from the practical may be beneficial for students. The scope was reduced for the current design. Scope that is too broad can lead to students having difficulty building a mental model and connecting content (Smith & Ragan, 2005). Therefore, only one type of t-test, an independent samples t-test, was chosen for the video instruction. The scope was the starting point in the design and construction of the video..
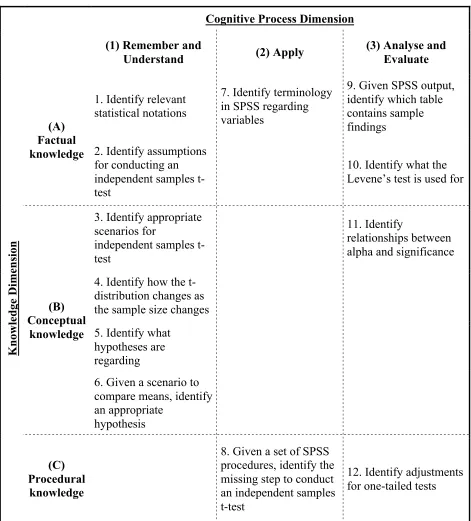
(14) VIDEO INSTRUCTION FOR STATISTICS SOFTWARE. 14. Chapter 2: Design and Construction The overall goal of the video was aimed to complement learning of independent samples t-tests by connecting traditional statistics content from the past lecture, with content on using SPSS from the upcoming practical. To add, the video could prepare students for a required assignment, which they are given after the practical. In the assignment, students are given problems and need to demonstrate how they solved them using SPSS. Problem-solving is the ability to solve a problem by combining domain-specific learning outcomes, such as facts, concepts, and procedures (Smith & Ragan, 2005). The content on independent samples t-tests from the lecture and the practical was used in order to create relevant learning objectives.. Learning Objectives Guidelines from Mager (1997) were used to craft the learning objectives. According to Mager (1997), learning objectives should include three components, a performance, conditions, and criteria. For example, the following learning objective, “Given a set of SPSS procedures, identify the missing step to conduct an independent samples t-test”, was created to test if students could recognise the missing step in a set of SPSS procedures. For this objective, the performance is ‘identify the missing step’, as it is something that is completed by the learner. Then, ‘given a set of SPSS procedures’ is the condition the learner must complete the performance in. Lastly, identifying one step is the criteria as it determines how well the learner must complete the performance. Mager (1997) mentions that conditions and criteria are not always applicable for every learning objective. Furthermore, the revised version of Bloom’s taxonomy of educational objectives (as cited in Airasian & Miranda, 2002) was used to align the learning objectives to relevant knowledge and cognitive process dimensions discussed earlier. In the current context, learners require an instruction that presents and connects factual, conceptual, and procedural knowledge of statistics and SPSS so they can solve future problems. Also, the learners need to go through five of the six cognitive processes to learn how to solve problems using t-tests in SPSS. In the current context, it was logical to group these processes into three sequential categories. First, they need to remember and understand the basics of an independent samples t-test. Then, they need to apply steps to perform the t-test in SPSS. Third, they need to analyse and evaluate the SPSS output. Create was not included as learners do not produce their own solutions during the video instruction. For example, when learners need to apply steps to perform an independent samples-test in SPSS, they need to identify SPSS terminology (factual knowledge) and know which order the software steps go in (procedural knowledge). The full mapping of the learning objectives into knowledge and cognitive process dimensions can be seen in Figure 2..
(15) VIDEO INSTRUCTION FOR STATISTICS SOFTWARE. 15. Cognitive Process Dimension (1) Remember and Understand 1. Identify relevant statistical notations. Knowledge Dimension. (A) Factual knowledge 2. Identify assumptions for conducting an independent samples ttest. (2) Apply 7. Identify terminology in SPSS regarding variables. (3) Analyse and Evaluate 9. Given SPSS output, identify which table contains sample findings 10. Identify what the Levene’s test is used for. 3. Identify appropriate scenarios for independent samples ttest. 11. Identify relationships between alpha and significance. 4. Identify how the tdistribution changes as the sample size changes. (B) Conceptual knowledge 5. Identify what hypotheses are regarding. 6. Given a scenario to compare means, identify an appropriate hypothesis (C) Procedural knowledge. 8. Given a set of SPSS procedures, identify the 12. Identify adjustments missing step to conduct for one-tailed tests an independent samples t-test. Figure 2. Learning objectives mapped to knowledge and cognitive process dimensions for independent samples t-tests. Exploring Solutions for Video Once the learning objectives were created, potential solutions for the video instruction were explored. To start, Andy Field’s textbook, Discovering Statistics Using IBM SPSS, was analysed. Field is an award-winning Professor, and his textbook is worth exploring as it blends statistics and.
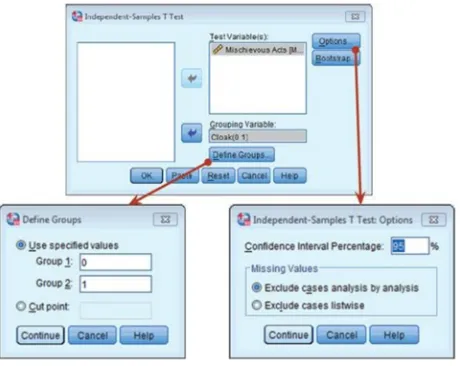
(16) VIDEO INSTRUCTION FOR STATISTICS SOFTWARE. 16. related SPSS tasks with eloquence and with humour. The textbook won the British Psychological Society Book Award in 2007 and is ranked the number one best seller on Amazon in the Mathematical and Statistical Software category in books. Andy Field also has a video series available on YouTube based on his textbook. Both the textbook and video were explored.. Andy Field’s Textbook Chapter nine from Field’s textbook covers factual, conceptual, and procedural content on independent samples and paired samples t-tests. The chapter introduces a problem and the content resembles the sequencing of the cognitive processes identified previously for the learning objectives of the current study. First, the chapter helps learners remember and understand applicable knowledge on t-tests, then knowledge is applied by performing t-tests in SPSS, lastly the chapter analyses and evaluates the t-test output. The chapter also employs the use of the attention, retention, production, and motivation processes from demonstration-based training. Attention. The chapter supports attention processes through the use of a hook, visuals, and signalling. Content in the chapter is introduced using a Harry Potter referenced and humorous problem on invisible cloaks. The humorous story acts as a hook (Koumi, 2003), establishes a purpose for the chapter, and arouses the learner’s attention (Smith & Ragan, 2005). Furthermore, visuals are used throughout the chapter. For example, Figure 3 shows how the textbook uses screen grabs directly in the text and to visually show the process of running a t-test in SPSS. The chapter uses the screen. Figure 3. Field visually processes SPSS procedures in his chapter (Field, 2013, p. 466).
(17) VIDEO INSTRUCTION FOR STATISTICS SOFTWARE. 17. grabs in a worked-example approach, which provides an expert’s step-by-step procedure in solving a given problem and can encourage learners to connect abstract knowledge and apply it to concrete cases (Renkl, 2011). The chapter also uses signalling (e.g., the use of arrows) to visually focus the learner’s attention to key elements. For example, the use of signalling is clear in Figure 3, which uses arrows to demonstrate resulting dialogue boxes for ‘Define Groups’ and ‘Options’. Retention. The chapter supports retention processes through the use of segmentation and recall of prior knowledge. Segmentation is used to divide the chapter into meaningful chunks. For example, the section, ‘Independent samples t-test using SPSS’ is segmented into six sub-sections: (1) the general procedure, (2) exploring data and assumption, (3) compute the independent t-test, (4) output from the independent t-test, (5) calculating effect size, and (6) reporting the independent ttest. Segmentation of the chapter into sub-sections makes content more manageable for the learner. Furthermore, the chapter helps learners remember and recalls prior knowledge where relevant. For example, the chapter recalls prior knowledge on samples sizes by saying, “We saw in Chapter 1 that large samples are better than small ones because they more closely approximate the population” (Field, 2013, p. 457). Reviews. Retention processes are also supported in the chapter through the use of reviews. The reviews paraphrase and repeat key concepts and procedures from the preceding section and are presented in boxes labelled as ‘Cramming Sam’s Tips’. Also, the summaries are presented on a yellow background to make them desirably different and to make them stand out. Furthermore, the reviews contain statements that are action-orientated by beginning with a verb. This can support learners to use the statements to solve future problems. For example, one of the review points is, “Look at the column labelled Sig. If the value is less than .05 then the means of the two groups are significantly different.” Lastly, the summary ends with a positively reinforced phrase and a smiley face, “Go on, you can do it :)). This helps re-motivate the learner and closes on a positive note (Smith & Ragan, 2005). Production. The chapter supports production processes through the use of practice tasks provided at the end of the chapter. The chapter provides problem-based questions on t-tests and the learner can solve the problem using SPSS. There are ten tasks provided, for example, “In Chapter 3 we looked at data from people who had been forced to marry goats and dogs and measured their life satisfaction as well as how much they like animals. Conduct a t-test to see whether life satisfaction depends upon the type of animal to which a person was married.” Answers for the problems are provided on the textbook’s companion website. Motivation. The chapter supports motivation processes through the use of personalisation. People learn better when words are in conversational style rather than formal style (Mayer, 2008), and this chapter presents information in this way. For example, the chapter explains the process of selecting.
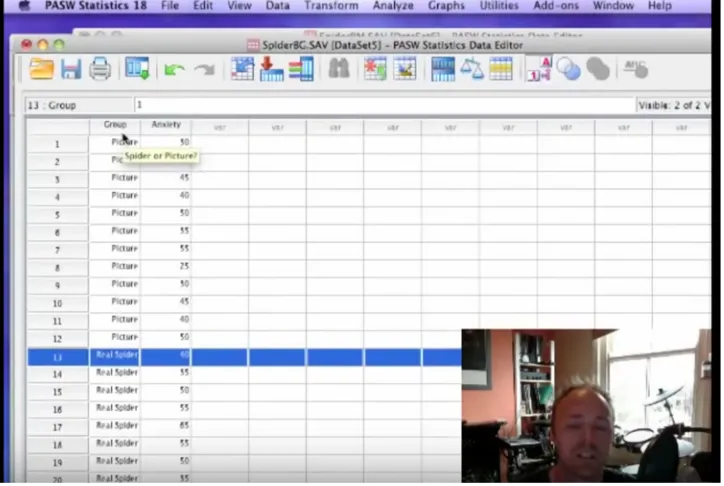
(18) VIDEO INSTRUCTION FOR STATISTICS SOFTWARE. 18. variables with, “Next, we need to select an independent variable (the grouping variable). In this case, we need to select Cloak and then transfer it to the box labelled Grouping Variable.” Conversational style text makes it easier for readers to create a sense of narration and a social partnership with the narration, which can result in learners trying harder to make sense out of the information (Mayer, 2008).. Andy Field’s Video Andy Field’s video on t-tests was also explored. The video covers independent samples and paired samples t-tests and is sequenced similarly to the textbook chapter. It is primarily a demonstration-based training video using a worked-example. Learners are introduced to a problem and Field shows the viewer step-by-step procedures to solve the problem in SPSS. Although demonstration-based training and worked-examples are suitable as videos (Kay & Kletskin, 2012), there is an opportunity for Field to improve demonstration-based training processes and apply video principles and guidelines. Attention. Field’s video supports attention processes through the use of music, a hook, and visuals. The video grabs the user’s attention with the use of music when introducing the video, and by the humorous story. As mentioned, this acts as a hook, which can surprise and fascinate the learner (Koumi, 2003). Furthermore, Field uses visuals of the screen recording of SPSS throughout the video, which helps people learn better as they are learning from words and visuals instead of words alone (Mayer, 2008). Field also includes a visual of his talking head in the video (see Figure 4), however, people do not necessarily learn more deeply when the speaker’s talking head is included alongside the narration (Mayer, 2014). The talking head also distracts attention away from key areas of the screen during demonstration. For example, the talking head will impede on the view of certain SPSS features during their explanation. Field’s video does not support attention processes by having an unsuitable pace, and lack of signalling. The overall pace of Field’s video is slow, which makes the video boring and distracts attention. Also at some points in the video, the screen recording visuals move too rapidly to cause confusion for the learner. For example, Field will zoom into one area of the screen, and quickly zoom into another, creating a somewhat dizzying effect. Furthermore, signalling highlights essential material in an instruction to emphasise certain points (Mayer, 2008). The emphasis of key points can help with attention processes. Although Field highlights items using his mouse (also seen in Figure 4), tasks could be made more clear, for example, by adding circles to screen objects (van der Meij & van der Meij, 2013). Retention. Field’s video supports retention processes by remaining faithful to the actual interface. The video does this by providing step-by-step processes on how to use SPSS and showing the full interface of SPSS, as shown in Figure 4. By showing the whole interface for producing a given.
(19) VIDEO INSTRUCTION FOR STATISTICS SOFTWARE. 19. task, the viewer observes the same image that he or she is likely to face when trying to execute the task (van der Meij & van der Meij, 2013). Field’s video does not support retention processes effectively through the lack of segmentation and reviews. The video is one continuous presentation of over 15 minutes and does contain any segmentation of content. According to Mayer (2008), people learn better when presented with learner-paced segments rather than a continuous presentation. Segmentation prevents learners from being overburdened with too much continuous information (Mayer, 2008), and can encourage retention processes (van der Meij & van der Meij, 2013). Furthermore, unlike in his textbook chapter, Field does not provide learners with reviews in his video. His extent of closure at the end of the video is, “So that is pretty much everything you need to know about the t-test, kind of anyway” (Field, 2012).. Figure 4. Screenshot of Field’s video with use of a talking head, full SPSS interface, and limited highlighting (Field, 2012) Production. Field’s video supports production processes by referring to practice opportunities from the textbook. The video acts as a companion to Field’s textbook, and Field makes occasional references to the textbook so learners can refer to the practice problems in it. If the learners have access to the textbook, they can complete the practice tasks after watching the video to check for understanding and recall. Motivation. Field’s video supports motivation processes by using personalisation in a conversational style narration, however there is a high level of spontaneity in it. Based on Bandura (1986), learners.
(20) VIDEO INSTRUCTION FOR STATISTICS SOFTWARE. 20. need to be motivated in order perceive the demonstration as worthwhile to watch. The video improves motivation by presenting the narrative in a conversational style rather than a formal style to increase level of personalisation (Mayer, 2008). However, it is as if Field did not use a scripted narrative for the video, but instead used a spontaneous verbose consisting of long sentences. In a video instruction, long sentences should be avoided to prevent exceeding the listener’s memory span (Koumi, 2003). For example, Field introduces the t-test in his video as, “Now a t-test is a test that you use when you want to compare two means and normally you’re doing that because you have done some kind of experiment and you have manipulated your independent variable by some kind of intervention and some form of manipulation and some kind of control group and you want to compare the two.” The phrase is a long, run-on sentence, with confusing terminology, such as ‘manipulated’, and ‘intervention’.. Implementation The analysis of Field’s textbook provided inspiration for the content and style of the current video, and the analysis of Field’s video strengthened understanding of the importance of video processes and principles.. Video Sequencing and Content The sequencing and content of the current video can be logically mapped to the cognitive processes identified for the learning objectives of the current study. The grouping of the cognitive processes provided a systematic method to divide the video instruction into three separate videos. Each video would focus on particular cognitive processes and learning outcomes from relevant knowledge categories. Learners are undertaking a complex learning task and are involved with achieving integrated sets of learning to meet multiple objectives (Merriënboer et al., 2002). Therefore, dividing the videos could manage essential processing and support learners to build a coherent mental representation of independent samples t-test. To add, the videos were designed to be short, as some researchers suggest lengths between 15 to 60 seconds (Plaisant & Shneiderman, 2005) while others suggest that lengths of 3 to 5 minutes are more appropriate (Mayer, 2014; Kay, 2014). Van der Meij and van der Meij (2013) suggest that designers should look for goal completion when segmenting, instead of just time limits. The first video, Introducing the t-test, acted as the introduction to the overall video instruction. Its goal was to present the problem and help learners recall the basics of statistics and understand the rationale of a t-test. Prior knowledge is also recalled, and the basics related to ttests, such as statistical notations, samples, populations, and distributions, are explained. The second video, Performing a t-test in SPSS, applied SPSS procedures to the given problem and provided step-by-step instructions on performing a t-test using the software. The third video, Understanding SPSS output from a t-test, aimed to solve the given problem by explaining the SPSS output. In this video, learners processed information on how to analyse the SPSS output from the previous video. The narrator connected the results from the procedures with statistics concepts and procedures, such as Levene’s test and one-tailed tests, to solve the given problem..
(21) VIDEO INSTRUCTION FOR STATISTICS SOFTWARE. 21. A fourth video was planned during the prototyping phase to provide learners with a summary and review of the content. However, due to the complexity of the learning task, one single review consisted of too much content that alone could overwhelm the learner. A solution to this was to provide reviews after each video. This way, the learner was provided with a brief summary of the relevant cognitive processes. The separate reviews activated necessary knowledge in working memory to guide the learner to perform the next task, and they repeated and paraphrased key information from each video to encourage retention.. Video Design Processes and Principles The current video instruction used demonstration-based training processes to improve learning, and video guidelines and principles were used to enhance each process. Attention. In order to support attention processes, the current video used music, a hook, a reasonable pace, visuals, and signalling. Similar to Field’s video, music was used when introducing the videos and the video instruction used a humorous story for the problem. This acted as a hook to capture the learner’s attention (Koumi, 2003). The story involved a simple problem on comparing if people married to goats were more intelligent than people not married to goats. It was meant to surprise and fascinate learners. To add, Koumi’s (2003) elucidate guideline was used for the pace of the videos. The pace of the video was moderate and considered the target audience in terms of intellectual depth and vocabulary used in the narrative. Furthermore, visuals were used throughout the videos and they were grounded using the modality, redundancy, and temporal contiguity principles by Mayer (2008). The modality principle states that people learn better when words are presented as narration rather than as on-screen text. The redundancy principle states that people learn better when onscreen text is not added to narration. The temporal contiguity principle states that people learn better when corresponding words and pictures are presented simultaneously. These three principles were implemented in the videos as seen in Figure 5, which demonstrates the narration and visuals for a sequence to describe the sample in the given problem..
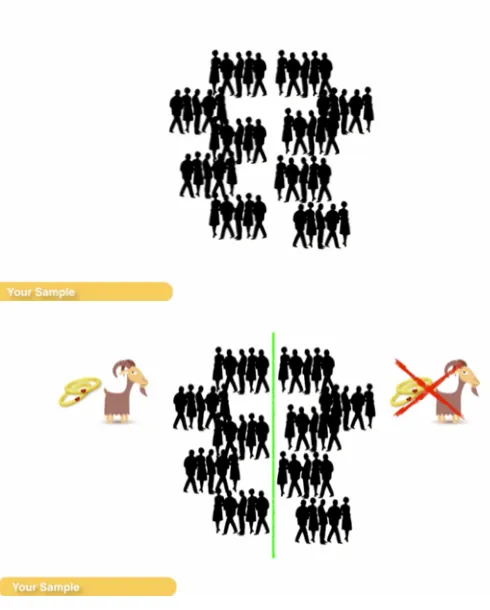
(22) VIDEO INSTRUCTION FOR STATISTICS SOFTWARE. 22. Narration: “You randomly selected 50 people…” Here, a visual depiction of a group of 50 people is used to represent the sample. The use of visuals and narration aligns with the modality principle. On-screen text was not included to align with the redundancy principle.. Narration: “…with half of them married to a goat.” Here, a line is drawn to indicate that the sample is divided into two groups, and the groups are represented with icons. The line and visuals appear corresponding to what is being said in the narrative to align with the temporal contiguity principle.. Figure 5. Use of visuals with corresponding narration.
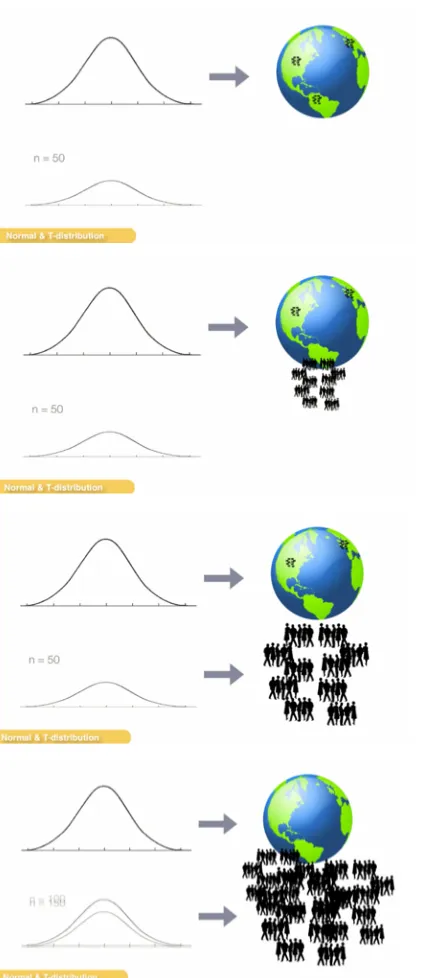
(23) VIDEO INSTRUCTION FOR STATISTICS SOFTWARE. 23. Additionally, Arguel and Jamet (2009) found that the dynamic presentation of pictures to demonstrate changes over time was beneficial to learners compared to static pictures, especially for animations with a small amount pictures. In the current design, knowledge regarding normal and t-distributions was explained using a dynamic animation. The dynamic animation explained that t-distributions are used for samples, and as sample size increases, the t-distribution becomes more normal. Figure 6 demonstrates the sequence presented in the video.. A normal distribution is shown with Earth to represent a population.. A group of people from Earth are extracted to represent a sample. The animation clearly depicts the sample being extracted from the population.. The relationship between the sample and a t-distribution is made clear.. The animation shows the sample getting larger, which consequently results in the tdistribution looking more like the normal distribution.. Figure 6. Use of dynamic animations to explain t-distributions.
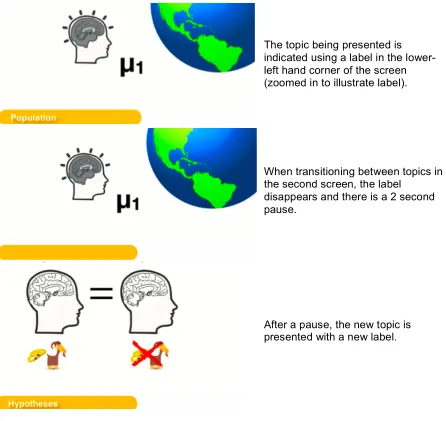
(24) VIDEO INSTRUCTION FOR STATISTICS SOFTWARE. 24. Also, in order to highlight essential material, signalling techniques were used when presenting SPSS procedural steps. Signalling can help guide the learner’s attention toward essential material to minimise processing of extraneous material (Mayer, 2008). Van der Meij and van der Meij (2013) suggest adding signalling features when demonstrating software steps to gain the user’s attention to specific screen elements or locations. For example, Figure 7 shows how zooming and highlighting are implemented in the current instruction.. Figure 7. Use of zooming and highlighting. The video zooms into the relevant dialogue box being presented. The arrow is used to highlight the feature to select variables. Retention. Retention processes were supported in the current video through the use of segmentation and pauses, prior knowledge, the actual interface, and reviews. Each video was segmented using subtitles and pauses to further manage essential processing and improve retention. The videos used pauses of 2 seconds to transition between topics, as suggested by Koumi (2013), and the topic was indicated by using labels in the corner of the screen (see Figure 8). Although these labels go against the redundancy principle by adding on-screen text to narration, they acted as anchors for the segmentation within the video..
(25) VIDEO INSTRUCTION FOR STATISTICS SOFTWARE. 25. The topic being presented is indicated using a label in the lowerleft hand corner of the screen (zoomed in to illustrate label).. When transitioning between topics in the second screen, the label disappears and there is a 2 second pause.. After a pause, the new topic is presented with a new label.. Figure 8. Use of sub-titles and pauses to support segmentation within videos The video also supports retention processes by recalling prior knowledge. For example, the learner must understand samples and populations to understand a t-test. The current video instruction recalls prior knowledge of samples and populations by visually depicting a sample as a group of people, and a population as the world. Then the video links the visual depictions of samples and populations to describe normal and t-distributions, which leads to explaining the ttest. Recalling prior knowledge of samples and populations can help the learner understand the content and retain it better as the learner can devote more cognitive capacity towards new knowledge on t-tests. Furthermore, according to van der Meij and van der Meij (2013), it is important to present users with the actual interface they will see when completing a given task. This way, the user is.
(26) VIDEO INSTRUCTION FOR STATISTICS SOFTWARE. 26. faced with the same image that he or she will encounter when executing the task in the future. For the current design, this was implemented when presenting the learner with procedures to perform the t-test in SPSS. As seen in Figure 9, an image of a laptop screen was presented in the video, and the narrator was seen opening the data file from the desktop before the SPSS interface was displayed.. Figure 9. A full image of a laptop is shown in the beginning of the second video so the user is presented with a similar image they will see when performing the task Reviews. In the current design, reviews were used to support retention processes. The reviews were designed to paraphrase and repeat only essential materials from the instruction. They were short (ranging from 29 seconds to 37 seconds), and aimed to remind learners of what they had just learned in a simple and concise manner. To add, the reviews sustained-attention by playing upbeat music in the background. Instruction that is longer than 4 minutes, which is the case for the total length of the current videos, may be prone to eventual loss of attention by the learners (Koumi, 2013). Therefore, although adding music to the reviews could distract learners, its effect could also provide a balance by having a positive effect on sustaining attention. The reviews also used the concept of desirable difference. Subtle design variations can be important for retention and recall (van der Meij & van der Meij, 2016). In the video, the reviews were displayed on a yellow background (see Figure 10), which made it more obvious for the learner that the section was a review. To add, the way the learner was addressed was different in.
(27) VIDEO INSTRUCTION FOR STATISTICS SOFTWARE. 27. the reviews. Instances of “You” in the narrative were replaced with “I”, which also aided learners to differentiate between the lesson and the review. Furthermore, changing instances of “You” to “I” allowed the review to be more actionorientated by removing the need for learners to process and recode statements into personal action plans (van der Meij & van der Meij, 2016). For example, the phrase, “You selected what you wanted to compare…” was changed to, “I selected what I wanted to compare…”.. Figure 10. Review from the third video displayed on yellow background and presented with music. Production. Production processes of learners are supported through the use of practice. Although the current video instruction did not incorporate practice directly into the instruction, learners were given the opportunity to practice their understanding of the content through a quiz and assignment, which are described in the succeeding section. Motivation. Motivation processes were supported in the video by using personalisation and goal reminders. The narrative for the current videos passed through various versions during prototyping. As Koumi (2003) suggests, the screens of the videos were drafted out prior to creating the narratives. Then, the narratives were spoken out in a conversational style to improve personalisation, and were transcribed. The transcribed versions were progressively improved in order to simplify and shorten. To add, Koumi (2003) suggests building confidence in learners through an informal and friendly presentation. For example, the current videos built confidence with, “You are going to learn how to compare means…and believe me, it’s not that complicated.”.
(28) VIDEO INSTRUCTION FOR STATISTICS SOFTWARE. 28. To add, Laurillard et al. (2000) suggest including a clear problem statement and repeated goal reminders of the instruction. For example, the problem statement of the video was made clear by explaining it through a narrative and demonstrating it visually. The visuals from the problem statement appeared throughout the video and acted as mementos of the overall goal, which is demonstrated in Figure 11.. The overall goal of the video was explained using visuals and a narrative, “Are people married to goats more intelligent than people not married to goats?”. The visuals that were used to demonstrate the overall goal were also used throughout the instruction, for example to explain hypotheses.. Figure 11. Visuals and a narrative were used for the overall goal of instruction, and visual mementos acted as goal reminders throughout the instruction.
(29) VIDEO INSTRUCTION FOR STATISTICS SOFTWARE. 29. Chapter 3: Evaluation and Reflection After designing and developing the video instruction, it was shared to students at the University of Twente. The remainder of this report provides an analysis of how the video instruction contributed to learning for students in the Inferential Statistics course. Video-playing behaviours were collected and students were assessed for understanding of content through an immediate post-test and a delayed post-test. From the data collected, three focus areas for evaluation and reflection in this study were identified. First, the video-playing behaviours of students were evaluated using total percentage of videos watched and video engagement throughout the videos. Second, the performance of students on learning assessments was analysed using scores on an immediate and delayed post-test. Third, the effect of video reviews was evaluated by comparing video-playing behaviours and learning assessments between students with and without video reviews.. Method Participants Participants for this study were pre-master students at the University of Twente enrolled in the Inferential Statistics course. The students consisted of Dutch and international students from non-engineering programs. All students were required to take the Inferential Statistics course in order to participate in relevant Master programs at the University, unless they had already proved sufficient knowledge for relevant content in past studies. The pre-requisite course for Inferential Statistics, Research Methodology and Descriptive Statistics, is taken by students in the previous quartile, unless they were exempt from it. Some students were only exempt from the pre-requisite course, but were still required to take the Inferential Statistics course. All students enrolled in the Inferential Statistics course (n = 133) were randomly and blindly assigned to the experimental condition with video reviews and the control condition without video reviews. Students could opt-out of participating in the study. Only students that at least logged on to watch the video instruction and completed the immediate post-test were identified as participants and included in the analysis. One outlier from the control condition was removed for suspected technical issues in viewing pattern tracking. There were 54 participants in the experimental condition and 55 participants in the control condition.. Instruments Videos. Three videos were uploaded to SproutVideo, a video-hosting platform that tracks viewing patterns of users. The platform tracks how many times each second of the video is watched by each viewer. The first video, Introducing the t-test, was 2 minutes and 59 seconds. The second.
(30) VIDEO INSTRUCTION FOR STATISTICS SOFTWARE. 30. video, Performing a t-test in SPSS, was 1 minute and 51 seconds. The third video, Understanding SPSS output from a t-test, was 2 minutes and 56 seconds. Participants in the experimental condition were presented with the same videos, but with the addition of a review at the end of each video. The reviews were 37 seconds, 29 seconds, and 35 seconds, respectively. The videos were presented on a website. The website provided participants with a set of short instructions and links to each video and the quiz. The website was also viewable on mobile devices. Participants had the freedom to replay or skip sections of the videos. Post-test. The quiz acted as an immediate post-test and was created using Google Forms. The quiz consisted of 12 questions and was multiple-choice with a total of four options for each question, with one correct option. The questions covered content from the learning objectives for the video instruction from Figure 2 (see page 15), and were adapted from various textbooks and their associated online student resources (e.g., Statistics in Psychology, Statistics for Managers, Stats Data and Models, Discovering Statistics Using IBM SPSS). Examples of two questions are given. Refer to Appendix A for the full multiple choice test. Factual knowledge: What symbol is best used to indicate standard deviation of a sample? a) µ b) s c) ӯ d) σ Conceptual knowledge: How does the shape of a t-distribution change as the sample size increases? a) It becomes broader b) It becomes skewed c) It becomes more normal d) It becomes flatter Reliability of the post-test using Cronbach’s α was calculated (α = 0.54). Using Cronbach’s α for reliability of the current test does not provide a relevant measure as the multiple-choice test measured various concepts and asked for a diverse set of knowledge. Delayed Post-test. All students enrolled in the Inferential Statistics course are required to complete an assignment on t-tests, which acted as a delayed post-test for this study. The assignment was created and managed by the Inferential Statistics course professor and student assistants, and it was used with students in the previous year. The assignment consisted of two exercises that asked students to work with a dataset in SPSS to solve given problems. The problems extended beyond the scope.
(31) VIDEO INSTRUCTION FOR STATISTICS SOFTWARE. 31. of the videos as they not only related to independent samples t-tests, but also paired samples t-tests and one sample t-tests. For example, one question asked students to test if there is a significant difference in the amount of working hours between male and female students. Students were given the following template to answer the question, and they were asked to provide the relevant SPSS output. The total assignment was scored out of 10, and students would lose 0.25 points for incorrect or missing responses. Refer to Appendix B for the full assignment. Hypotheses: ……………………………………………………………………. Alpha: ………………………………………………………………………….. Test Statistic: …………………………………………………………………... P-value: ………………………………………………………………………… Statistical conclusion: ………………………………………………………….. Conclusion in words: ……………………………………………………………. Procedure All students enrolled in the Inferential Statistics course received an email asking to participate in the study. In the email, students could follow a link to a website where they could watch the videos and complete the quiz within one week. The students were told to work independently and that the task would take 15 minutes. They were also informed that the task could prepare them for the upcoming SPSS practical and assignment, but the results would not impact their grade in the Inferential Statistics course. All participants received the same communication, however the links directed them to either the experimental condition or the control condition. The videos could be played multiple times, and the number of times each second was watched by each viewer was tracked. The videos were accessible during the quiz, however, after one week, the videos and quiz were made unavailable to participants. Students received the assignment after the video and quiz were made unavailable. Students were randomly emailed different datasets and the assignment was made available on the course’s BlackBoard page. The different datasets prevented students from copying each other’s work. Students had one week to complete the assignment. A group of student assistants marked the assignments.. Analysis Video percentage watched and video engagement was used as a frame of reference for video-playing behaviours. Video percentage watched was the total percentage of the videos watched by the viewer. For example, if a student watched the first 50 seconds and last 10 seconds of a 100 second video, their video percentage watched is (50 + 10) / 100 = 60%. Video engagement percentage was calculated as total seconds watched divided by total seconds available to be watched. This way, replaying or skipping of the videos was also taken into account. For example, if a student replayed sections of a video and watched a total of 80 seconds of a 60 second video,.
(32) VIDEO INSTRUCTION FOR STATISTICS SOFTWARE. 32. their video engagement is (80 / 60) x 100 = 133%. Categories for engagement levels were created by grouping the participants in lower than average, average, and higher than average levels. The participants in lower than average had less than 100% total video engagement, and participants in higher than average had more than 100% total video engagement. The video engagement data for the reviews was looked into more granularly and criteria was added to classify participants into adjusted video conditions. Participants in the control condition or participants in the experimental condition who did not watch the majority of each review were classified as ‘Review not watched’. Participants in the experimental condition who watched the majority of each review were classified as ‘Review watched’. Watching the ‘majority of’ was classified as watching at least half of each review. This classification is referred to as ‘Adjusted video condition’. All learning assessment scores were converted to scores on a scale out of 10, which allowed them to be compared consistently. Not all participants had all scores as some students did not have to take the pre-requisite course or they did not complete the assignment from this experiment. Missing scores were omitted. Grades from last year’s Inferential Statistics assignment were also analysed and compared with assignment scores from participants in the current study. When comparing differences between the video conditions for video engagement or scores, two-sided tests were used with alpha levels of 0.05 for significance. Cohen’s d-statistic was used to indicate the effect size, classified as small for d = 0.2, medium for d = 0.5, and large for d = 0.8.. Results Video-Playing Behaviours There were 133 students that received an invitation to participate in the study, and 82.71% (n = 110) of students participated. From the participants, video percentage watched and total average engagement was high for the videos. Table 1 shows the video percentage watched for each video, and Table 2 shows the total video engagement by condition. Video percentage watched decreased slightly from the first video to the third video. Video engagement was higher for participants in the control condition, however the difference was not significant between conditions, t(107) = -1.08, p = 0.29. Table 1 Video percentage watched for each video Video 1 2 3. M (n = 109) 99.21 98.16 95.97. SD 5.58 6.93 14.06.
(33) VIDEO INSTRUCTION FOR STATISTICS SOFTWARE. 33. Table 2 Total video engagement for participants by condition Condition Review No review. n 54 55. M 112.48 120.66. SD 33.86 44.81. Looking at video engagement at a more granular level, results in Figure 12 show video engagement for each video. There is a heat map for each video in the experimental and control condition, and the heat maps are labelled according to how content in the videos was segmented. The heat maps use a three colour gradient scale to identify how video engagement changed throughout the videos. Light grey represents the minimum level of video engagement (83%), and black represents the maximum (169%). For example, in the third video without a review, the heat map is dark grey when p-value is being explained. This reveals that participants watched that section repeatedly. It is also noticeable that the lowest engagement levels are found at the last few seconds of the videos when closing remarks are being made, and during the reviews in the second and third videos..
(34) Figure 12. Video engagement for videos in each condition Min (83%). Legend. (a) Welcome back (b) Getting output (c) Completing equation (d) Making a conclusion. Max (169%). VIDEO INSTRUCTION FOR STATISTICS SOFTWARE 34.
(35) VIDEO INSTRUCTION FOR STATISTICS SOFTWARE. 35. Learning Assessments Scores. Table 3 shows scores from the pre-requisite course, as well as quiz and assignment scores from the current study. Students received two results from the pre-requisite course: (1) a result for descriptive statistics using SPSS from the assignment (RMDS SPSS), and (2) a result for research methodology theory from the exam (RMDS Theory). Regression analysis exploring correlations between the scores reveal quiz scores are positively and significantly correlated with RMDS theory scores (r = 0.44, p < 0.001, β = 0.57), and assignment scores are positively and significantly correlated with quiz scores (r = 0.24, p = 0.02, β = 0.12). Table 3 Learning assessment scores for participants Assessment RMDS SPSS RMDS Theory Quiz Assignment. n 87 86 109 99. M 8.78 6.75 6.79 8.97. SD 0.85 1.45 1.82 0.90. Past Year. In the past year, students in the Inferential Statistics course were given the same assignment as the current study. Assignment scores for the past year were compared with assignment scores of participants from this study who watched the videos and completed the quiz. On average, participants who watched the videos in the current study performed better on the assignment (M = 8.97, SD = 0.90), than students in the past year who did not have a video available to them (M = 8.35, SD = 1.54). The difference of 0.63 was significant, t(272.57) = 4.26, p < 0.001. Equal variance could not be assumed. This represents a small effect, d = 0.41, for students who had access to the video instruction. Scores by Video Engagement Level. Figures 13 and 14 reveal that lower than average levels of video engagement resulted in lower mean quiz and assignment scores. However, quiz scores did not improve substantially after the participants had reached average engagement, and assignment scores actually decreased when video engagement surpassed average..
Figure
+7


Related documents
This policy aims to ensure that all staff are aware of their responsibilities in relation to hand hygiene by outlining the principles behind hand hygiene, the appropriate
Get your fill on a New Orleans Bourbon Street tour, have a tipple at the Jim Beam distillery in Kentucky, look down upon the windy city from the 360 observatory and rock out in the
individuals with ASD exhibited reduced activation in response to dynamic facial expressions compared with the control group (Pelphrey et al. 2012) in some brain regions that
“The positive relationships that I have developed with my neighbors, my fellow local leaders, and the City of Boise make me confident that the Vista neighborhood can become
when reviewing applications for an authorization to carry out forest operations, when carrying out field activities associated with planning a harvest operation or when developing
DELETE Annex B - Basis of Payment (revised July 22, 2015) in its entirety; and INSERT Annex B - Basis of Payment (revised August 13, 2015) attached. (3) Reference: Closing
Markov model with Relex Reliability Studio* tool was used to assess the availability of the system with and without the security component. CACC implemented as a discrete-time
Arvidson NB, Mehta MP, Tome WA: Dose coverage beyond the gross tumor volume for various stereotactic body radiotherapy planning techniques reporting similar control rates for stage
