ISSN: 1816-949X
© Medwell Journals, 2019
Study the Copper Plasma Generated Laser-Induced Breakdown Spectroscopy
1
Noor M. Saadoon,
2Naseer M. Hadi and
3Sabah H. Sahaah
1, 3
Department Applied Science, University of Technology, Baghdad, Iraq
2
Ministry of Sciences and Technology, Laser Optoelectronic Center, Baghdad, Iraq
Abstract: In the present work, the optical emission spectra of Copper (Cu) plasma have been recorded and analyzed using the Laser Induced Breakdown Spectroscopy technique (LIBS). The emission line intensities and plasma parameters were investigated as a function of laser energy. The electron number density (ne) and electron Temperature (Te) were determined using the Boltzmann plot method and McWhirter criterion.
Measured values of ne and Te are in the range of 9323 K-11871 K k and (ne) is 2.3×10
16-2.6×10¹⁶ cmG3 at the
fundamental wavelength (1064 nm).
Key words: LIBS, copper plasma, plasma parameter, electron density number, determined, fundamental
INTRODUCTION
Laser Induced Breakdown Spectroscopy (LIBS) is a technique which was first reported in early 1960s and then reviewed by several researchers (Harilal et al., 2005). This sensitive technique is based on an optical detection for certain atomic and molecular species by monitoring their emission signals from the laser induced plasma. It provides a useful tool to determine the chemical and physical properties of a wide range of materials including metals, liquids, aerosols, plastics, minerals and biological tissues, etc. (Harilal et al., 2005; Pleslic and Andreic, 2005). It is a simple technique as compared with many other types of elemental analysis because of its straight forward experimental set-up. In this technique a pulsed laser is required to generate micro-plasma on the target surface (Tao et al., 2007). Elemental analysis is accomplished by study the emission from plasma plume. The characteristics of laser induced plasma depend upon several parameters characterizing the features of the target, properties of the ambient medium, laser wavelength and pulse duration etc. (O’Shay et al., 2007). The first direct spectral analysis made by LIBS can be attributed to Rung et al. (Abdellatif et al., 2010; Mayo et al., 2008). Copper is the most widely used metal for various applications of plasmonic materials due to its high electrical conductivity and optical properties. Gaudiuso et al. (2010) the objective of the present work was to characterize the laser induced copper plasma in term of spectral line intensities and plasma parameter (ne
and Te) under different laser power energy using LIBS
technique.
MATERIALS AND METHODS
[image:1.612.327.525.298.427.2]Experimental work: The experimental setup that used in this study consist from: Q-switched Nd:YAG (Quantel brilliant) laser operating at 1064 nm (6 ns pulse duration
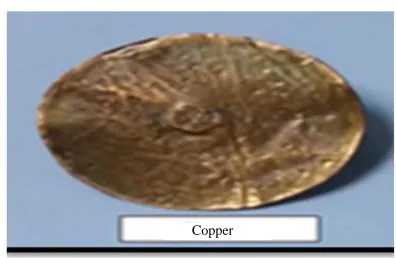
Fig. 1: Copper target
and 10 Hz repetition rate) was used as an ablation source with maximum pulse reach to 850 mJ per pulse. The laser pulse energy was varied by the flash lamp Q-switch delay through the laser controller and measured by an energy meter (Nova-Quantel P/niz01507). Optical system consist of: convex lens of 10 cm focal length, reflected mirrors made from brass with diameter about 50 mm and thickness about 5 mm. The emission spectra were obtained by recorded the emission with high intensity of shot under identical experimental conditions. The radiation emitted b he plasma were collected by anoptical fiber model ocean optic (high-OH, core diameter: 600 μm) having a collimating lens (0-450 field of view) placed at right angle to the direction of the laser beam. This optical fiber was connected with the HR 4000 spectrometer (Ocean optics Inc.). The HR 4000 spectrometer consist of 14 grating available with entrance slit 5, 10, 25, 100 or 200 mm, covering the spectrum range from 200-1100 nm with optical resolution of 0.03 nm (FWHM), integration time 3.8 msec-10 sec. The sample was mounted on a three-dimensional sample stage from ocean optics which was rotated to avoid the non-uniform pitting of the target. The copper target was 3.0 mm diameter and 0.3 cm thickness as show in Fig. 1.
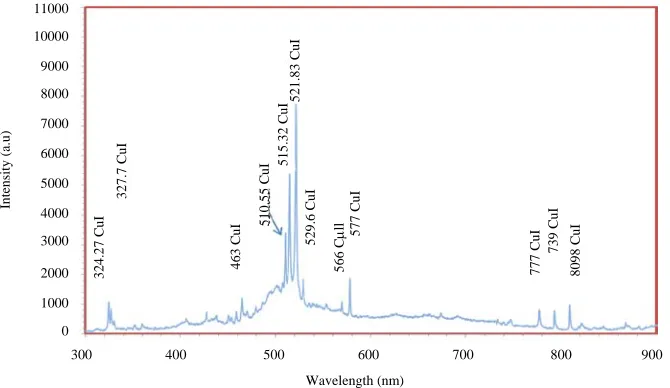
Fig. 2: Emission spectrum of neutral and ionized copper plasma generated by the 1064 nm laser at distance 5 mm, 81.5 mJ laser energy covering the region 300-900 nm spectral window
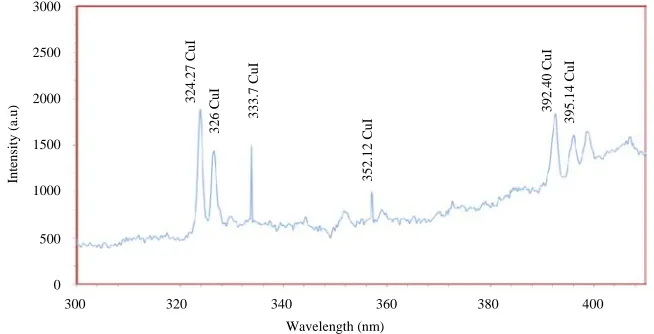
Fig. 3: Emission spectrum of neutral and ionized copper plasma generated by the 1064 nm laser at distance 5 mm, 81.5 mJ laser energy covering the region 300-400 nm spectral window
RESULTS AND DISCUSSION
The optical emission spectra of copper plasma: In the present research, copper plasma is generated using Nd:YAG laser at the first harmonic generated with 6 ns pulse duration 10 Hz repetition rate. The plasma emission was recorded as a definition of laser intensity to the surface of Cu target. Figure 2 shows the emission spectrum of copper plasma generated by laser energy at 81.2 mJ. Emission that recorded was covering the spectral region from 300-900 nm.
In Fig. 3 and 4 it is seen emission spectrum of copper plasma related to these spectrum region between 300-400 nm. Most of the lines in this region belong to emission of neutral copper. The lines at 324.75 and
333.78 nm are the strongest that are identified as 3d4P12P
3/2 to 4S 12S
1/2 and 3d4P1 2P
1/2 to 4S 1S
1/2 and
3d4S4P4F7/2 to 4S 22D
5/2 transitions, respectively.
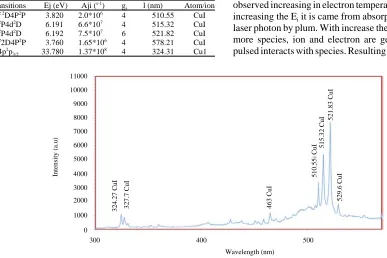
In Fig. 4 show the emission spectrum in the region between 400-550 nm. The dominating lines belong to emission of neutral copper besides a couple of lines attached to singly ionized copper the strongest lines of Cu I identified as 4d4d2D
5/2 to 4P 2P
3/2 at line
521.83 nm. The singly ionized line at 467.76 and 515.32 nm are identified as 3d 4S 5S2 D5/2 to 4P 4F
5/2 and 3d 4d 2D
5/2 to 4P 2P
1/2, respectively. It is noticed that the
lines of neutral copper are strong and sharp whereas that of singly ionized copper broad. The Cu II line at lower wavelength belongs to the 4P2 P
3/2 to 3d 4S 2 2 D
5/2
transition.
32
4.
27 C
u
I
33
3.
7 CuI
39
2.
4 CuI 46
3 C
u
I
50
0
CuI
51
0.
55 C
u
I
51
5.
32 C
u
I
52
1.
83 C
u
I
58
8.
6 CuI
65
5.
4 CuI
56
7 C
u
I
76
4 C
u
I
76
6 C
u
I
82
0.
41 C
uI
86
7.
8 CuI
7000
6000
5000
4000
3000
2000
1000
0
Wavelength (nm)
300 400 500 600 700 800 900
In
tens
ity
(a.u)
3000
2500
2000
1500
1000
500
0
Wavelength (nm)
300 320 340 360 380 400
In
tens
ity
(a.u)
32
4.
27 C
uI
32
6 C
uI
33
3.
7 CuI
35
2.
12 C
uI
39
2.
40 C
uI
39
5.
14 C
[image:2.612.141.468.342.509.2]Fig. 4: Emission spectrum of neutral and ionized copper plasma generated by the 1064 nm laser at distance 5 mm, 81.5 mJ laser energy covering the region 400-600 nm spectral window
Fig. 5: Emission spectrum of neutral and ionized copper plasma generated by the 1064 nm laser at distance 5 mm, 134.5 mJ laser energy covering the region 300-900 nm spectral window
When the laser energy increased the spectral lines intensities and widths increase with the increasing laser energy. As shows in the Fig. 5 and 6 the emission of copper plasma at 1064 nm laser wavelength and 134.5 mJ laser energy. The emission spectrum of copper plasma using nanosecond laser is shown as in the Fig. 6. The intensity of CuI lines are more pronounced at transitions [4p 2P-4d 2D], i.e., 515.324, [4p2P-4d2D] i.e.,
521.820 and [4s22D-4p2P] i.e., 510.554 nm while Cu II
lines such as [4p1F-6d3D] i.e., 324.7 nm and [5p3P-5d3D],
i.e., 577.721 nm have relatively low intensity. No Cu III lines were detected in these regions.
The plasma temperature: In the present research, the plasma temperature of the laser induced-copper plasma
has been determined using the Boltzmann plot method for which the plasma assumed to fulfill the LTE condition must be optically thin and the number densities in the excited states follow the Boltzmann distribution. Under these conditions, the electron temperature has been estimated using silver lines of the same ionization stage as give in Eq. 1:
(1)
ki ki k
ki k
N T
I E
In = In
-A g U T KT
Where:
Iki : The integrated line Intensity of the transition
involving upper level (k) and a lower level (I) lki : The transition wavelength
7000
6000
5000
4000
3000
2000
1000
0
Wavelength (nm)
400 425 450 475 500 525 550 575 600
In
tens
ity
(a.u) 56
6 C
uI
51
0.
55 C
uI
46
3 C
uI
50
0 C
uI
57
7 C
uI
58
8.
6 CuI
51
5.
32 C
uI
52
1.
83 C
uI
11000
10000
9000
8000
7000
6000
5000
4000
3000
2000
1000
0
Wavelength (nm)
300 400 500 600 700 800 900
In
tens
ity
(a.u)
32
4.
27 C
uI
32
7.
7 CuI
46
3 C
uI 51
0.
55 C
uI 51
5.
32 C
uI
52
1.
83 C
uI
52
9.
6 CuI
56
6 C
ll 577 C
uI
77
7 C
uI
73
9 C
uI
8
098
[image:3.612.132.467.315.509.2]Aki : The transition probability
gk : The statistical weight of level (k)
N (T) : The partition function Ek : The energy of upper level
(K) : The Boltzmann constant (T) : The exaction Temperature
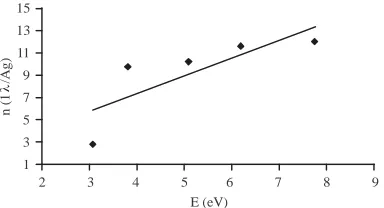
Plot between Ln (Iλ/gA) and upper level Energy
(Ek). The slope of this plot is equal to (-1/kT). From this
[image:4.612.82.469.445.703.2]slope, plasma Temperature (T) can easily be estimated without knowing the partition function. The line identifications and different spectroscopy parameter such as wavelength (l), (g) statistical weight, (A) transition probability and term E Energy (Miziolek et al., 2006) are listed in Table 1. Taking from NIST database (NIST). Five lines used to determine the plasma temperature by using Boltzmann plot method the copper lines is (510, 515, 521, 342 and 578 nm). The electron temperature behavior was studied as a laser energy function of the plasma generated by 1064 nm wavelength of laser irradiance. The electron temperature at 81.5 mJ to be 9323 K until reach to 11871 K at 221 mJ with increase the laser energy the electron temperature increase it is noted that the electron temperature increases with the energy which is surely due to higher energy transfer at this energy level. The region near the surface of the target material constantly absorbs radiation during the exposure time of laser pulse, responsible for enables the electron to Table 1: Spectroscopy parameter of the singly/second ionized and Cu
line data take from reference (NIST) Transitions Ej (eV) Aji (s-1) g
j l (nm) Atom/ion 4S2 2D4P2P 3.820 2.0*106 4 510.55 CuI 4P2
P4d2
D 6.191 6.6*107
4 515.32 CuI 4P2P4d2D 6.192 7.5*107 6 521.82 CuI 4S2
2D4P2
P 3.760 1.65*106
4 578.21 CuI 3d4p2
p3/2 33.780 1.37*10 8
4 324.31 Cu1
gain temperature and so on (Noll, 2012). The higher value of the temperature near the surface is due to the absorption of laser radiation by inverse bremsstrahlung absorption process and decrease in the temperature is due to the fact that the thermal energy is converted rapidly into kinetic energy (Cremers and Radziemski, 2006). The kinetic energy is used to attain maximum expansion velocities and is responsible for decreasing plasma temperature way form the target surface during expansion. Ying et al. also reported similar results for ArF excimer laser irradiance (Unnikrishnan et al., 2010) Fig. 7 and 8 shows the Boltzmann plot that used to determine the electron temperature.
The electron density number: Electron density is given by McWhirter equation which is the condition for reached to smallest ND to ensure the warrant of the LTE (Singh and Thakur, 2007):
312 1/ 2 e
N 1.6*10 T E
When t (k) as plum temperature and ΔE (EV) it energy different between levels must been with local thermodynamic equilibrium. In our experiment the electron number density range satisfy the local thermodynamic equilibrium. When the laser focused on the target the ablated Cu surface take a placed with according to the density gradient plasma fasting expansion (Hanif et al., 2012). Also the electron number density was calculated for different energy laser. It was observed increasing in electron temperatures and end with increasing the Ei it is came from absorption, reflection of
laser photon by plum. With increase the exaction flounce, more species, ion and electron are generated the laser pulsed interacts with species. Resulting in further heat and
Fig. 6: Emission spectrum of neutral and ionized copper plasma generated by the 1064 nm laser at distance 5 mm, 134.5 mJ laser energy covering the region 300-600 nm spectral window
11000
10000
9000
8000
7000
6000
5000
4000
3000
2000
1000
0
Wavelength (nm)
300 400 500
In
tens
ity
(a.u)
32
4.
27 C
uI
32
7.
7 CuI
46
3 C
uI
51
0.
55 C
uI 51
5.
32 C
uI 52
1.
83 C
uI
52
9.
15
13
11
9
7
5
3
1
2 3 4 5 6 7 8 9 E (eV)
n
(1
/
A
g
)
16 14 12 10 8 6 4 2 0
2 3 4 5 6 7 8 9 E (eV)
In
(1
/A
g
)
[image:5.612.85.277.94.198.2]λ
Fig. 7: Boltzmann plot for 5 neutral spectral line in 81.5 mJ by using 1064 nm for Nd:YAG laser
Fig. 8: Boltzmann plot for 5 neutral spectral line in 134.5 mJ by using 1064 nm for Nd:YAG laser ionization and respectively, increasing consumption of incoming laser pulsed (Hanif et al., 2011; Griem, 1974).
CONCLUSION
We have used Q-switched Nd:YAG laser at fundamental 1064 nm to study the laser produce copper plasma. The emission spectrum of the plasma reveals transitions of natural and singly ionizes copper. The electron temperature and the electron density number have been determine along the axial positions of the plasma plum. It is observed that the plasma parameter will increase with increase the laser energy from 81.5-134.5 mJ. For the electron temperature in 81.5 mJ to be 9323 K and for 134.5 mJ to be 9500 K and the electron density number was 2.3×10¹⁶ and
2.6×10¹⁶ cmG3.
REFERENCES
Abdellatif, G., H. Imam and Y.E.E.D. Gamal, 2010. Studying the role of ambient conditions in laser-induced al-plasma expansion. J. Korean Phys. Soc., 56: 300-308.
Cremers, D.A. and L.J. Radziemski, 2006. Handbook of Laser-Induced Breakdown Spectroscopy. John Wiley and Sons, Hoboken, New Jersey, USA., ISBN-13: 978-0-470-09299-6, Pages: 292.
Gaudiuso, R., M. Dell’Aglio, O.D. Pascale, G.S. Senesi and A. D. Giacomo, 2010. Laser induced breakdown spectroscopy for elemental analysis in environmental, cultural heritage and space applications: A review of methods and results. Sens., 10: 7434-7468.
Griem, H.R., 1974. Spectral Line Broadening by Plasmas. Academic Press, New York, USA., ISBN: 9780323150941, Pages: 424.
Hanif, M., M. Salik and M.A. Baig, 2011. Quantitative studies of Copper plasma using laser induced breakdown spectroscopy. Opt. Lasers Eng., 49: 1456-1461.
Hanif, M., M. Salik and M.A. Baig, 2012. Diagnostic study of Nickel plasma produced by fundamental (1064 nm) and second harmonics (532 nm) of an Nd: YAG laser. J. Mod. Phys., 3: 1663-1669.
Harilal, S.S., B. O’Shay, M.S. Tillack and M.V. Mathew, 2005. Spectroscopic characterization of laser-induced Tin plasma. J. Applied Phys., Vol. 98, No. 1, 10.1063/1.1977200
Mayo, R., M. Ortiz and M. Plaza, 2008. Measured stark widths of several Ni II spectral lines. J. Phys. B. At. Mol. Opt. Phys., Vol. 41, NO. 9. 10.1088/0953-4075/41/9/095702
Miziolek, A.W., V. Palleschi and I. Schechter, 2006. Laser-Induced Breakdown Spectroscopy (LIBS): Fundamentals and Applications. Cambridge University Press, Cambridge, England, UK., ISBN: 9780511541261, Pages: 640.
Noll, R., 2012. Laser-Induced Breakdown Spectroscopy, Fundamentals and Applications. 1st Edn., Springer, Berlin, Heidelberg, Germany, ISBN: 978-3-642-20667-2, Pages: 544.
O’Shay, B., F. Najmabadi, S.S. Harilal and M.S. Tillack, 2007. Nanosecond spectroscopy of expanding laser-produced tin plasma. J. Phys. Conf. Ser., 59: 773-777.
Pleslic, S. and Z. Andreic, 2005. Laser-produced plasmas on Mg, Al and Si surfaces. Fiz. A., 14: 107-118.
Singh, J.P. and S.N. Thakur, 2007. Laser Induced Breakdown Spectroscopy. 1st Edn., Elsevier, Amsterdam, Netherlands, ISBN: 9780444517340, Pages: 454.
[image:5.612.80.280.243.335.2]