Original citation:
Rajpoot, N. M. and Butt, I. (2012). A multiresolution framework for local similarity based image denoising. Pattern Recognition, 45(8), pp. 2938-2951.
Permanent WRAP url:
http://wrap.warwick.ac.uk/48852
Copyright and reuse:
The Warwick Research Archive Portal (WRAP) makes the work of researchers of the University of Warwick available open access under the following conditions. Copyright © and all moral rights to the version of the paper presented here belong to the individual author(s) and/or other copyright owners. To the extent reasonable and practicable the material made available in WRAP has been checked for eligibility before being made available.
Copies of full items can be used for personal research or study, educational, or not-for-profit purposes without prior permission or charge. Provided that the authors, title and full bibliographic details are credited, a hyperlink and/or URL is given for the original metadata page and the content is not changed in any way.
Publisher’s statement:
http://dx.doi.org/10.1016/j.patcog.2012.01.023
NOTICE: this is the author’s version of a work that was accepted for publication in Pattern Recognition. Changes resulting from the publishing process, such as peer review, editing, corrections, structural formatting, and other quality control mechanisms may not be reflected in this document. Changes may have been made to this work since it was submitted for publication. A definitive version was subsequently published in . Pattern Recognition, 45(8), pp. 2938-2951.
A note on versions:
The version presented here may differ from the published version or, version of record, if you wish to cite this item you are advised to consult the publisher’s version. Please see the ‘permanent WRAP url’ above for details on accessing the published version and note that access may require a subscription.
A Multiresolution Framework for Local Similarity based
Image Denoising
Nasir Rajpoota,∗
, Irfan Buttb
a
Department of Computer Science, University of Warwick, Coventry CV4 7AL, UK b
Banque Saudi Fransi, Riyadh, Saudi Arabia
Abstract
In this paper, we present a generic framework for denoising of images cor-rupted with additive white Gaussian noise based on the idea of regional similarity. The proposed framework employs a similarity function using the distance between pixels in a multidimensional feature space, whereby mul-tiple feature maps describing various local regional characteristics can be utilized, giving higher weight to pixels having similar regional characteris-tics. An extension of the proposed framework into a multiresolution setting using wavelets and scale space is presented. It is shown that the resulting multiresolution multilateral (MRM) filtering algorithm not only eliminates the coarse-grain noise but can also faithfully reconstruct anisotropic features, particularly in the presence of high levels of noise.
Keywords:
Image Denoising, Bilateral Filtering, Local Image Statistics
1. Introduction
Denoising of an image refers to the removal of noise from the observed image and is often used as a pre-processing step before understanding and analysis of the image scene can take place. Various non-linear filtering meth-ods have been proposed in the literature aimed at preserving edges during image denoising. Anisotropic diffusion [1], one of the most popular non-linear filtering methods, uses local conduction coefficients of the gradient magni-tude function allowing it to preserve as well as sharpen the edges. However, it
∗Corresponding author: [email protected]
*Manuscript
is well known that the original Perona & Malik scheme tends to oversharpen edges, is a slowly converging non-linear iterative process, and may result in a piecewise smoothed version of the image [2]. While the oversharpening and slow convergence issues may have largely been overcome by works such as regularized and robust anisotropic diffusion [3, 4], anisotropic diffusion remains ill-suited for denoising of images containing textured patterns.
Shrinkage methods in the transform domain approximate the image by modeling and efficiently representing important image features such as dis-continuities [5], edges [6, 7, 8], curves [9, 10, 11], contours [12, 13], ridges [14, 15], and textured regions [16, 17, 18, 19] present in the image or locally linear planes [20] in video sequences. Generally speaking, shrinkage methods first transform the image into some other domain, highlighting important image features, and thresholding the transform coefficients. Two major limi-tations of the shrinkage methods are that they exhibit (a) pseudo-Gibbs and (b) fake feature types of artifacts in images corrupted with medium to high levels of noise. The pseudo-Gibbs or ringing artifacts are generated due to there being insufficient number of coefficients for reconstruction of image fea-tures, while the fake featureartifacts such as those visible in contourlets [13] and wave atoms [19] result from the association of noisy image pixels with perceived image features.
The non-local means (NL-Means) algorithm proposed by Buades et al.
[21] demonstrated that spatial filtering could benefit from searching for pix-els of similar intensities in the whole image and averaging them. A major bottleneck of this type of approach, however, is the high computational com-plexity of a global search for pixels of similar intensity. Several fast adap-tations of NL-Means have been proposed in the literature [22, 23, 24, 25]. Notwithstanding all the recent advances, the base NL-Means suffers from
performance over several other state-of-the-art methods.
Bilateral filtering [29] is another non-linear filtering method which can be regarded as an extended version of the lowpass Gaussian filtering. In essence, it is a simple combination of a domain filter, similar to the Gaus-sian filter, and a range filter which is a GausGaus-sian function of local intensity differences. The main idea is that only perceptually analogous colors are averaged together to avoid unexpected color combination in images. Barash [30] unified anisotropic diffusion and non-linear bilateral filtering as another effective edge preserving filtering technique. However, one of the main lim-itations of bilateral filtering is that the range filter coefficients rely heavily on actual pixel intensity values, as it does not take into account any regional characteristics, which may in turn have been influenced by noise therefore potentially resulting in smoothed textured regions.
In order to overcome the limitations of bilateral filtering, Garnett et al.
[31] proposed a trilateral filter employing a local image statistic for identify-ing the noisy pixels. The trilateral filter proposed in [31] was mainly aimed at denoising images corrupted with impulse noise, although it was shown to be effective for removing Gaussian and mixed noise too. The weighting func-tion used by Garnettet al.’s trilateral filter contains spatial, radiometric, and impulsive components. A third weighting function, the impulsive component based on a rank-order statistic of absolute differences (ROAD), removes high frequency impulse noise. The resulting trilateral filter performs well in re-moving mixed noise as well as in rere-moving impulse noise. Another trilateral filter was presented in [32] for high contrast images and meshes. Recently, a working paper by Yu et al. [33] proposed a third weighting function based on the energy of steerable filters [34] and applied an improved version of the bilateral filter, named by the authors as multilateral filtering, to denoising of runway images.
its local neighborhood. Filtering based on features can proceed by either concatenating the features into a feature vector or by cascading the filters for each feature. In this work, we have chosen the former route for simplicity and efficiency reasons. This adaptive non-linear filtering results in feature (e.g., edge and texture) preserving images by giving larger weights tosimilarpixels and smaller weights to pixels that are different, thus similarities among pixels are not only defined by intensity of pixels but also by features associated with these pixels.
In the next section, we propose a local similarity based framework for image denoising. A comparison of various statistical and structural features, as discussed in Section 2, reveals that local energy is an effective measure of local similarity. We extend the proposed framework in a multiresolution setting in Section 3 and show in Section 4 that the multiresolution version of our algorithm is particularly effective for denoising images corrupted with high levels of noise.
2. The Proposed Framework
Since our method is a generalization of bilateral filtering, we provide here a brief description of bilateral filtering for the sake of completeness. Bilateral filters proposed by Tomasi & Manduchi [29] belong to a class of non-linear filters designed for edge preserving image denoising. They operate by convolving a given image with a combination of domain and range filters. The domain filter contains the Gaussian domain weights computed by the geometric closeness function D(i,j), where D(i,j) represents the Euclidean distance between the origin pixel at i and a nearby pixel at j. The range filter, on the other hand, contains Gaussian range weights computed using an intensity difference functionR(i,j), whereR(i,j) gives the absolute difference between intensity valuesI(i) andI(j) corresponding to locationsiandj. The range filter is such that the larger the difference between two intensity values at i and j, the smaller is the corresponding weight and vice versa. Let Gd,i
and Gr,i respectively denote the domain and range filters, as defined below:
Gd,i,j = exp −0.5[D(i,j)/σd]2
/X
j∈Ni
Gd,i,j, (1)
Gr,i,j = exp −0.5[R(i,j)/σr]2
/X
j∈Ni
∀j∈Ni, where Ni denotes the set of pixel coordinates in the local
neighbor-hood of the center locationi, andσdandσrdenote widths of the two Gaussian
kernels. A bilateral filter is simply a product of the domain filterGd,i and the
range filter Gr,i, where Gd,i ={Gd,i,j, ∀j ∈Ni} and Gr,i ={Gr,i,j, ∀j ∈Ni}.
A given image I is then convolved with the bilateral filter to obtain the denoised imageˆI. For the pixel at location i, ˆI(i) is obatined as follows,
ˆ
I(i) = (Gd,i·Gr,i) ∗ Ni (3)
∀i ∈ C, where C denotes a set of all image coordinates and Ni denotes the
neighborhood of pixel at location i as defined above.
As mentioned earlier in Section 1, one of the other major limitations of bilateral filtering is that the range filter coefficients rely heavily on actual pixel intensity values which may in turn have been influenced by noise. The range filter computed in this way may consider two noisy pixels to be similar when they happen to have similar intensity values only because of the influ-ence of noise. It assumes that the similarity of two pixels can be determined just by analyzing their intensity values. Furthermore, bilateral filtering does not take into account any regional (e.g., textural) features, which can often be computed from analysis of the local statistical or structural properties. Several variations on the theme of bilateral filtering can be found in the literature. Multiresolution bilateral filtering (MRB) [35] is a local hybrid de-noising method which employs both spatial domain bilateral filtering as well as wavelet shrinkage in order to remove coarse-grain (i.e., low frequency) noise from images. Yu et al. [36] recently proposed a denoising algorithm based on bilateral filtering on the result of denoising in the wavelet domain by modeling the wavelet coefficients using a trivariate Gaussian distribution. However, most of these methods also suffer from the limitations inherent to bilateral filtering.
In the next section, we present a generic framework for image denoising based on the weighted averaging of image pixels using the idea of regional similarity in order to overcome the above limitations.
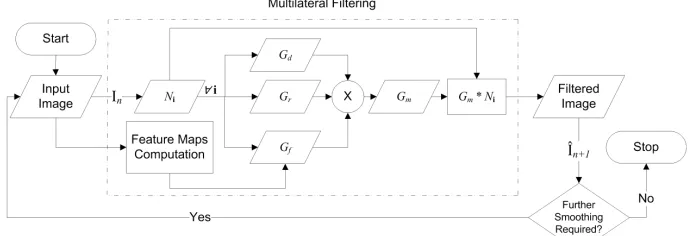
2.1. The Proposed Framework
Figure 1: The Proposed Iterative Multilateral Filtering Framework
versa. By the same token, if two pixels belong to a similar kind of edge feature in the image, this should also be reflected by a relatively high value of the similarity function. Once a suitable set of features has been computed, the algorithm proceeds by computing the domain and range filters, as described in the previous section, as well as the feature filter. As stated earlier in Section 1, the computed features are concatenated in the form of a feature vector fi = {f1(i), f2(i), . . . , fK(i)}, where fk(i) denotes the kth feature for
the pixel atiandK denotes the total number of features computed per pixel. The adaptive feature filter is then defined as follows,
Gf,i,j = exp −||fi−fj||2/2σf2
/X
j∈Ni
Gf,i,j, (4)
∀j∈Ni, where Ni is as defined above andσf is width of the Gaussian kernel
associated with the feature filter. Let Gf,i ={Gf,i,j, ∀j ∈ Ni}. The filtered
image ˆI can then be computed by taking a convolution of the input image I
with the product Gm,i of the three Gaussian kernels as given below,
Gm,i = (Gd,i·Gr,i·Gf,i). (5)
For a particular pixel at location i, the denoised intensity value is computed as follows,
ˆ
I(i) = Gm,i ∗ Ni, (6)
∀i∈ C. This completes one iteration of multilateral filtering.
2.2. Feature Normalization
to have a zero mean and a unit variance as follows,
fk(i)←−
fk(i)−µk
σk
(7)
whereµkandσkrespectively denote mean and standard deviation of values of
thekth feature for all pixels. Normalization of all features in this way ensures that equal weight is given to all and no single one is allowed to dominate.
Normalization of features in this way works well when the images are corrupted by Gaussian noise. But if the image is corrupted by a noise other than Gaussian, for example impulse noise, we may need to use some other linear transformation technique to normalize the features. This is because a linear transformation does not change the distribution of the data whereas the normalization in equation (7) has the potential of modifying the distribution of fk(i).
2.3. Iterative Multilateral Filtering
Although the original idea of bilateral filtering was non-iterative, Barash [30] showed that an iterative application of bilateral filtering may be required in images with high levels of noise. Using the robust median estimate [37] for noise standard deviation σn in the smoothed image, we can determine if
further smoothing is required. If so, another iteration of multilateral filtering is performed on the resultInof the previous iteration to obtain ˆIn+1. Needless
to say, we start with I0 =I.
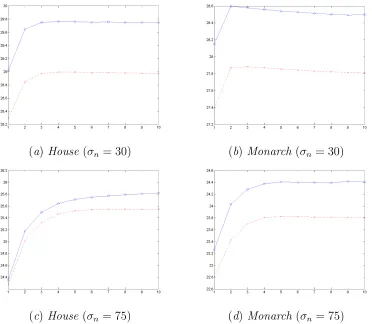
Experiments with iterative bilateral and iterative multilateral filtering were conducted by increasing the number of iterations for a fixed level of noise. Results of these experiments on the House and Monarch images (cf. Fig. 5) for a total of ten iterations and two different noise levels σn = 30
(medium noise level) and σn = 75 (high noise level) are shown in Fig. 2.
It can be observed in these results that near-optimal denoising results were obtained within 2–3 iterations for medium noise level (σn = 30) with not
much improvement gained from any further iterations. For high level of noise (σn = 75), however, small but steady improvements continue to be
(a)House (σn= 30) (b) Monarch (σn= 30)
[image:9.612.134.506.132.456.2](c) House(σn = 75) (d) Monarch(σn = 75)
Figure 2: Plots of PSNR (dB) against number of iterations for bilateral (dashed line with red×’s) and multiatleral filtering (solid line with blueo’s) for HouseandMonarchusing (a,b)σn= 30 and (c,d)σn= 75.
We believe this behavior may be due to the piecewise smooth nature of this particular image. For a fair comparison with other published algorithms though, in the remainder of this paper we run our method with one iteration only.
2.4. Experiments using Local Statistical and Structural Features
denoising purposes. Second, how the proposed method fares as compared to the original bilateral filtering (BF) and other state-of-the-art methods.
To answer the first question, we conducted experiments with a number of local statistical features such as local energy (E) defined as the sum of square of pixel intensity values in a local neighborhoodNi for some arbitrary
pixel location i, local variance (V) defined over Ni, local median (M) defined
as the median of pixel intensity values inNi, local entropy defined over pixel
intensity values in Ni and two combinations of these features namely energy
and median (M,E), and energy and variance (V,E). Experiments were also conducted using two local structural features: multiscale wavelet edge maps (Edge) [38] and pyramidal histograms of orientation gradients (Phog) features [39].
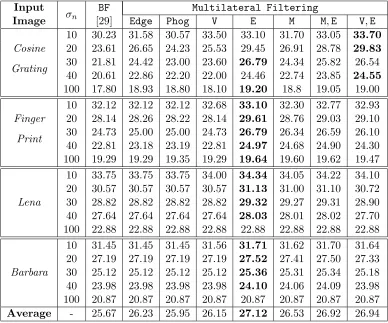
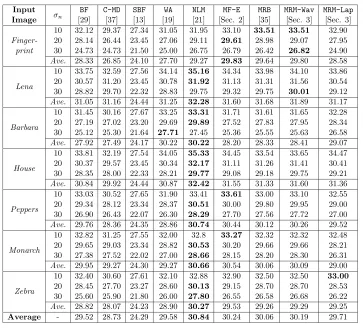
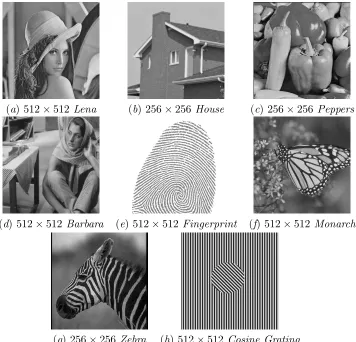
Experimental results for four 256-level greyscale images, each of a 512× 512 resolution and shown in Fig. 5, are given in Table 1. Two of these images contain textural patterns: Cosine Grating, a synthetic image containing two cosine waves, and a Fingerprint image. The other two images are taken from the standard real-world test image databases: Lena image consisting of relatively smooth regions and Barbara containing fine periodic textures at different orientations. Denoising performance is measured in terms of the Peak Signal to Noise Ratio (PSNR). For each greyscale test image, five noisy versions were created by adding white Gaussian noise with standard deviations 10, 20, 30, 40, and 100. The parameters of bilateral filtering were set as follows: the window size is 11×11, σd = 1.8, whereas σr is calculated
in a way that PSNR computed from output image and original image is maximized. For our proposed method, we set the same parameter values for σd,σr for bilateral filtering as suggested in [29] to give a fair comparison. The
value of σf is adjusted to maximize the PSNR. It can be seen from Table
1 that while the proposed multilateral filtering with a combination of local energy and variance achieves a PSNR gain of up to 6.22dB over the best bilateral filtering result in case of theCosine Gratingimage atσn= 20, local
energy E is the overall winner. This is due to the fact that measures of local variation, such as local entropy or local variance, are more sensitive to noise than local energy which has a low-pass effect. A more detailed analysis of local energy is given in the next section.
In order to address the second question posed at the start of this section, a detailed comparative evaluation of multilateral filtering with local energy (Multilateral E) is provided in Section 4, Tables 2 and 3. It is worth
Input
σn BF Multilateral Filtering
Image [29] Edge Phog V E M M,E V,E
Cosine
10 30.23 31.58 30.57 33.50 33.10 31.70 33.05 33.70 20 23.61 26.65 24.23 25.53 29.45 26.91 28.78 29.83
Grating 30 21.81 24.42 23.00 23.60 26.79 24.34 25.82 26.54
40 20.61 22.86 22.20 22.00 24.46 22.74 23.85 24.55 100 17.80 18.93 18.80 18.10 19.20 18.8 19.05 19.00
Finger
10 32.12 32.12 32.12 32.68 33.10 32.30 32.77 32.93 20 28.14 28.26 28.22 28.14 29.61 28.76 29.03 29.10
Print 30 24.73 25.00 25.00 24.73 26.79 26.34 26.59 26.10
40 22.81 23.18 23.19 22.81 24.97 24.68 24.90 24.30 100 19.29 19.29 19.35 19.29 19.64 19.60 19.62 19.47
Lena
10 33.75 33.75 33.75 34.00 34.34 34.05 34.22 34.10 20 30.57 30.57 30.57 30.57 31.13 31.00 31.10 30.72 30 28.82 28.82 28.82 28.82 29.32 29.27 29.31 28.90 40 27.64 27.64 27.64 27.64 28.03 28.01 28.02 27.70 100 22.88 22.88 22.88 22.88 22.88 22.88 22.88 22.88
Barbara
[image:11.612.111.499.126.449.2]10 31.45 31.45 31.45 31.56 31.71 31.62 31.70 31.64 20 27.19 27.19 27.19 27.19 27.52 27.41 27.50 27.33 30 25.12 25.12 25.12 25.12 25.36 25.31 25.34 25.18 40 23.98 23.98 23.98 23.98 24.10 24.06 24.09 23.98 100 20.87 20.87 20.87 20.87 20.87 20.87 20.87 20.87 Average - 25.67 26.23 25.95 26.15 27.12 26.53 26.92 26.94
Table 1: Results of Multilateral Filtering using Local Statistical and Structural Features in terms of PSNR (dB)
bilateral filter when the noise level is high, e.g., when σn = 100 forLena and Barbara. In the presence of heavy noise, local statistical features may not provide much extra information about the regional characteristics of a pixel. However, better estimates of regional similarity can be obtained at lower resolutions and hence better denoising results can be achieved by extending the proposed framework to multiple resolutions, as shown in Section 3.
2.5. Best of the Local Features
by Non-Local Means (NL-Means) [21], a popular denoising algorithm. Let Dnlm denote the dissimilarity function used by NL-Means and DE denote the dissimilarity function used by multilateral filtering with local energy. Both these functions are exponentiated with a negative sign and appropriate scaling factors (involving kernel bandwidths) in order to compute the values of a similarity function, which in turn affects the weights associated with the pixel values being averaged. The two dissimilarity functions can be expressed as follows,
Dnlm(i,j) =
X
k∈Ni,l∈Nj
(xk−xl)
2
(8)
and
DE(i,j) =
X
k∈Ni x2
k−
X
l∈Nj x2
l (9)
where Ni and Nj denote the neighborhoods of pixels at locations i and j,
respectively. Both Ni and Nj are of the same size and follow the same scan
order. For the sake of argument, let us assume that Ni and Nj are the same
for both Dnlm andDE. In other words, we assume that NL-Means is applied only locally1. It can be shown that D
E can be written in terms of Dnlm as
follows,
DE =Dnlm+ 2
X
k∈Ni,l∈Nj
xl|xk−xl|. (10)
For the sake of simplicity, we have dropped the arguments i,j from both the dissimilarity functions. From the above equation, DE can be expressed as a linear combination of Dnlm and sum of intensity differences between
corresponding neighboring pixels in Ni and Nj weighted by the values of
pixels in Nj. In other words, DE is sum of the l2-norm based Dnlm and a
scaled version of the l1-norm of pointwise intensity differences for Ni and
Nj. This allows DE to be more robust than the simple l2-norm based Dnlm
particularly in situations with high levels of noise, as illustrated later in Section 4, Table 3.
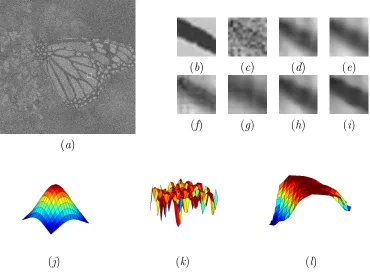
In order to illustrate the robustness of local energy based regional sim-ilarity in the presence of high levels of noise, we take 512×512 Monarch
1Without loss of generality, we make this assumption only to establish a relationship
image corrupted with AWGN and σn = 100 as an example. Fig. 3 shows
the comparative visual results of a 16 ×16 section of the Monarch image containing one of the wing lines, the feature map of noisy image using local energy by our proposed method works better than all the other techniques. It can be observed that both MF-Eand MRM-Wav (cf. Section 3) have sharper edges as compared to Fig. 3(d)–(f) where Gaussian filtering, bilateral filter-ing, and NL-Means were used for denoising. Notice also the profile of feature filter function Gf computed on the center pixel of the wing line. Despite the
presence of heavy noise (see Fig. 3(c)), the feature filter Gf shown in Fig.
3(l) corresponds well to the line feature as compared to the intensity-based range filter Gr shown in Fig. 3(k).
2.6. Choice of Parameters
The result of denoising an image using bilateral filtering may vary signif-icantly with the change in input parameters that make up the kernel band-widths for spatial distance and photometric similarity. Typical approach to get the best set of parameters is to use a trial and error method until the best denoising result is obtained. Clearly, this can be a laborious and time consuming task. To the best of our knowledge, there is no widely accepted solution for the selection of optimal σd andσr with firm theoretical backing.
Zhang & Gunturk [35] established an empirical relationship between σd ,σr
and the noise standard deviationσnin case of bilateral filtering. The authors
conducted extensive experimentation to minimize the Mean Squared Error (MSE) between original signal and noisy signal by varying the parameters σd, σr and σn. They showed that σd is relatively independent of the noise
standard deviation σn and that the ideal value for σd was empirically found
to be in the [1.5,2.1] interval while σn can be estimated using robust median
estimator [37]. But in case ofσr, the best value ofσris linearly related to the
noise standard deviation σn if σd is kept constant. Linearity among optimal
value of σr and σn still holds as σd is varied, resulting only in a change in
slope with an increase in slope as σd becomes higher.
In this work, we have followed the recommendations of Zhang & Gunturk [35] for selecting σd and σr whereas the PSNR is calculated by comparing
the denoised image with the original image. As forσf, it is adjusted so as to
(a)
(b) (c) (d) (e)
(f) (g) (h) (i)
[image:14.612.121.491.128.405.2](j) (k) (l)
Figure 3: Illustration of the Idea of Local Energy based Filtering
(a) The 512×512 Monarchimage corrupted with AWGN,σn= 100; (b)–(i) show a
16×16 section of the image containing one of the wing lines in the following order: (b) Original, (c) Noisy, (d) Denoised with a 5×5 Gaussian kernel, (e) Bilateral filtering result, (f) NL-Means filtering [21] result, (g) Local energy map using an 11×11 window, (h) Result of Multilateral Filtering withE, (i) Result of MRM-Wav (Section 3); (j)–(l) Filtering kernels in the order Gd,Gr, and Gf.
proposed recently by van de Ville & Kocher [25] for the non-local means al-gorithm may be extended for our method too.
3. Multiresolution Multilateral (MRM) Filtering
multiresolution framework [35], which performs filtering on low frequency wavelet subbands at different resolutions. The coarse-grain noise can be eas-ily removed at higher scales. Multiresolution bilateral (MRB) Filtering [35] is an extension of bilateral filtering in which a bilateral filter is applied to the approximation (low-frequency) subbands and BayesShrink [37] is applied to high frequency subbands of the wavelet decomposition. One limitation of the MRB filtering method though is that, just as in case of bilateral filtering [29], the range filter coefficients rely heavily on actual pixel intensity values which may in turn have been influenced by noise. The range filter coefficients computed in this way may consider two noisy pixels to be similar when they happen to have similar intensity values due to the influence of noise, and so MRB filtering does not take into account local statistical or structural characteristics of the two noisy pixels. The other notable problem that MRB faces is the occurence of pseudo-Gibbs phenomena in the vicinity of discon-tinuities due to its employing a wavelet decomposition and BayesShrink [37] to denoise the high frequency bands.
In this section, we propose multiresolution multilateral (MRM) filtering which aims to overcome the limitations of both bilateral and MRB filtering. We show that MRM filtering is an effective filtering method for denoising images with textured patterns as well as faithfully reconstructing discontinu-ities such as edges and curvilinear features in images. Two variants of MRM filtering are proposed: MRM in the wavelet domain and MRM in the scale space. In the remainder of this paper, we present the algorithmic details of these two variants of MRM filtering and present experimental results to demonstrate their effectiveness for denoising images.
3.1. MRM in the Wavelet Domain
In this section, we extend the proposed method of multilateral filtering described in Section 2 in a multiresolution framework, termed as MRM-Wav. This extension bears similarity to that of bilateral filtering in MRB [35]. However, one major difference is that our proposed method employs feature filter alongwith domain and range filters on multiple scales to denoise the image. Let Wn(I) ={HL1, LH1, HH1, . . . , HLn, LHn, HHn, LLn}, where I
denotes the input image andHLj, LHj, HHj, LLj respectively denote thej
-level horizontal detail, vertical detail, diagnoal detail, and lowpass subbands. The values of σr and σf are scaled by a factor of (
√
2)j taking into account
value ofσd remains the same for all levels of the wavelet decomposition. The
algorithmic details of MRM-Wav are given in Algorithm 1.
Algorithm 1 Multiresolution Multilateral Filtering in the Wavelet Domain (MRM-Wav)
1: procedure MRMfilteringWaveletDomain(I, n)
2: {HL1 , LH1
, HH1
, . . . , HLn, LHn, HHn, LLn
} ← Wn(I) ⊲ Compute
n-level wavelet transform 3: for j ←n, n−1. . . ,1 do
4: HLdj ← BS(HLj) ⊲Apply BayesShrink [37] on the jth level high
frequency subbands 5: LHdj ← BS(LHj)
6: HHdj ← BS(HHj)
7: if j = 1 then,
8: LLcj ← MF(LLj) ⊲ Apply multilateral filtering onLL1 9: ˆI ← W−1
1 (dHL
j
,LHdj,HHdj,LLcj) ⊲ Reconstruct the preliminary denoised image
10: else
11: LLcj−1 ← W−1 1 (HLd
j
,LHdj,HHdj,LLcj) ⊲ Take 1-level inverse wavelet transform
12: end if
13: end for
14: ˆI ← MF(ˆI) ⊲Apply multilateral filtering again on ˆI
15: return ˆI 16: end procedure
3.2. MRM in Scale Space
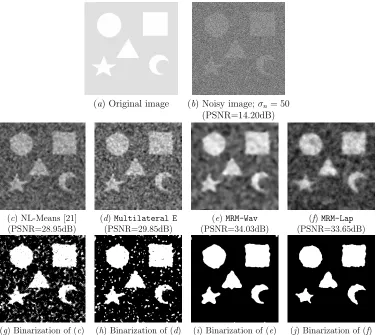
(a) Original image (b) Noisy image;σn= 50 (PSNR=14.20dB)
(c) NL-Means [21] (d)Multilateral E (e)MRM-Wav (f)MRM-Lap
(PSNR=28.95dB) (PSNR=29.85dB) (PSNR=34.03dB) (PSNR=33.65dB)
[image:17.612.120.497.124.459.2](g) Binarization of (c) (h) Binarization of (d) (i) Binarization of (e) (j) Binarization of (f)
Figure 4: Results of Denoising and Binarization using Otsu’s thresholds for 256×256
Shapes
n-level Laplacian pyramid operator given by, Ln(I) ={H1, H2, . . . , Hn, Ln},
whereIdenotes the input image, Hj,j = 1, . . . , n, denote the high frequency
Laplacian subband andLndenotes the lowest resolution and lowest frequency
Gaussian approximation subband. The values of σd, σr, and σf remain
un-altered for different levels of the Laplacian pyramid. The algorithmic details of MRM-Lap are given in Algorithm 2.
3.3. The Effectiveness of MRM
Algorithm 2 Multiresolution Multilateral Filtering in the Scale Space (MRM-Lap)
1: procedure MRMfilteringScaleSpace(I, n)
2: {H1, H2, . . . , Hn, Ln} ← Ln(I) ⊲ Compute n-level Laplacian pyramid
3: for j ←1,2, . . . , n do
4: Hˆj ← T IWP(Hj) ⊲ Denoise Hj using TIWP shrinkage [41]
5: Hj ←Hˆj
6: end for
7: ˆI ← L−1
n (H1, H2, . . . , Hn, Ln) ⊲Compute inverse Laplacian pyramid
8: {H1, L1} ← L1(ˆI) ⊲ Compute 1-level Laplacian pyramid 9: Lˆ1 ← MF(L1) ⊲Apply multilateral filtering on L1 10: ˆI ← L−1
1 (H1, L1) ⊲ Compute 1-level inverse Laplacian pyramid 11: ˆI ← MF(ˆI) ⊲Apply multilateral filtering again on ˆI
12: return ˆI 13: end procedure
consisting of geometric shapes against a flat background. Visual results of denoising with NL-Means [21],Multilateral E,MRM-Wav, andMRM-Lap (Sec-tion 3.2) can be seen in Fig. 4(c)–(f). Binarized versions of the denoising results using a simple thresholding operation are shown in Fig. 4(g)–(j). Thresholds were automatically selected using Otsu’s method [42]. It can be observed from these binarized results that both MRM-Wav and MRM-Lap pro-duce arguably better results for detection of the shapes’ regions as compared to NL-Means. Such a method can be used for detection of objects against the background in a highly noisy environment.
4. Experimental Results
give a fair comparison with other published methods.
Denoising experiments were conducted on seven of the eight 256-level greyscale images shown in Fig. 5. Five of these images are taken from the standard real-world test image databases: Lena, Houseand Peppers im-ages have relatively smooth regions, while Barbara contains fine periodic textures at different orientations and Fingerprint consists mostly of coarse level anisotropic oscillatory patterns. Two other images were used in the testbed: Monarch image containing spotty patterns and coarse strongly ori-ented features (the wing lines), Zebra image containing periodic textures of coarse level anisotropic oscillatory features and smooth regions. The last four images were chosen to investigate the comparative performance of our algo-rithms on images containing approximately periodic textures and strongly oriented features or patterns, particularly in the presence of high levels of noise. Although Multilateral E was shown to achieve significant PSNR gains for the Grating image in Section 2, that image is omitted from these experiments due to its purely synthetic and somewhat artificial nature. Three levels of wavelet transform (for MRM-Wav) and Laplacian pyramid (MRM-Lap) were computed, as one risks blurring the lowpass band and introducing ring-ing artifacts if a higher number of levels of the transforms is used. For comparison of objective quality, denoising results in terms of the PSNR are presented for three methods presented in this paper, namely Multilateral E
or MF-E(Section 2), MRM-Wav, and MRM-Lap (Section 3) in comparison to six other published methods: (1) the original bilateral filtering (BF) [29], (2) one of its recent variants known as saliency bilateral filtering (SBF) [43], two of the recently proposed transform-domain shrinkage methods in (3) Contourlet MD orC-MD [13] in the multi-scale contourlet domain with sharp localization in frequency and (4) wave atoms (WA) by Demanet & Ying [19] which aim to achieve good localization in space and frequency using Villemoes’ wavelet packets [44] in the frequency domain, (5) a multiresolution version of bilateral filtering (MRB) [35], and (6) the standard non-local means filtering (NL-Means
or NLM) [21] algorithm.
Two sets of experiments were conducted on the test images varying the level of Gaussian white noise from low–medium range (σn = 10,20,30) to
high levels of noise (σn = 50,75,100). It is worth noting that a large body of
Input σn
BF C-MD SBF WA NLM MF-E MRB MRM-Wav MRM-Lap
Image [29] [37] [13] [19] [21] [Sec. 2] [35] [Sec. 3] [Sec. 3] 10 32.12 29.37 27.34 31.05 31.95 33.10 33.51 33.51 32.90
Finger- 20 28.14 26.44 23.45 27.06 29.11 29.61 28.98 29.07 27.95
print 30 24.73 24.73 21.50 25.00 26.75 26.79 26.42 26.82 24.90
Ave. 28.33 26.85 24.10 27.70 29.27 29.83 29.64 29.80 28.58
Lena
10 33.75 32.59 27.56 34.14 35.16 34.34 33.98 34.10 33.86 20 30.57 31.20 23.45 30.78 31.92 31.13 31.31 31.56 30.54 30 28.82 29.70 22.32 28.83 29.75 29.32 29.75 30.01 29.12
Ave. 31.05 31.16 24.44 31.25 32.28 31.60 31.68 31.89 31.17
Barbara
10 31.45 30.16 27.67 33.25 33.31 31.71 31.61 31.65 32.28 20 27.19 27.02 23.20 29.69 29.89 27.52 27.83 27.95 28.34 30 25.12 25.30 21.64 27.71 27.45 25.36 25.55 25.63 26.58
Ave. 27.92 27.49 24.17 30.22 30.22 28.20 28.33 28.41 29.07
House
10 33.81 32.19 27.54 34.05 35.33 34.45 33.54 33.65 34.47 20 30.37 29.57 23.45 30.34 32.17 31.11 31.26 31.41 30.41 30 28.35 28.00 22.33 28.21 29.77 29.08 29.18 29.75 29.21
Ave. 30.84 29.92 24.44 30.87 32.42 31.55 31.33 31.60 31.36
Peppers
10 33.03 30.52 27.65 31.90 33.41 33.61 33.00 33.10 32.55 20 29.34 28.12 23.34 28.37 30.51 30.00 29.80 29.95 29.00 30 26.90 26.43 22.07 26.30 28.29 27.70 27.56 27.72 27.00
Ave. 29.76 28.36 24.35 28.86 30.74 30.44 30.12 30.26 29.52
Monarch
10 32.82 31.25 27.55 32.00 32.8 33.27 32.32 32.32 32.48 20 29.65 29.03 23.34 28.82 30.53 30.20 29.66 29.66 28.21 30 27.38 27.52 22.02 27.00 28.66 28.15 28.20 28.30 26.31
Ave. 29.95 29.27 24.30 29.27 30.66 30.54 30.06 30.09 29.00
Zebra
10 32.40 30.60 27.61 32.10 32.88 32.90 32.50 32.50 33.00 20 28.45 27.70 23.27 28.60 30.13 29.15 28.70 28.70 28.53 30 25.60 25.90 21.80 26.00 27.80 26.55 26.58 26.68 26.22
[image:20.612.125.488.121.449.2]Ave. 28.82 28.07 24.23 28.90 30.27 29.53 29.26 29.29 29.25 Average - 29.52 28.73 24.29 29.58 30.84 30.24 30.06 30.19 29.71
Table 2: Comparative Image Denoising Results in terms of PSNR (dB) for Low–Medium Noise Levels
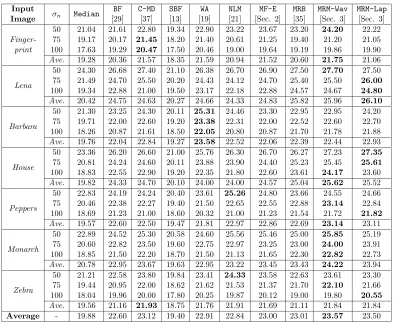
4.1. Experiments with Low–Medium Noise Levels
In Table 2, a comparison of denoising results for the test images cor-rupted with low–medium noise levels (σn = 10,20,30) is presented. It can
be seen from this Table that although NL-Means is on average 0.6dB better than MF-E with MRM-Wav close behind, there are a few instances (Peppers,
Monarch, and Zebra) where either of the two proposed methods yields the best PSNR value at σn = 10. It is also worth noting that the proposed
methods compare favorably with all the other six published methods for
Fingerprint at all three noise levels, on the whole nearly 3dB better than
Contourlet MD, nearly 2.1dB better than wave atoms, and nearly 0.6dB better than NL-Means. This behavior for Fingerprint continues at σn = 50,
Input
σn Median
BF C-MD SBF WA NLM MF-E MRB MRM-Wav MRM-Lap
Image [29] [37] [13] [19] [21] [Sec. 2] [35] [Sec. 3] [Sec. 3] 50 21.04 21.61 22.80 19.34 22.90 23.22 23.67 23.20 24.20 22.22
Finger- 75 19.17 20.17 21.45 18.20 21.40 20.61 21.25 19.40 21.20 21.05
print 100 17.63 19.29 20.47 17.50 20.46 19.00 19.64 19.19 19.86 19.90
Ave. 19.28 20.36 21.57 18.35 21.59 20.94 21.52 20.60 21.75 21.06
Lena
50 24.30 26.68 27.40 21.10 26.38 26.70 26.90 27.50 27.70 27.50 75 21.49 24.70 25.50 20.20 24.43 24.12 24.70 25.40 25.50 26.00 100 19.34 22.88 21.00 19.50 23.17 22.18 22.88 24.57 24.67 24.80
Ave. 20.42 24.75 24.63 20.27 24.66 24.33 24.83 25.82 25.96 26.10
Barbara
50 21.30 23.25 24.30 20.11 25.31 24.46 23.30 22.95 22.95 24.20 75 19.71 22.00 22.60 19.20 23.38 22.31 22.00 22.52 22.60 22.70 100 18.26 20.87 21.61 18.50 22.05 20.80 20.87 21.70 21.78 21.88
Ave. 19.76 22.04 22.84 19.27 23.58 22.52 22.06 22.39 22.44 22.93
House
50 23.36 26.20 26.60 21.00 25.76 26.30 26.70 26.27 27.23 27.35 75 20.81 24.24 24.60 20.11 23.88 23.90 24.40 25.23 25.45 25.61 100 18.83 22.55 22.90 19.20 22.35 21.80 22.60 23.61 24.17 23.60
Ave. 19.82 24.33 24.70 20.10 24.00 24.00 24.57 25.04 25.62 25.52
Peppers
50 22.83 24.19 24.24 20.40 23.61 25.26 24.80 23.66 24.55 24.66 75 20.46 22.38 22.27 19.40 21.50 22.65 22.55 22.88 23.14 22.84 100 18.69 21.23 21.00 18.60 20.32 21.00 21.23 21.54 21.72 21.82
Ave. 19.57 22.60 22.50 19.47 21.81 22.97 22.86 22.69 23.14 23.11
Monarch
50 22.89 24.52 25.30 20.58 24.60 25.56 25.46 25.00 25.85 25.19 75 20.60 22.82 23.50 19.60 22.75 22.97 23.25 23.00 24.00 23.91 100 18.85 21.50 22.20 18.70 21.50 21.13 21.65 22.30 22.82 22.73
Ave. 20.78 22.95 23.67 19.63 22.95 23.22 23.45 23.43 24.22 23.94
Zebra
50 21.21 22.58 23.80 19.84 23.41 24.33 23.58 22.63 23.61 23.30 75 19.44 20.95 22.00 18.62 21.62 21.53 21.37 21.70 22.10 21.66 100 18.04 19.96 20.00 17.80 20.25 19.87 20.12 19.00 19.80 20.55
[image:21.612.112.508.123.449.2]Ave. 19.56 21.16 21.93 18.75 21.76 21.91 21.69 21.11 21.84 21.84 Average - 19.88 22.60 23.12 19.40 22.91 22.84 23.00 23.01 23.57 23.50
Table 3: Comparative Image Denoising Results in terms of PSNR (dB) for High Noise Levels
(a) 512×512 Lena (b) 256×256 House (c) 256×256 Peppers
(d) 512×512 Barbara (e) 512×512 Fingerprint (f) 512×512 Monarch
[image:22.612.128.484.124.466.2](g) 256×256 Zebra (h) 512×512 Cosine Grating
Figure 5: Test Images used in Our Experiments
4.2. Experiments with High Noise Levels
A comparison of denoising results on the seven test images corrupted with high levels of noise (σn= 50,75,100) for the three proposed methods with the
PSNR on average than NL-Means in case of high noise levels. Note that with the exception of Fingerprint and Barbara, both the MRM variants perform consistently well for the remaining five images at all three high levels of noise. The Fingerprint image contains low frequency patterns of fine anisotropic features, while theBarbaraimage contains high frequency oscillatory patterns of fine anisotropic features. It is due to the presence of oscillatory patterns such as these that the two transform domain shrinkage methods,Contourlet MDand wave atoms respectively, perform well on these two images as they are particularly well suited to images containing periodic textures of anisotropic features. On the other hand, the MRM variants perform better than both the shrinkage methods on Monarch and Zebra, the two images containing oscillatory patterns of coarse anisotropic features for very high noise levels (σn = 75,100). It is also worth noting that MRM filtering in both wavelet
and Laplacian domains does not only produce better results in terms of the objective PSNR but also in terms of the subjective visual quality. Visual results forLena,Barbara,Peppers,House, and Monarchimages are shown in Figs. 6–10. As can be seen in these Figures, both variants of MRM filtering produce smoother ridges, sharper edges, and less fake texture artifacts in majority of the cases than the other methods.
5. Conclusions
In this paper, we have presented a generic framework for image denoising based on the idea of regional similarity in the spatial domain. The proposed framework is a generalization of trilateral filtering whereby multidimensional features can be used to describe local similarity. We investigated a variety of features known to capture regional properties such as textural features and edge coherence. It was shown that despite being a simple and relatively inexpensive feature to compute, local energy of a pixel in the spatial domain effectively captures the variation of intensities in its local neighborhood in the presence of additive Gaussian white noise. Analysis of the relationship between dissimilarity function used by non-local means algorithm and that based on the local energy reveals that they differ only by a weighted l1-norm enabling local energy to be more robust in the presence of high levels of noise. It was also shown that the local energy based multilateral filtering compares favorably to other published methods in terms of both objective PSNR measure and visual quality of the denoised images.
decomposition and scale space. Such an extension for bilateral filtering has been shown to remove coarse-grain noise in [35]. The wavelet variant of mul-tiresolution multilateral (MRM) filtering was shown to produce good denois-ing results on images containdenois-ing oscillatory patterns of anisotropic features, while the latter variant in the Laplacian domain reconstructed isotropic con-tents well and performed better on images containing smooth regions. Both the variants compare favorably with more sophisticated and computationally expensive shrinkage methods such as [13, 19] which are designed to capture oscillatory patterns in images. A possible future direction of this work is the development of a data-driven approach to automatically select the σf
pa-rameter. Another possible direction would be an extension of the proposed framework to a non-local setting, i.e., replacing the dissimilarity function in the NL-Means algorithm [21, 28] with our local energy based kernel.
Acknowledgements
Part of this work was carried out while the second author was studying for his Masters degree in Computer Science and Applications at the University of Warwick.
References
[1] P. Perona, J. Malik, Scale-space and edge detection using anisotropic diffusion, IEEE Transactions on Pattern Analysis and Machine Intelli-gence 12 (7) (1990) 629–639.
[2] Z. Farbman, R. Fattal, D. Lischinski, R. Szeliski, Edge-preserving de-compositions for multi-scale tone and detail manipulation, Proceedings of ACM SIGGRAPH 27 (3) (2008) 67:1–67:10.
[3] O. Scherzer, J. Weickert, Relations between regularization and diffusion filtering, Journal of Mathematical Imaging and Vision 12 (1) (2000) 43–63.
[4] M. Black, G. Sapiro, D. Marimont, D. Heeger, Robust anisotropic dif-fusion, IEEE Transactions on Image Processing 7 (3) (1998) 421–432.
[6] D. Donoho, X. Huo, Combined image representation using edgelets and wavelets, in: Proceedings of SPIE, Vol. 3813, 1999, pp. 468–476.
[7] C. Jung, J. Scharcanski, Adaptive image denoising and edge enhance-ment in scale-space using the wavelet transform, Pattern Recognition Letters 24 (7) (2003) 965–971.
[8] Z. Hou, Adaptive singular value decomposition in wavelet domain for image denoising, Pattern Recognition 36 (8) (2003) 1747–1763.
[9] E. Candes, Ridgelets: theory and applications, Ph.D. thesis, Standford University (1998).
[10] J. Starck, E. Cand`es, D. Donoho, The curvelet transform for image denoising, IEEE Transactions on image processing 11 (6) (2002) 670– 684.
[11] M. Do, M. Vetterli, The finite ridgelet transform for image representa-tion, IEEE Transactions on Image Processing 12 (1) (2003) 16–28.
[12] M. Do, M. Vetterli, The contourlet transform: an efficient directional multiresolution image representation, IEEE Transactions on image pro-cessing 14 (12) (2005) 2091–2106.
[13] Y. Lu, M. Do, A new contourlet transform with sharp frequency local-ization, in: IEEE International Conference on Image Processing, 2006, pp. 1629–1632.
[14] G. Chen, B. K´egl, Image denoising with complex ridgelets, Pattern Recognition 40 (2) (2007) 578–585.
[15] X. Wang, Wrap-around effect removal finite ridgelet transform for mul-tiscale image denoising, Pattern Recognition 43 (11) (2010) 3693–3698.
[16] F. Meyer, R. Coifman, Brushlets: a tool for directional image analysis and image compression, Applied and computational harmonic analysis 4 (2) (1997) 147–187.
[18] M. Aharon, M. Elad, A. Bruckstein, K-SVD: An algorithm for designing overcomplete dictionaries for sparse representation, IEEE Transactions on signal processing 54 (11) (2006) 4311–4322.
[19] L. Demanet, L. Ying, Wave atoms and sparsity of oscillatory patterns, Applied and Computational Harmonic Analysis 23 (3) (2007) 368–387.
[20] N. Rajpoot, R. Wilson, Z. Yao, Planelets: A new analysis tool for planar feature extraction, in: Proceedings 5th International Workshop on Im-age Analysis for Multimedia Interactive Services (WIAMIS’2004), 2004.
[21] A. Buades, B. Coll, J. Morel, A non-local algorithm for image denois-ing, in: IEEE Conference on Computer Vision and Pattern Recognition (CVPR), Vol. 2, 2005, pp. 60–65.
[22] M. Mahmoudi, G. Sapiro, Fast image and video denoising via nonlocal means of similar neighborhoods, IEEE Signal Processing Letters 12 (12) (2005) 839–842.
[23] T. Brox, O. Kleinschmidt, D. Cremers, Efficient nonlocal means for denoising of textural patterns, IEEE Transactions on Image Processing 17 (7) (2008) 1083–1092.
[24] T. Tasdizen, Principal neighborhood dictionaries for nonlocal means im-age denoising, IEEE Transactions on Imim-age Processing 18 (12) (2009) 2649–2660.
[25] D. van de Ville, M. Kocher, SURE-based non-local means, IEEE Signal Processing Letters 16 (11) (2009) 973–976.
[26] A. Foi, V. Katkovnik, K. Egiazarian, Pointwise shape-adaptive DCT for high-quality denoising and deblocking of grayscale and color images, IEEE Transactions on Image Processing 16 (5) (2007) 1395–1411.
[27] K. Dabov, A. Foi, V. Katkovnik, K. Egiazarian, Image denoising by sparse 3-d transform-domain collaborative filtering, IEEE Transactions on Image Processing 16 (8) (2007) 2080–2095.
[29] C. Tomasi, R. Manduchi, Bilateral filtering for gray and color images, in: International Conference on Computer Vision (ICCV), 1998, pp. 839–846.
[30] D. Barash, Fundamental relationship between bilateral filtering, adap-tive smoothing, and the nonlinear diffusion equation, IEEE Transactions on Pattern Analysis and Machine Intelligence 24 (6) (2002) 844–847.
[31] R. Garnett, T. Huegerich, C. Chui, W. He, A universal noise removal algorithm with an impulse detector, IEEE Transactions on Image Pro-cessing 14 (11) (2005) 1747–1754.
[32] P. Choudhury, J. Tumblin, The trilateral filter for high contrast images and meshes, in: Proceedings of the 14th Eurographics workshop on Ren-dering, Eurographics Association Aire-la-Ville, Switzerland, Switzer-land, 2003, pp. 186–196.
[33] Z. Yu, Z.-K. Shi, R.-Q. Wang, A multilateral filtering method applied to airplane runway image, arxiv.org (May 2008).
[34] E. Simoncelli, W. Freeman, The steerable pyramid: A flexible archi-tecture for multi-scale derivative computation, in: Proceedings Interna-tional Conference on Image Processing (ICIP), Vol. 3, 1995, pp. 444–447.
[35] M. Zhang, B. Gunturk, Multiresolution bilateral filtering for image de-noising, IEEE Transactions on Image Processing 17 (12) (2008) 2324– 2333.
[36] H. Yu, L. Zhao, H. Wang, Image denoising using trivariate shrinkage fil-ter in the wavelet domain and joint bilafil-teral filfil-ter in the spatial domain, IEEE Transactions on Image Processing 18 (10) (2009) 2364–2369.
[37] S. Chang, B. Yu, M. Vetterli, Adaptive wavelet thresholding for im-age denoising and compression, IEEE Transactions on Imim-age Processing 9 (9) (2000) 1532–1546.
[38] S. Mallat, Wavelets for a vision, Proceedings of the IEEE 84 (4) (1996) 604–614.
on Image and video retrieval, ACM New York, NY, USA, 2007, pp. 401– 408.
[40] P. Burt, E. Adelson, The Laplacian pyramid as a compact image code, IEEE Transactions on Communications 31 (4) (1983) 532–540.
[41] N. Rajpoot, Z. Yao, R. Wilson, Adaptive wavelet restoration of noisy video sequences, in: Proceedings IEEE International Conference on Im-age Processing (ICIP), 2004, pp. 957–960.
[42] N. Otsu, A threshold selection method from gray-level histograms, Au-tomatica 11 (1975) 285–296.
[43] J. Xie, P. Heng, M. Shah, Image diffusion using saliency bilateral filter, IEEE Transactions on Information Technology in Biomedicine 12 (6) (2008) 768–771.
(a) Noisy image; σn=75 (b) Bilateral Filtering [29] (c)Multilateral E
(PSNR=10.66dB) (PSNR=24.70dB) (PSNR=24.70dB)
(d) Contourlet MD [13] (e) Wave Atoms [19] (f) NL-Means [21] (PSNR=25.50dB) (PSNR=24.43dB) (PSNR=24.12dB)
(g) MRB[35] (h) MRM-Wav (i)MRM-Lap
[image:29.612.118.501.195.580.2](PSNR=25.40dB) (PSNR=25.50dB) (PSNR=26.00dB)
(a) Noisy image; σn=75 (b) Bilateral Filtering [29] (c)Multilateral E
(PSNR=10.62dB) (PSNR=22.00dB) (PSNR=22.00dB)
(d) Contourlet MD [13] (e) Wave Atoms [19] (f) NL-Means [21] (PSNR=22.60dB) (PSNR=23.38dB) (PSNR=22.31dB)
(g) MRB[35] (h) MRM-Wav (i)MRM-Lap
[image:30.612.118.498.196.580.2](PSNR=22.52dB) (PSNR=22.60dB) (PSNR=22.70dB)
(a) Noisy image; σn=100 (b) Bilateral Filtering [29] (c) Multilateral E
(PSNR=8.13dB) (PSNR=21.23dB) (PSNR=21.23dB)
(d) Contourlet MD [13] (e) Wave Atoms [19] (f) NL-Means [21] (PSNR=21.00dB) (PSNR=20.32dB) (PSNR=21.00dB)
(g)MRB [35] (h) MRM-Wav (i) MRM-Lap
[image:31.612.119.505.196.581.2](PSNR=21.54dB) (PSNR=21.72dB) (PSNR=21.82dB)
(a) Noisy image; σn=75 (b) Bilateral Filtering [29] (c)Multilateral E
(PSNR=10.65dB) (PSNR=24.24dB) (PSNR=24.40dB)
(d) Contourlet MD [13] (e) Wave Atoms [19] (f) NL-Means [21] (PSNR=24.60dB) (PSNR=23.88dB) (PSNR=23.90dB)
(g) MRB[35] (h) MRM-Wav (i)MRM-Lap
[image:32.612.119.498.195.580.2](PSNR=25.23dB) (PSNR=25.45dB) (PSNR=25.61dB)
(a) Noisy image; σn=100 (b) Bilateral Filtering [29] (c) Multilateral E
(PSNR=8.10dB) (PSNR=21.50dB) (PSNR=21.65dB)
(d) Contourlet MD [13] (e) Wave Atoms [19] (f) NL-Means [21] (PSNR=22.20dB) (PSNR=21.50dB) (PSNR=21.13dB)
(g) MRB [35] (h) MRM-Wav (i) MRM-Lap
[image:33.612.119.506.195.579.2](PSNR=22.30dB) (PSNR=22.82dB) (PSNR=22.73dB)
Nasir Rajpoot received his PhD in Computer Science from the University of Warwick in 2001. Prior to that, he graduated with MSc in Systems Engineering from Quaid-e-Azam University and MSc in Computer Science from Bahauddin Zakariya University, both with the highest distinctions, in 1996 and 1994 respectively. He is currently Associate Professor in the Computer Science department at the University of Warwick. Dr Rajpoot has published more than 70 articles in peer reviewed journals and international conferences in the areas of image processing, texture analysis, and histopathology image analysis. He was the General Chair of British Machine Vision Conference (BMVC) in 2007 and the Program Chair of Medical Image Understanding and Analysis (MIUA) in 2010. A recent focus of his research has been in the areas of bioimage computing with special emphasis on pre-processing and analysis of fluorescence microscopy images with applications to cancer biology.