ERP CORRELATES OF THE INTERACTIONS BETWEEN TOP-DOWN AND
BOTTOM-UP PROCESSES IN VISUAL OBJECT CATEGORIZATION
by
Szilvia Linnert
A THESIS SUBMITTED IN PARTIAL FULFILLMENT OF THE REQUIREMENTS
OF LANCASTER UNIVERSITY FOR THE DEGREE OF DOCTOR OF
PHILOSOPHY
LANCASTER UNIVERSITY
Declaration
I declare that the thesis is my own work, and has not been submitted in substantially the
same form for the award of a higher degree elsewhere.
28th September 2017
Abstract
Numerous studies have reported category differences between animate and inanimate
objects in the early visual ERP components. However, contradictory explanations have
been suggested for the underlying processes of such category differences. Both low-level
physical differences and higher-level category-specific processes have been shown to
modulate the visual ERPs. The present research investigates how physical features (such
as amplitude spectrum and spatial frequency) and top-down processes (the categorization
task that the participants perform) interact and modulate the visual ERPs. We found ERP
correlates of categorical representation for animal and inanimate object categories, as
well as early, task-related top-down modulation of the visual ERPs. These results indicate
that top-down factors can modulate visual processing both at the level of lower-level
physical features and at the level of category representations. The results are discussed in
terms of shape- and/or category-selective representations and brain areas in the ventral
visual pathway, and they are interpreted within the framework of flexible evidence
Acknowledgements
The work presented in this thesis was funded by the Faculty of Science and
Technology at Lancaster University, and I would like to thank the many participants who
took part in my research.
I am very grateful to my supervisor, Prof. Gert Westermann for being supportive,
helpful and patient during these years. Thank you to my second supervisor, Prof. Vincent
Reid for helping to finalize the study designs and revising the manuscripts. I would also
like to thank Dr. Tamás Tompa for first introducing me to this field of research many
years ago.
Thank you very much to Eugenio and Sam for all their continuous help and for
Dedication
Table of Contents
DECLARATION ... II ABSTRACT ... III ACKNOWLEDGEMENTS ... IV TABLE OF CONTENTS ... V STATEMENT OF AUTHORSHIP ... IX EPIGRAPH ... XI
INTRODUCTION: VISUAL CATEGORY REPRESENTATIONS AND THEIR ERP CORRELATES ... 1
OBJECT AND CATEGORY REPRESENTATIONS IN THE HIGHER-LEVEL VISUAL AREAS ... 3
THE NATURE OF VISUAL CATEGORY REPRESENTATIONS ... 7
Top-down activation of category specific areas ... 9
Content-based versus spatial attention ... 13
ELECTROENCEPHALOGRAM (EEG) AND VISUAL EVENT-RELATED POTENTIALS ERPS ... 15
CATEGORY DIFFERENCES IN THE VISUAL ERPS ... 17
The effect of the categorization task ... 20
The effect of low-level stimulus properties on the visual ERPs ... 23
Role of conscious percept ... 25
CORRESPONDENCE BETWEEN MODULATION OF CATEGORY-SPECIFIC REPRESENTATIONS AND MODULATION OF CATEGORY-SPECIFIC ERPS ... 27
CONTENT-BASED TASK MODULATION OF N1 AMPLITUDES FOR CARS AND BIRDS ... 31
AIMS OF THE THESIS ... 36
REFERENCES ... 39
UNDERLYING MECHANISMS OF TASK-RELATED MODULATION OF ANIMAL VS. VEHICLE DIFFERENCES IN THE VISUAL ERPS ... 49
ABSTRACT ... 1
METHODS ... 7
Participants ... 7
Stimuli and materials ... 8
Experimental procedure ... 9
EEG recording and analysis ... 10
RESULTS ... 11
Behavioral results ... 11
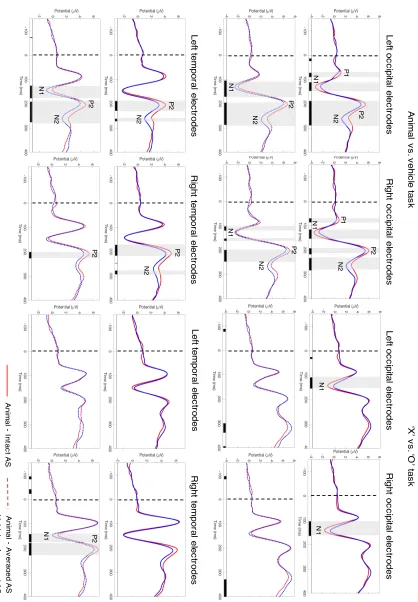
Electrophysiology results ... 12
P1 ... 18
N1 ... 19
P2 and N2 ... 20
Comparison across components ... 22
DISCUSSION ... 24
REFERENCES ... 30
LINKING STATEMENT FOR PAPER 2 ... 86
VISUAL ERP DIFFERENCES BETWEEN ANIMAL AND VEHICLE CATEGORIES IN A LABEL-IMAGE MATCHING TASK ... 88
ABSTRACT ... 1
METHODS ... 7
Stimuli and materials ... 7
Experimental procedure ... 8
EEG recording and analysis ... 9
RESULTS ... 10
Behavioral results ... 10
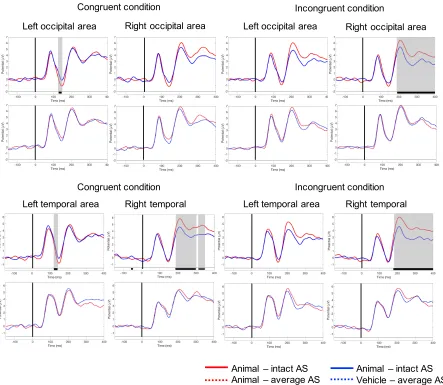
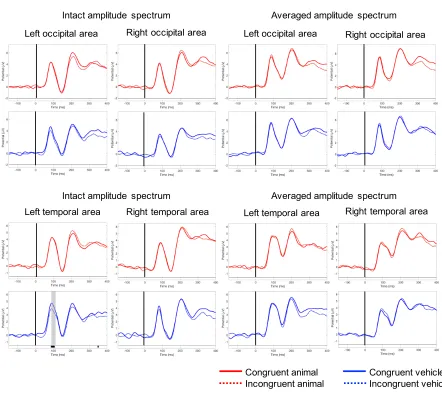
Electrophysiology results ... 12
Occipital area ... 18
Temporal area ... 19
Comparison across components ... 19
DISCUSSION ... 21
REFERENCES ... 25
LINKING STATEMENT FOR PAPER 3 ... 117
EARLY ANIMAL-VEHICLE ERP DIFFERENCES REFLECT INTEGRATION OF HIGH AND LOW SPATIAL FREQUENCY INFORMATION ... 119
ABSTRACT ... 1
METHODS ... 6
Participants ... 6
Stimuli and materials ... 6
Experimental procedure ... 8
EEG recording and analysis ... 9
RESULTS ... 10
Behavioral results ... 10
Figure 3. Reaction times for ISF, HSF and LSF stimuli in the AV and XO task for animal and vehicle images. Error bars represent SE. ... 12
Electrophysiology results ... 12
Occipital area ... 17
Temporal area ... 19
Comparison across components ... 21
DISCUSSION ... 22
REFERENCES ... 29
LINKING STATEMENT FOR PAPER 4 ... 154
EARLY VISUAL ERPS REFLECT FLEXIBLE MECHANISMS IN INANIMATE OBJECT DISCRIMINATION . 156 ABSTRACT ... 1
METHODS ... 9
Participants ... 9
Stimuli and materials ... 9
Experimental procedure ... 11
EEG recording and analysis ... 12
RESULTS ... 13
Behavioral results ... 13
EEG results ... 15
Vehicle – tool contrast ... 17
Real - toy contrast ... 22
Interaction between objects and function ... 24
DISCUSSION ... 26
REFERENCES ... 36
DISCUSSION: FLEXIBLE MECHANISMS IN INFORMATION ACCUMULATION ... 199
SUMMARY ... 200
CATEGORY REPRESENTATIONS IN THE VISUAL ERPS ... 202
Animal-vehicle differences in the visual ERPs ... 203
TASK-RELATED MODULATION ... 208
INFORMATION ACCUMULATION ... 212
FLEXIBILITY OF VISUAL PROCESSING ... 216
CONCLUDING REMARKS ... 219
REFERENCES ... 221
Statement of Authorship
Authorship contributions
PAPER 1: UNDERLYING MECHANISMS OF TASK-RELATED MODULATION OF ANIMAL VS. VEHICLE DIFFERENCES IN THE VISUAL ERPs
Conception and design of study: Szilvia Linnert, Gert Westermann, Vincent Reid Acquisition of data: Szilvia Linnert
Analysis and/or interpretation of data: Szilvia Linnert
Drafting the manuscript: Szilvia Linnert
Revising the manuscript critically for important intellectual content: Szilvia Linnert, Gert Westermann
Contribution of principal author: 85%
PAPER 2: VISUAL ERP DIFFERENCES BETWEEN ANIMAL AND VEHICLE CATEGORIES IN A LABEL-IMAGE MATCHING TASK
Conception and design of study: Szilvia Linnert, Gert Westermann, Vincent Reid Acquisition of data: Szilvia Linnert
Analysis and/or interpretation of data: Szilvia Linnert
Drafting the manuscript: Szilvia Linnert
Revising the manuscript critically for important intellectual content: Szilvia Linnert, Gert Westermann
Contribution of principal author: 85%
PAPER 3: EARLY ANIMAL-VEHICLE ERP DIFFERENCES REFLECT
INTEGRATION OF HIGH AND LOW SPATIAL FREQUENCY INFORMATION
Conception and design of study: Szilvia Linnert, Gert Westermann, Vincent Reid Acquisition of data: Szilvia Linnert
Analysis and/or interpretation of data: Szilvia Linnert
Drafting the manuscript: Szilvia Linnert
Revising the manuscript critically for important intellectual content: Szilvia Linnert, Gert Westermann
Contribution of principal author: 85%
PAPER 4: EARLY VISUAL ERPs REFLECT FLEXIBLE MECHANISMS IN INANIMATE OBJECT DISCRIMINATION
Conception and design of study: Szilvia Linnert, Gert Westermann, Vincent Reid Acquisition of data: Szilvia Linnert
Analysis and/or interpretation of data: Szilvia Linnert
Drafting the manuscript: Szilvia Linnert
Revising the manuscript critically for important intellectual content: Szilvia Linnert, Gert Westermann, Vincent Reid
We the undersigned agree with the above stated “proportion of work undertaken” for each of the above manuscripts contributing to this thesis:
Signed: SZILVIA LINNERT
VINCENT REID
Epigraph
“Open mind for a different view And nothing else matters”
James Hetfield & Lars Ulrich
Introduction: Visual category representations and their ERP correlates
Szilvia Linnert
Introduction: Visual category representations and their ERP correlates
People use categories to process incoming visual information. A category can
aggregate very different kinds of objects (e.g., ‘Things to take to the beach’) but other
categories can contain perceptually similar representatives, for instance cats and dogs.
Furthermore, the same objects can belong to several categories; for instance, a cat can be
categorized as a cat, as an animal, as a mammal, as a four-legged animal etc. The brain
somehow has to represent category-specific information, and different processes have to
access this knowledge in a flexible manner. Case studies provide evidence that
representations can be selectively impaired. For instance, many studies have shown that
in visual agnosia the visual recognition of animals, fruits/vegetables, man-made objects or
faces can be selectively impaired (Mahon & Caramazza, 2009; Warrington & Shallice,
1984). However, it is important to point out that these patients can still recognize objects
by touching them and they can also name these objects and describe them. Patients can
also recognize lower-level features, such as lines, edges or simple geometrical shapes.
Therefore, this deficit selectively impairs a specific stage of information processing in the
visual modality, however, the actual impairment varies between patients, depending on
the extent of the injury (e.g. Behrmann & Kimchi, 2003). Research with these patients
can provide important information about visual processes and category representations.
For instance, several aspects of the two visual systems theory are based on a patient with
visual form agnosia (patinet D.F.; see Goodale & Keith Humphrey, 1998; Whitwell,
Milner, & Goodale, 2014).
The role of vision is to construct an inner representation of the objects in the
outside word. This inner representation is the percept, how we perceive the outside word.
based on the incoming visual information. According to the two-visual pathway theory,
the ventral visual pathway processes information regarding the identity of objects, in
other words, it constructs the percept (Goodale & Keith Humphrey, 1998; Goodale &
Milner, 1992; Ungerleider & Mishkin, 1982). According to the classical view
(Ungerleider, Mishkin, 1982), visual information within this pathway is processed in a
feed-forward, hierarchical fashion. The early visual areas process simple features, such as
lines and edges. This information is projected to higher-level areas, where more complex
features are processed. At the last stage of the visual processing, whole object
representations have to be constructed. In addition, category-specific visual impairment in
agnosia patients suggests that not only individual objects, but also categories can be
represented in the last stages of visual processing.
Object and category representations in the higher-level visual areas
The last stage of the ventral pathway is the inferior temporal cortex (IT) or its
human counterpart, the lateral occipital complex (LOC: Grill-Spector, Kourtzi, &
Kanwisher, 2001; Malach et al., 1995). Here, complex objects are processed and
represented. Neurons in the IT respond to complex stimulus features by pooling
information from the lower areas (for review see Tompa & Sáry, 2010). IT neurons in
monkeys are shape-selective, they tend to respond to some shapes while activation is
decreased for others. Therefore, each neuron has a preferred shape, which can be the basis
of object representation. The strongest IT responses have been found for colorful,
complex stimuli. In addition, several cells seem to respond to objects that have biological
also been shown to be viewpoint independent for the preferred shape, however only to a
limited extent (for review see Tompa & Sáry, 2010).
It seems that beyond shape selectivity, category information is also coded in the
IT. Kiani, Esteky, Mirpour, and Tanaka (2007) showed that single neurons and neuron
populations responded differently to category exemplars in the monkey IT. In this study,
activity was recorded extracellularly from more than 600 neurons while monkeys
performed a passive fixation task. Each neuron was tested with around 1000 stimuli.
Images contained a big range of colourful animate and inanimate objects. The activities
of a single neuron increased or decreased in response to different objects. Activity
patterns measured across neurons were used to calculate similarity between the presented
objects. Object belong to closer categories in our intuitive hierarchical category structure
elicited more similar response patterns. Authors also used multidimensional scaling and
cluster analysis in order to examine the distance between neural response patterns for
each presented object. They found hierarchical category representations in the activity
pattern of neurons. The highest-level categories were animate and inanimate categories.
The ‘animate’ object category was divided into subcategories of bodies, hands and faces.
The ‘body’ category was divided into two subcategories: the first grouped humans, birds
and four-legged animals, while the second contained fishes, insects and lower animals.
Faces were split into primate and non-primate categories, and the primate face category
was further divided into human and monkey faces.
Brain imaging studies in humans have also shown object specificity in the LOC.
Several studies have reported specialized visual areas that show greater activation for one
object category compared to another. Specific areas have been identified for faces
(face-selective area: Kanwisher, McDermott, & Chun, 1997) and animals (Chao, Haxby, &
D’Esposito, 1998), chairs (Ishai, Ungerleider, Martin, Schouten, & Haxby, 1999) and
tools (Chao et al., 1999). It has been suggested, that such activity differences reflect
distinct categorical representations (Kanwisher et al., 1997). However, most of these
categories are basic-level categories. Therefore, exemplars within a category usually
share similar shapes, whereas objects belonging to different categories have very distinct
shapes. It is possible, therefore, that only individual objects are represented in the LOC
instead of object categories, and that these individual object representations are organized
by perceptual similarity. With this view, category-specific areas do not reflect real
category representations; instead, category-specificity arises as an artifact from
experiments that use perceptually very different categories (Kriegeskorte et al., 2008).
More recent fMRI studies have found evidence both for distinct, category-based and for
continuous, similarity-based representations in the LOC (Kriegeskorte et al., 2008; Mur et
al., 2013). Distinct category-based activity patterns were found for animate and inanimate
categories. In addition, face and body sensitive activity clusters were found within the
animate category, reflecting hierarchical category representations (Kriegeskorte et al.,
2008; Mur et al., 2013). Results also indicated that, beside the distinct categorical
representation, objects within these categories were represented in a continuous,
similarity-based manner (Kriegeskorte et al., 2008).
Therefore, these results suggest that, beside shape-related representations, some
categories are represented in the higher-level visual areas, both in monkeys and humans.
According to the classical view, these shape and category representations are activated in
a feed-forward manner, as the incoming visual input is analyzed (e.g. Ungerleider &
Mishkin, 1982). According this view, category specificity arises on top of low-level
Nevertheless, it is possible that some low-level visual features already contain
category-specific information. For instance, the amplitude spectrum (AS) of an image, as
a low-level characteristic, has been suggested to provide category specific information
(Torralba & Oliva, 2003). The AS of an image refers to its energy at different spatial
frequencies and it describes global spatial characteristics. Looking at only the AS content
of an image, the image is not recognizable. Nevertheless, it has been shown in
computational models that the AS content alone provided 80% accuracy of detecting
animals, people and vehicles in natural and man-made scenes (Torralba & Oliva, 2003).
In an fMRI study, Andrews, Clarke, Pell, and Hartley (2010) investigated whether
category-specific responses in the face- and house-selective visual areas can be explained
by sensitivity to the AS information. Intact and phase-scrambled faces and houses were
used as stimuli. The phase spectrum of an object provides information about the structure
of the objects, such as the shape or configuration of local features. Therefore, phase
scrambling preserves global, low-level properties, such as the AS information, but it
destructs the recognizable shape information. Therefore, these stimuli contain the AS
information of the original images, but they do not contain recognizable objects. Results
indicated that AS information did contribute to face- and house-selective activation.
However, phase-scrambled images activated the category-selective regions to a much
lesser degree than intact ones. Beside the category-specific areas, the results also showed
selectivity to AS information in more medial-occipital regions, which process lower-level
visual features. This suggests, that category-specific responses in higher-level areas arise
from the processing of category-specific low-level features in the lower-level visual areas
(Andrews et al., 2010). Therefore, category-specificity does not solely rely on
The nature of visual category representations
The above-mentioned studies investigated objects and category representations in
the visual areas. Nevertheless, other studies have suggested the role of prefrontal and
temporal cortex in category learning. For instance, in a study by Freedman, Riesenhuber,
Poggio, and Miller (2001) monkeys were trained to categorize morphed cat-like and
dog-like stimuli. The category boundary between these animals was arbitrary in that the
perceptual difference between the two category exemplars closest to the category
boundary was the same as the difference between within-category members.
Nevertheless, the activity of prefrontal neurons differentiated categories, as activity was
similar for in-group exemplars irrespectively of the shape differences (Freedman,
Riesenhuber, Poggio & Miller, 2001).
Jiang et al. (2007) tested category learning mechanisms in humans by using fMRI.
Participants were trained to categorize randomly generated morphed cars. Training in car
categorization led to increased selectivity in the human LOC. However, this selectivity
was sensitive to small changes in shape; novel exemplars did not evoke the same
activation pattern. This result suggested that LOC activation reflected only shape
selectivity and not category membership per se. In contrast, prefrontal areas showed
category selectivity that was not driven by perceptual differences as category-selective
activation was found also for novel exemplars. Similarly, van der Linden, van Turennout,
and Indefrey (2010) found only perceptual learning effects in the visual areas, but no
generalization for the novel category exemplars when participants were trained to
categorize artificially created birds into arbitrary categories. Interestingly, a category
effect, irrespective of perceptual differences, was found in the superior temporal cortex,
Jiang et al. (2007) is the difference in training. While in the study of Jiang et al. (2007) a
perceptual training was performed, van der Linden et al. (2010) labeled the categories.
If category learning mechanisms affect prefrontal and temporal areas, but not the
visual areas, this suggests that the visual areas contain more hard-wired, less flexible
representations. In other words, objects, and some categories are represented in the visual
areas. However, novel, arbitrary categories are formed in different parts of the brain.
Indeed, in a recent fMRI study, Bugatus, Weiner, & Grill-Spector (2017) reported results
confirming this theory. Images of faces, bodies, cars, houses and letter-strings were
presented while participants performed different tasks. Participants either had to press a
button if a noisy stimulus appeared on the screen, or they performed a 2-back task. In the
third, selective attention task, superimposed images of two categories were presented to
the participants, and a cue indicated to which category did they have to attend. The
distributed neural activity patterns across prefrontal and visual areas for each category
and task were examined using multivoxel pattern analysis. Activation in the
category-specific visual areas reflected similar patterns for each category, irrespectively of the task,
therefore, representations in this visual area seem to be driven by categories. In contrast,
in the prefrontal cortex, category representations differed between the tasks therefore,
category-selective activation patterns were driven by the task, Therefore, visual areas
seem to contain stable visual representation, while flexible representations in the
prefrontal cortex enable task-specific, arbitrary categorization (Bugatus et al., 2017).
Nevertheless, selective attention, as a top-down factor, affected the activation of category
representations also in the visual areas. According to the authors, attentional effects in the
visual area were found in studies when the task required restricted processing of the
stimulus because of visual competition (see e.g. selective attention task in Bugatus at al.,
category membership and selective attention likely rely on different mechanisms.
Selective attention restricts the processing to a specific (attended) feature and modulates
the activation of the stable category representations in the visual areas. Different task
engagements, on the other hand, modulated the boundaries of category representations in
the prefrontal cortex, but not in the visual areas (Bugatus et al., 2017). Overall,
attention-related processes in the visual areas indicate that top-down processes can interact with the
bottom-up information processes, providing a more flexible information flow. However,
top-down processes seem to only activate category-specific areas, but do not change
category boundaries. The following section will provide evidence of such top-down
activation.
Top-down activation of category specific areas
The classical view of object categorization, that visual information is processed in
a serial fashion, is changing (Tompa & Sáry, 2010). Top-down theories emphasize the
role of the task as a top-down factor on visual processes. For instance, according to
Gilbert and Sigman (2007) the degree of top-down influence is dependent on the task that
the visual system has to solve. Gilbert and Sigman (2007) assume that the rapidly
changing environment requires flexible information processing. Flexibility can be
achieved if the brain areas do not have a fixed role and are able to execute different
processes depending on the context. Therefore, the current processing demands always
depend on the resonance between the incoming sensory input and task requirements
(Gilbert & Sigman, 2007). These theories are in line with the assumption of stable
category representations in the higher-level visual areas suggested by Bugatus et al.
(2017). Flexible processing of the visual input does not necessarily mean that top-down
attention can help to select relevant information more efficiently and quickly by
activating specific representations and/or processes according to the task demands.
Top-down theories on visual information processing are supported by several
lines of evidence. Task-related activation has been reported at the level of IT neurons in
monkeys. For instance, firing rates of IT cells depend on attentional factors and on
whether monkeys perform a categorization or discrimination task (for review see Tompa
& Sáry, 2010).
In humans, one line of evidence for top-down activation of shape and category
selective areas is studies on mental imagery. It has been shown that mental imagery can
be intact in patients with visual form agnosia (Rizzi, Piras, & Marangolo, 2010; Servos &
Goodale, 1995). For instance, Rizzi et al. (2010) presented a case study showing how
mental imagery as a top-down factor can influence bottom-up visual information
processing. Their patient had a selective deficit to visually recognize objects, however,
her semantic knowledge and mental imagery were intact. She could recognize local parts
of an object but could not generate a global percept and therefore could not recognize the
whole objects. At the same time, when she was told to point out a specific object (e.g. the
bottle) among other objects, she was able to do that. She explained how she did this by
saying she imagined the bottle, and she was looking for something similar on the image
(Rizzi et al., 2010). This case suggests that visual imagery based on object names (a
top-down process) supports bottom-up information processing.
fMRI studies have also shown that mental imagery activates the same
category-specific visual areas in the human LOC that are activated by actually looking at the
objects. For instance, O’Craven and Kanwisher (2000) found activation in face-selective
and place-selective areas of the visual cortex when participants were imagining faces and
perception. Reddy, Tsuchiya, and Serre (2010) reported similar results for categories of
faces, houses, tools and fruits. In addition, category information could be decoded from
the fMRI activity pattern during mental imagery. Using multivariate analysis, classifiers
trained on activity during actual image presentation provided similar results when they
were tested on activity during mental imagery, and vice versa (Reddy et al., 2010).
Therefore, these studies suggest that top-down projections can activate category-specific
representations of the visual cortex even in the absence of incoming sensory information.
Shape and category selective areas can be also activated in expectation of a
stimulus. Such preparatory activity has been reported in the visual cortex when
anticipatory cues predicted the subsequent stimulus (for review see Battistoni, Stein, &
Peelen, 2017). In a study by Stokes, Thompson, Nobre, and Duncan (2009), participants
had to selectively attend to simple shapes. An auditory cue was given to inform
participants of whether they had to attend to the letter ‘O’ or the letter ‘X’. Selective
preparatory activity was found in the LOC area for the different shapes. Preparatory
activity has also been shown to affect specific, category-selective visual areas. Esterman
and Yantis (2010) found such activity in face- and place-selective visual areas following
visual images as anticipatory cues. Peelen and Kastner (2011) reported similar result
when symbolic visual cues were given to participants in preparation to detect either cars
or humans on the presented image. In addition, this activation also facilitated participants’
target detection performance. Preparatory activity was also found in the early visual
cortex (V1), suggesting anticipation of low-level features, such as line-orientation.
However, preparatory activity in the V1 worsened participants’ performance (Peelen &
Kastner, 2011). Finally, preparatory activity was also found when written names
(HOUSE or FACE) were presented as anticipatory cues before images of houses and
Most of the above mentioned studies used symbolic cues in order to elicit
preparatory activity. The use of symbolic cues requires participants to actively interpret
the cue. Therefore, attentional influence has to be based on top-down processes and not
on involuntary bottom-up processes (Battistoni et al., 2017). Moreover, a transcranial
magnetic stimulation (TMS) study has provided more direct evidence that preparatory
activity in a specific brain area directly affects the processing of the subsequent image
(Reeder, Perini, & Peelen, 2015). Participants were instructed to detect car or people in
complex scenes, similar to the study by Peelen and Kastner (2011). However, Reeder et
al. (2015) applied TMS before image onset over the category specific LOC areas where
preparatory activity has been found by Peelen and Kastner (2011). Reeder et al. (2015)
found impaired detection of cars or people if TMS was applied over the LOC area
compared to detection of the same categories if TMS was applied over the vertex.
Moreover, performance was impaired only when participants had to detect general
categories (cars, people). When participants had to detect the same person or car on each
image – a task that enables detection based on lower level features – TMS over the LOC
did not affect the performance.
The results of Puri et al. (2009) also suggest that preparatory activity directly
influences the processing of the incoming information. In that study, house and face
stimuli were preceded by a written word (HOUSE or FACE). On 70% of the trials, the
word and image matched, however, on the remaining 30% they did not. Beside the
preparatory activity in the category-specific areas, increased activity was also found
during the processing of the visual stimuli if the anticipatory cue precisely predicted the
subsequent visual stimulus. This increased activity was not present when the word was
Overall, these studies provided evidence that higher-level visual areas contain
shape and category specific representations. These representations can be flexibly
activated either by top-down or bottom-up processes. Furthermore, top-down processes
modulate bottom-up information processing. Again, it is important to point out that
top-down factors activate, object or category representations, but do not modulate category
boundaries (Bugatus et al., 2017). Therefore, top-down and bottom-up processes interact
at the level of visual representations. Category-specific visual areas have been suggested
to accumulate and integrate evidence for decision-making (Tremel & Wheeler, 2015). A
decision can be made if the accumulated evidence reaches a threshold. Nevertheless, it is
possible that the top-down activation of a category-specific area modulates this threshold.
In other words, the expectation of an object makes it easier to recognize it. This
explanation is in line with the previously presented results of Bugatus et al., (2017),
suggesting stable visual category representations, that can be affected by selective
attention.
Content-based versus spatial attention
In a recent review, Battistoni et al. (2017) compared the effects of spatial and
non-spatial attention on visual processes. They concluded that top-down attention could not
only modulate spatial attributes but also the processing of non-spatial attributes, such as
low-level features or even object categories. Such non-spatial attention was named
content-based attention by the authors (Battistoni et al., 2017). The studies described in
the previous section suggest that content based attention selectively pre-activate visual
areas before the actual stimulus appears. Thus, it influences bottom-up information
The underlying mechanisms of content-based attention can be investigated at the
level of neuronal activity. IT neurons are shape-selective, as they tend to respond to some
shapes while activation is decreased for others. Thus, each neuron has a preferred shape
(Tompa & Sáry, 2010). Chelazzi, Duncan, Miller, and Desimone (1998) measured
activities of single neurons in monkeys in response to a cue that they learned to associate
with an object. The monkey’s task was to detect the cued object in an array of objects by
fixating on it. More than half of the neurons showed sustained activity following the cue
if it signalled the preferred shape of the neuron. Cues that were irrelevant to the task (as
monkeys only had to maintain their gaze at the central fixation) did not elicit
shape-specific activity. Therefore, shape-selective neurons in the IT increase their activity in
preparation to detect a behaviourally relevant stimulus.
Content-based attention and spatial attention seem to modulate activity in distinct
ways at the level of neuron populations (Ling, Liu, & Carrasco, 2009; Martinez-Trujillo
& Treue, 2004). Results suggest that spatial attention only increases the level of activity
of a neuron population selective to the attended location. Content-based attention, on the
other hand, not only increases neuronal activity, it also fine-tunes the response of the
neuron population. This means that content-based attention increases the response of
neurons that are sensitive to the attended feature or shape, and decreases the response of
neurons that are sensitive to other features or shapes.
Therefore, content-based top-down attention and spatial attention are similar
processes, however, they seem to rely on different underlying mechanisms at the level of
Electroencephalogram (EEG) and visual event-related potentials ERPs
Electroencephalogram (EEG) – the recording of the electrical activity of the brain
– is an excellent tool to investigate visual processes. Visual information processing is
very fast, but the high temporal resolution of the EEG can help us differentiate its
components. Furthermore, EEG is non-invasive and is widely applied in human research,
in both adult and developmental populations. The EEG activity reflects the average
voltage fluctuation of large neural ensembles over time.
One way to analyze EEG is to compute event-related potentials (ERPs). ERPs are
averaged signal of EEG segments that are time-locked to a specific event, such as the
appearance of a stimulus. By averaging together many segments linked to the appearance
of a stimulus type, EEG signal reflecting the processing of that stimulus will be amplified
and show up as deflections on the averaged waveform. These positive and negative
deflections are called ERP components. In contrast, EEG signals that are not linked to the
processing of that stimulus cancel out through averaging. Research using ERP has
identified a range of components that are linked to different mental processes.
Visual ERPs are measured over the posterior brain areas and give information
about visual processing in the first 300 ms after stimulus onset. The visual ERPs are the
P1, N1 (the face specific N1 is called N170), P2, and N2 components (Luck, 2005). The
visual P1 is a positive-going component with peak latency between 100 - 130 ms after the
stimulus onset. The P1 is sensitive to low-level stimulus parameters (contrast, size,
luminance and amplitude spectrum). The visual N1 is a negative-going component with
peak latency between 150 - 200 (or sometimes rather between 140 - 180) ms after the
onset of the stimulus. This component is sensitive to the task and seems to reflect some
about the visual P2 (positive component, peaking between 180 - 300 ms after stimulus
onset) and N2 (negative component, peaking between 200 - 350 ms after stimulus onset)
components. These components are not necessarily distinguishable on the ERP
waveforms. They are linked to more extensive visual analysis (e.g. Schendan & Kutas,
2007). It has been suggested that competing or insufficient information in the higher
visual areas get reinforcement by re-activating the early visual areas by feedback
projections (Di Lollo, Enns, & Rensink, 2000) and that the P2 component reflects this
re-activation process (Kotsoni, Csibra, Mareschal, & Johnson, 2007). This explanation is in
line with studies finding larger P2 for unrecognizable, noisy stimuli (e.g. Rousselet, Husk,
Bennett, & Sekuler, 2008).
Regarding categorization and category differences, several studies have reported
N1 amplitude differences between faces and man-made objects (for review see Rossion &
Jacques, 2008) or between animate and inanimate categories (e.g. Antal, Kéri, Kovács,
Janka, & Benedek, 2000; VanRullen & Thorpe, 2001). Many different interpretations
have been suggested in order to explain these differences. Different studies measure these
category differences at different electrode locations, using different tasks and different
object categories. Still, category differences in the N1 likely reflect some sort of
discrimination processes (Luck, 2005). However, the phrase, ‘discrimination process’ can
include visual, category-specific processes, as well as decision-making or
response-related processes. The next sections of this introduction will summarize studies in more
details regarding this question.
Category- and face-selective processes are usually measured over the temporal
area, on electrodes T5 and T6, according to the 10 - 20 EEG nomenclature. However,
visual ERPs are also analyzed over the occipital areas at electrodes O1, O2 and Oz. The
originate from different parts of the brain. Therefore, the location of an electrode where a
specific signal is measured does not necessarily reflect the brain activity of the area under
that electrode. Different source localization methods are used in order to find the brain
generators for a given EEG/ERP signal. Visual ERPs seem to be generated in the
posterior brain areas, where visual information is processed (Luck, 2005). In previous
decades, EEG was measured only at a few electrode locations, and results often reported
the average ERPs on occipital and temporal electrodes. Nowadays, however, with
high-density EEG systems, visual ERPs can be measured at several electrode locations and we
can compare the signal between different electrodes. Still, we cannot draw conclusion
regarding the exact brain area where these signals originate. Nevertheless, brain imaging
studies in humans and single-cell recordings from monkeys provide a substantial amount
of information about visual processing in different brain areas. Therefore, interpreting
ERP results in a framework provided by different brain imaging methods can help to
relate ERP differences to possible underlying mechanisms. The aim of this thesis is to
provide this interpretation for category-selective ERP differences.
Category differences in the visual ERPs
Animate-inanimate ERP differences were first reported by Thorpe, Fize, & Marlot
(1996). Participants saw images of natural scenes appearing on the screen for 20 ms and
they had to respond only if the picture contained an animal. The scenes contained a broad
variety of animals (mammals, reptiles, fish etc.), and the non-animal scenes included
natural and man-made environments as well as flowers and fruits. Over the frontal brain
areas from around 150 ms after stimulus onset, the ERP waves for the no-go (non-animal)
to the authors’ interpretation, this ERP difference reflected decision-making processes
occurring after the completion of visual processing. Thorpe et al. (1996) suggested that
the larger negativity for no-go trials might reflect response inhibition. Furthermore, they
assumed that such fast decision-making processes should be based solely on feed-forward
projections.
Subsequent studies have also found animal vs. non-animal ERP differences at
posterior electrode locations, over visual areas (Antal et al., 2001, 2000; Bacon-Macé,
Macé, Fabre-Thorpe, & Thorpe, 2005; Codispoti, Ferrari, Junghöfer, & Schupp, 2006;
Delorme, Rousselet, Macé, & Fabre-Thorpe, 2004; Johnson & Olshausen, 2003; Kiefer,
2001; Macé, Thorpe, & Fabre-Thorpe, 2005; Proverbio, Del Zotto, & Zani, 2007;
Rousselet, Fabre-Thorpe, & Thorpe, 2002; VanRullen & Thorpe, 2001; Zhu, Drewes,
Peatfield, & Melcher, 2016). For instance, Antal et al. (2000) investigated the
animal-vehicle differences in the ERPs in an animal vs. non-animal two-choice categorization
task. Beside the frontal area, they found category differences also over the posterior brain
areas with non-animals eliciting more negative ERPs compared to animals between 175 -
205 ms after stimulus onset. Furthermore, they also compared ERP differences for low
and high spatial frequency gratings. The spatial frequency gratings elicited only early
ERP differences (around 138 - 150 ms after stimulus onset) over the frontal areas. These
results indicate two important interpretations regarding the animal vs. non-animal ERP
differences over the posterior brain areas. First, these differences are not due to the
unbalanced motor responses. In contrast to the go/no-go task, where participants had to
press or release a button only for the target (usually animal) category, Antal et al. (2000)
used a two-choice categorization task, where participants had to press one of two buttons
for each stimulus type. Second, because of the different topography and time window of
posterior category difference reflected higher-level cognitive processes that were e
associated with the categorization of complex visual stimuli (Antal et al., 2000).
However, this interpretation does not clarify whether categorization reflects visual
processes or decision-making processes.
VanRullen and Thorpe (2001) attempted to separate ERP differences reflecting
perceptual and decision-making processes. In that study, participants had to perform two
go/no-go tasks where either animals or vehicles were the targets. Since vehicles were
distractors when animals were targets, and the vice versa, categories could be compared
unrelated to the task. Therefore, the authors compared ERPs for animals and vehicles,
regardless of whether they were targets or not, and also compared target vs. non-target
differences, regardless of their category. Thus, any activity difference between animals
and vehicles should reflect perceptual category differences, and differences between
targets and non-targets should reflect decision-making processes. The authors found
differential activity between the two categories starting from 75 ms after stimulus onset,
and they found task-related ERP differences from 150 ms after the stimulus onset. They
concluded that the early animal-vehicle activity difference was based on the visual
properties of animals and vehicles, while the later activity difference reflected
task-related, decision-making processes. Nevertheless, these interpretations were made based
on the ERP differences over different areas. The early category difference was most
prominent at parietal electrodes, whereas the late target/non-target difference was the
largest over the frontal areas. In addition, the animal-vehicle difference at the occipital
and frontal electrodes did not disappear in later time-windows with the emergence of
task-related differences. Rather, it was maintained in later time windows and it only
changed direction at around 160 ms (see Figure 3a in VanRullen & Thorpe, 2001, p. 456).
non-target trials. Nevertheless, these results do indicate both perceptual and task-specific
processes, but their interpretation still leaves open questions. First, in a go/no-go task,
decision-making consists of deciding whether the image contains a target object/category
or not. In contrast, in a two-choice categorization task, a decision consists in deciding,
whether the image (or object) belongs to one category or another. Therefore, a go/no-go
task requires the activation of one category representation, whereas in a two-choice task
different images/objects can activate different category representations (e.g. animals and
vehicles). Second, what kind of visual properties can appear in the visual ERPs? Are
these low-level properties or higher-level processes? Do they reflect category-specific
processes, or just systematic differences between stimulus sets? The studies presented in
the next sections are focused on questions about the role of the categorization method and
low-level stimulus properties.
The effect of the categorization task
VanRullen and Thorpe (2001) suggested that the differences in the time-window
of the N1 component reflect decision-making processes. In that study, participants had to
perform two go/no-go tasks where either animals or vehicles were the targets. In many
studies, however, the animal is the only target category in the go/no-go task (e.g.
Rousselet et al., 2002; Thorpe et al., 1996). Therefore, differences in the ERPs can reflect
either animate-inanimate differences or target vs. non-target differences. As described
above, other studies, on the other hand, used a two-choice, animate vs. inanimate task
(Antal et al., 2001, 2000). In this task, the decision-making also requires
category-specificity. In order to investigate the role of the categorization method, a few studies
have compared category differences in different categorization tasks (Delorme et al.,
Kincses et al. (2006) compared an animal/non-animal two choice categorization task, an
animal/non-animal go/no-go task, and an animal counting task. ERP difference for animal
vs. non-animal categories were found earlier in time for the go/no-go task than in the
two-choice task. No animal/non-animal difference was found in the animal counting task. This
suggests that decision-making processes do play a role in eliciting category differences.
Kincses et al. (2006) suggested, that the temporal differences are due to top-down effects.
While in the go/no-go task only one category template is needed to perform the task, the
two-choice task requires two templates. These templates might have integrated with the
bottom-up information processing differently, causing dissimilarities in the ERP
waveforms (Kincses et al., 2006).
The role of template as a top-down factor has been also investigated in a
single-photograph recognition task in comparison with an animal/non-animal go/no-go task
(Delorme et al., 2004). In the single target-photograph recognition task participants had to
memorize a target photograph at the beginning of each testing block During the testing
phase they had to respond as quickly as possible when they saw the memorized image.
This task was assumed to maximize the use of top-down processes, since the recognition
can rely on target-specific low-level features, such as edges and contours, that are stored
in memory and, as a top-down template, can enable fast recognition. Indeed, the
difference between target and non-target waveforms appeared 30 - 40 ms earlier in the
photograph recognition task (starting at 135 ms after stimulus onset) compared to the
go/no-go task (169 ms after stimulus onset) over the occipital area. Source localization
did not show any difference between the two tasks; the differential ERP waveforms were
localized in the temporal cortex. Delorme et al. (2004) concluded that the stimuli were
processed along the same visual network regardless of the task; however, the speed of the
Johnson and Olshausen (2003) compared a two-choice, a go/no-go and a cued
target tasks. In the two-choice and go/no-go task participants had to make an animal vs.
non-animal decision. In the cued target task, first a category name appeared on the screen
and participants had to decide whether the following image belong to that category or not.
The category name could be either at superordinate level (‘animal’, ‘furniture’) or at basic
level (‘dog’, shoe). In the two-choice and go/no-go task, target vs. non-target amplitude
differences were found from around 135 ms after stimulus onset. In the cued target task,
target vs. non-target differences appeared later, between around 170 - 210 ms after
stimulus onset, depending on the level of the category cue. It has been suggested, that the
early differences between 135 -150 ms are due to low-level differences between images,
whereas recognition related ERP differences arise later, between 150 - 300 ms (Johnson
& Olshausen, 2003). These differences, however, were measured over the frontal areas.
Moreover, the authors compared target and non-target ERP waves. In the two-choice and
go/no-go task, the target vs. non-target difference was the same as that for the animal and
non-animal categories. In the cued target task, however, the cue could belong to many
categories. Therefore, in that task, the target vs. non-target differences reflected a
congruency decision between the presented word and the following image, instead of
animal vs. non-animal differences.
Overall these studies suggest that the categorization task modulates the ERP
differences. However, category specific processes and decision-making processes are
confounded in these studies. Moreover, these differences are measured at different
electrode locations. Delorme et al. (2004) conducted their analysis on both occipital and
frontal electrodes, while Johnson & Olshausen (2003) reported results only for the frontal
The effect of low-level stimulus properties on the visual ERPs
Low-level differences, such as interstimulus perceptual variance (ISVP, Thierry,
Martin, Downing, & Pegna, 2007b), and amplitude spectrum information that describes
the global spatial characteristics of an image (VanRullen, 2011) have been suggested to
play important roles for category differences in the visual ERPs. ISVP refers to the notion
that some of the frequently used stimulus categories might be less variable perceptually
than other categories. Thierry et al. (2007) pointed out that in studies where faces and cars
are used as stimuli, faces are usually presented from full front view, whereas cars are
presented from various viewpoints. They suggested that this perceptual variance between
the presented faces and cars could contribute to the face-car ERP differences. The
suggestion of an ISVP effect on the N1 component is based on the modulation of the
face-specific N170 component. Recognition of faces elicits a more negative N170
component than man-made objects or natural scenes (e.g. Rossion and Jacques, 2008).
Furthermore, the N170 amplitude is enhanced and delayed for inverted faces related to
upright ones (face-inversion effect). To control for this potential confound (Thierry et al.,
2007) designed a study in which faces and cars were presented either with high or low
ISPV. The high ISVP stimuli differed in size, eccentricity and orientation, whereas low
ISPV stimuli were matched for these characteristics. They found face vs. car differences
only in the P1 component. In contrast, the N170 amplitudes differed between stimuli with
high and low ISPV, irrespectively of the stimulus category. According to the authors,
these results question whether the N170 is indeed specific to faces, or the previously
reported effects were only due to uncontrolled low-level differences between stimulus
sets. However, this interpretation generated a big debate in the literature (Bentin et al.,
2007; Rossion & Jacques, 2008; Thierry, Martin, Downing, & Pegna, 2007a). Moreover,
these differences emerge “from low perceptual invariants” (Thierry et al., 2007, pp. 508),
such as outline, contrast or complexity. Such differences do not necessarily reflect
differences between stimulus sets; they can as well reflect category-specific low-level
features. Furthermore, even if ISVP affects ERP differences between face and non-face
objects, it is less likely to play a role in animate-inanimate ERP differences. Animate
stimuli usually consist of a large variety of animals, including mammals, bird, reptiles,
fish as well as insects, often presented in natural scenes. For inanimate stimuli, some
studies use natural and urban scenes without animals, other studies use a variety of
man-made objects. It has been argued that such variability rules out the low-level differences
that are not category specific (see VanRullen, 2011).
The amplitude spectrum (AS) of an image can also be a possible factor
contributing to low-level, category-specific differences in the ERPs, as was also shown in
the fMRI study by Andrews et al. (2010) discussed above. The AS contribution to
category-specific ERP differences has been investigated in several studies (Bieniek,
Pernet, & Rousselet, 2012; Nemeth, Kovacs, Vakli, Kovacs, & Zimmer, 2014; Rousselet,
Husk, Bennett, & Sekuler, 2008; Rousselet, Pernet, Bennett, & Sekuler, 2008). However,
results have been contradictory. Some studies found AS-related ERP differences (Nemeth
et al., 2014; Bruno Rossion & Caharel, 2011), but others did not (Bieniek et al., 2012;
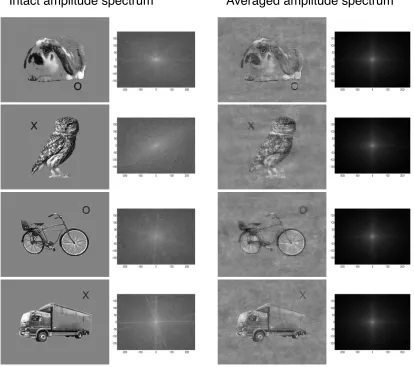
Rousselet et al., 2008). For instance, in their study, Bieniek et al., (2012) used faces and
houses as stimuli, with the AS either kept intact, swapped with the AS of the other
category (e.g. the image contained a visible face but its AS information corresponded to a
house), or it contained the averaged AS of faces and houses. In addition, they also used
phase-scrambled, unrecognizable images as stimuli. These images were produced by
scrambling the phase information of the original face and house stimuli.
information of the original image. Phase scrambled stimuli contained either face- or
house-specific AS information, or the average of the two. Differences between
recognizable faces and houses were present in the N1 time window, peaking at around
165 ms after stimulus onset. These differences were found over the temporal area, where
ERP category differences are usually measured. The authors also found differences
between face and house AS information, however, these differences occurred earlier,
peaking at 142 ms after stimulus onset, and they were present at medial-occipital
electrodes (Bieniek et al., 2012). This result is in line with the results of Andrews et al.
(2010), who found category-selective activation for Fourier-scrambled images at
medial-occipital areas.
Although this study used faces and houses as stimuli, AS has been shown to differ
also between animals and man-made objects (Torralba & Oliva, 2003; VanRullen, 2011).
Therefore, it is possible that AS also modulates animal vs. vehicle differences; however,
these differences might occur in a different time-window and at different electrode
locations than higher-level category differences similarly to the ERP differences between
recognizable and phase scrambled houses and faces in the study of Bieniek et al., (2012 -
see description above).
Role of conscious percept
In contrast to studies emphasizing the role of low-level differences as underlying
factors behind ERP category differences, other results suggest that ERP differences
reflect some aspects of the percept (the consciously perceived impression of an object) as
ERP differences have been found to correlate with behavioral results (Bacon-Macé et al.,
2005; Macé et al., 2005). In the study of Bacon-Mace et al. (2005) stimuli were natural
followed by a dynamic mask, which is known to interrupt the processing of the
previously presented image. Participants performed a go/no-go task, indicating whether
an animal was present on the image or not. The accuracy rates were higher when stimuli
were presented longer, and they decreased with the shorter presentation times. The ERP
differences between animals and non-animals started at 150 ms after stimulus onset.
Moreover, the differential ERP activity in the time window of the N1 and P2 components
decreased with the shorter stimulus presentation time. The amplitude of the differential
brain activity correlated with the ratio of the correct answers. Therefore, the more likely
participants recognized the animal in the image, the larger the ERP amplitude differences
were between animals and non-animals. It has been suggested that with the longer time
before the appearance of the mask, more cues could accumulate to dissociate animal and
non-animal images and this led to more correct responses and larger category differences
in the ERPs (Bacon-Macé et al., 2005).
Macé et al. (2005) reported similar results when the contrasts of the images were
manipulated. They found lower accuracy rates in recognizing animals for images with
lower contrast. Furthermore, the animal vs. non-animal differences in the occipital ERPs
also decreased with lower contrast. The stimulus presentation time was 28 ms in this
study for all stimuli; however, no mask was presented to interrupt the ongoing processing
after the stimulus disappeared. Nevertheless, the reaction times increased for images with
lower contrast, and the increasing reaction times correlated with the latency of the peak of
the differential activity between animal and non-animal images. Again, this was
interpreted as a cue accumulation process: the less recognizable the image was, the more
time was needed to gather evidence for the recognition of an animal (Macé et al., 2005).
Beside cue accumulation for decision-making, these results also suggest that the
images. The bigger the differential activity was, the more likely the images were
processed and images containing an animal discriminated from images without an animal.
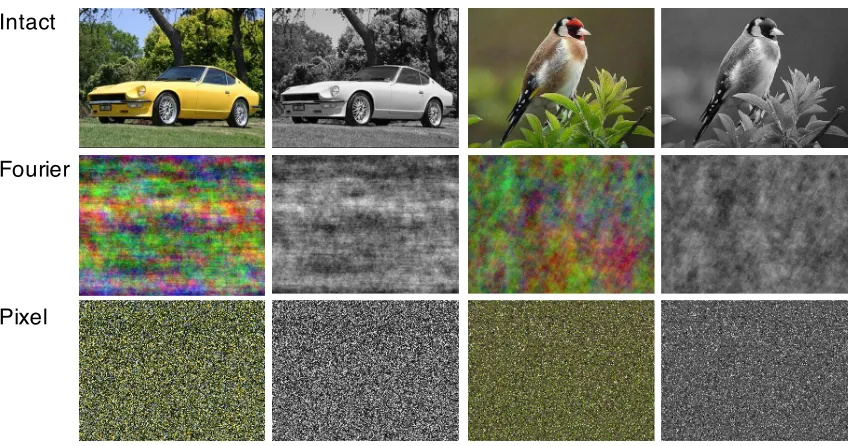
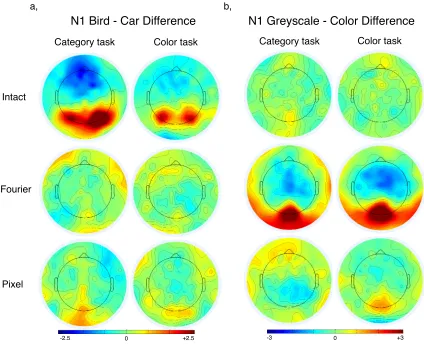
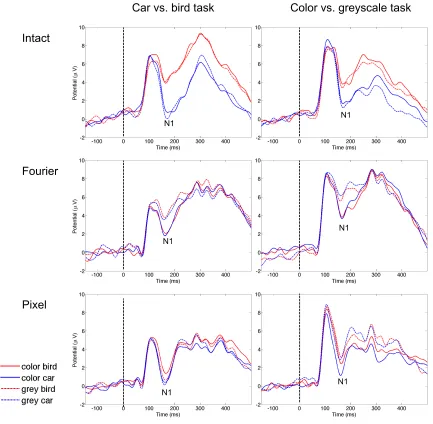
The results of Rokszin et al. (2015) also suggest a similar interpretation. In that study,
participants performed a car vs. bird discrimination task on intact and pixel-scrambled
stimuli presented either in color and or greyscale versions. Scrambled stimuli were
produced by cutting the original images into smaller squares, and these squares were
randomly shuffled within an image. The sizes of the shuffled squares were 40x40, 20x20
and 2x2 pixels for the different stimulus types. The accuracy rates were around 95, 80, 70
and 50 % for the intact, 40x40, 20x20, and 2x2 pixels stimuli, respectively. Therefore, the
recognizability of the car and bird categories decreased with the smaller square size. The
color differences in the visual ERPs, on the other hand, increased from intact to 20x20
pixel images. In this study, the categorization task did not require color discrimination.
When the objects were intact the color difference was not salient. With the harder
recognizability of the objects, the color difference became more salient. This again
suggests that the category differences in the ERPs, at least to some degree, reflect how the
image is perceived. If category differences in the visual ERPs reflect at least some aspects
of the percept, this means these differences should reflect some kind of visual category
representations.
Correspondence between modulation of category-specific representations and
modulation of category-specific ERPs
Visual ERPs and category-specific ERP responses are widely used; however,
different interpretations have been suggested to explain these differences. The source of
differences at different electrode locations, in different tasks and for different object
categories. Furthermore, many studies have looked at the ERP components as distinct
entities, and did not consider spatial and temporal factors, or the accumulating evidence
about visual information processing, such as the existence of stable category
representations in the visual areas and the role of top-down mechanisms. The aim of this
section is to point out the similarities between modulations of the visual ERP differences
and activation of category representations in the brain.
ERP category differences are mainly reported for animate and inanimate
categories, and for faces and man-made objects. According to the studies presented in the
previous section, animals, faces and inanimate objects are categorically represented in the
LOC (Kiani et al., 2007; Kriegeskorte et al., 2008; Mur et al., 2013). Moreover, source
localization methods suggest that the source of the of the animal vs. non-animal ERP
difference is in the LOC (Codispoti et al., 2006; Kincses et al., 2006), where animate and
inanimate categories are represented. In addition, some studies have provided evidence
that the ERP differences, at least partly, reflect some aspects of the percept (Bacon-Macé
et al., 2005; Macé et al., 2005; Rokszin et al., 2015). This is in line with the assumption
that the visual system reconstructs the outside world as an inner representation and it
provides the percept of the outside objects. Furthermore, studies showing that top-down
processes such as mental imagery or expectation activate the same category-specific
representations as seeing those categories, suggesting that these category representations
should reflect some aspects of the percept.
Beside category representations, visual ERPs can also reflect shape-specificity,
similarly to LOC representations. ERP differences have been found between inanimate
object categories, such as cars vs. non-car vehicles (VanRullen & Thorpe, 2001) and cars
categories are represented by perceptual similarity in the LOC. Furthermore, ERP
differences have been reported between computer-generated meaningless objects (Curran,
Tanaka, & Weiskopf, 2002; Tokudome & Wang, 2012). In the study of Tokudome and
Wang (2012), participants were trained to recognize four different artificially created
highly similar 3D objects from four different viewpoints. Before training, the N1
amplitudes were more similar for different objects depicted from the same visual angle
and more variable for the different viewpoints of one object. In contrast, after training
when participants had learned to differentiate between the objects, the N1 amplitudes
were more similar for the different viewpoints of one object, and they varied more
between different objects (Tokudome & Wang, 2012). Therefore, before training, N1
amplitudes reflected perceptual similarity, which has been suggested to be the main
organizing factor for shape representations in the LOC (Kriegeskorte et al., 2008). In
contrast, after training, the N1 amplitudes reflected object-selectivity and viewpoint
invariance. This is in line with findings indicating that IT neurons are shape-selective and
they represent information in a viewpoint-independent manner (Tompa & Sáry, 2010).
Finally, top-down, attention- and task-related modulation have been shown to
affect the firing of IT cells in monkeys (for review see Tompa & Sáry, 2010).
Furthermore, expectation, or selective attention, as top-down factors, have been shown to
affect bottom-up stimulus processing in humans (Bugatus et al., 2017; Puri et al., 2009).
In a previous section, studies suggesting task-related modulation of animate vs. inanimate
category differences have been already discussed. However, in those studies, category
differences and decision-making processes were somewhat intermixed. In ERP studies,
when category differences are measured, participants usually perform some kind of
categorization or recognition task. Furthermore, the categories defined by the task are